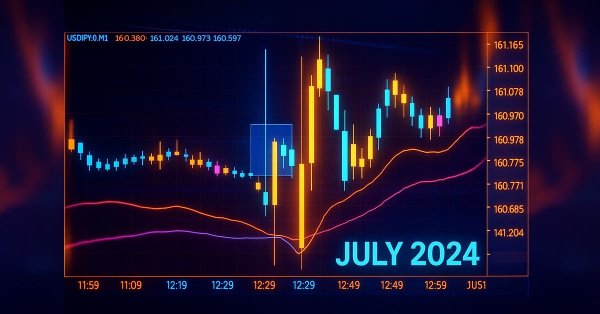
From Novice to Expert: Animated News Headline Using MQL5 (VII) — Post Impact Strategy for News Trading
Contents:
- Introduction
- Exploring the Strategy Concept
- Final Implementation — Integration of the After Impact Strategy into the News Headline EA
- Testing
- Conclusion
- Key Lessons
- Attachments
Introduction
The strategy we explored in the previous article centered on placing pending orders shortly before a high-impact news release. The goal was to capture profits from the sharp price movements that often follow such events. While this approach can be effective, there are scenarios where it falls short—such as when one of the orders is triggered but fails to reach the take profit level, eventually hitting the stop loss instead.
Fortunately, in our earlier implementation, we built logic into the EA to automatically cancel the opposite pending order as soon as one is triggered. This automation is crucial, as it prevents both orders from being activated during a whipsaw, a situation that could otherwise result in a double loss. By relying on algorithmic speed to make these decisions within milliseconds, the EA offers a level of precision that is nearly impossible to achieve manually.
However, if a trader wishes to avoid this whipsaw risk entirely, an alternative strategy becomes necessary. In this discussion, we turn our attention to a post-news trading strategy—executing trades after the high-impact event—designed to complement and expand the capabilities of the existing News Headline EA.
In the next section, we’ll dive into the integration plan for this strategy and assess its feasibility through chart history analysis and live logic implementation.
Exploring the Strategy Concept
For our testing and research, we plan to use historical chart data to analyze market behavior following high-impact news events, particularly the Non-Farm Payroll (NFP) releases. Since NFP announcements are consistently scheduled (typically the first Friday of each month), they are easy to identify and align with known calendar dates. This makes them ideal for studying how price action responds in the minutes and hours following the news.
By referencing NFP dates on the economic calendar and observing the minute time frame chart data around those events, we can gain valuable insights into how different instruments behave after the news impact. This approach enables us to design and fine-tune our after-impact trading tool, which will complement the existing pending-order strategy by providing entry opportunities once the initial volatility settles and a clear direction emerges.
This method of historical testing allows us to simulate and refine trading logic even outside real-time market conditions, making it an effective way to validate our post-news execution framework before full implementation. Read below to find more detail.
Exploring Price Action History with a Custom Expert Advisor
In this section, we will develop an Expert Advisor (EA) in MQL5 that allows us to "time travel" through historical chart data using the MetaTrader 5 Strategy Tester. The goal is to manually observe price action shortly after major economic impacts—particularly Non-Farm Payroll (NFP) releases—and gather valuable insights for designing our post-impact trading strategy.
This stage serves as a hands-on learning opportunity to deepen our understanding of MQL5 programming while also familiarizing ourselves with how the Strategy Tester operates. By focusing on specific historical events, we can simulate real market conditions and analyze how price behaved in the moments following high-impact news.
The knowledge and observations gained from this testing phase will help us validate our trading assumptions before moving into final implementation. Ultimately, this sets the foundation for integrating a refined post-impact trading logic into the main News Headline EA, enabling it to prepare for news and act intelligently in the aftermath.
The Non-Farm Payrolls (NFP) report is among the most impactful economic releases in the financial markets, especially for currency pairs that include the US Dollar (USD). Its announcement typically causes immediate and often sharp price movements—making it an ideal candidate for both pre- and post-news trading strategies. For testing and strategy development, USD-major pairs like EURUSD, GBPUSD, USDJPY, and USDCHF are the most relevant instruments because they react most consistently and significantly to NFP releases. This makes them perfect testing grounds for algorithms aiming to exploit volatility patterns surrounding major economic news.
Before diving into the full logic and functionality of the NFP_Event_Replay.mq5 Expert Advisor, it’s important to understand how to begin coding such a tool. In MetaTrader 5, launch the MetaEditor, then go to File/New/Expert Advisor... (template) and provide a name like NFP_Event_Replay. This will generate a basic structure with OnInit(), OnDeinit(), and OnTick() functions. From there, you can begin building your logic—starting with time checks, news day identification, and drawing tools—gradually evolving the skeleton into a fully functional historical event highlighter as we explore in the sections below.
This breakdown will walk through each part of the EA, helping both beginner and intermediate MQL5 developers understand how to highlight past NFP events programmatically past NFP events on historical charts using rectangles, time logic, and timezone-aware calculations—a powerful way to visually study and refine after-news trading strategies.
1. Metadata and User Inputs
At the beginning of the EA, metadata describes the author, version, and purpose of the Expert Advisor. The key feature of this tool is to help traders visually replay and study NFP (Non-Farm Payroll) market behavior in the MetaTrader 5 Strategy Tester. Two user inputs—MinutesBefore and MinutesAfter—let the trader define the size of the window (in minutes) before and after the event in which price action will be highlighted. This allows customization based on how much of the price movement around the news release you want to study.
input int MinutesBefore = 5;
input int MinutesAfter = 5;
2. Globals and Initialization
Global variables are declared to manage the rectangle's name, track the current year and month when a drawing was last created, and prevent repetitive alerting. These help in controlling the logic flow, ensuring that rectangles are not repeatedly drawn on the same day and that cleanup is properly handled during initialization and deinitialization.
string rectName = "NFP_Event_Window";
int drawnYear = 0, drawnMonth = 0;
bool alertShown = false;
3. First Friday Calculation
One of the key pieces of logic is determining the date of the first Friday in each month. This is essential because NFP is released on the first Friday of every month. The EA uses calendar calculations to find this date dynamically, based on the current year and month, which allows the EA to be reused in future years without modification.
//+------------------------------------------------------------------+
//| Calculate day of first Friday                                    |
//+------------------------------------------------------------------+
int GetFirstFriday(int year, int month)
{
    MqlDateTime dt = {0};
    dt.year = year;
    dt.mon = month;
    dt.day = 1;
    datetime first = StructToTime(dt);
    TimeToStruct(first, dt);

    // Calculate days to first Friday (5 = Friday)
    int daysToAdd = (5 - dt.day_of_week + 7) % 7;
    return 1 + daysToAdd;
}
4. IsFirstFriday Check
This function evaluates if the current datetime being processed belongs to the first Friday of the month. It relies on the previous first-Friday logic and compares the current day and weekday to determine eligibility. This check serves as a gateway to prevent unnecessary computations or rectangle drawings on non-NFP days.
//+------------------------------------------------------------------+
//| Check if date is first Friday                                    |
//+------------------------------------------------------------------+
bool IsFirstFriday(datetime time)
{
    MqlDateTime dt;
    TimeToStruct(time, dt);
    int firstFriday = GetFirstFriday(dt.year, dt.mon);
    return (dt.day_of_week == 5 && dt.day == firstFriday);
}
5. GetTimeGMTOffset
This function determines the broker's local offset from GMT (UTC) based on the server time. Since NFP events are announced in U.S. Eastern Time (which can be UTC-4 or UTC-5 depending on daylight saving), this offset is required to convert the event timestamp correctly to match the broker’s timezone and chart time.
//+------------------------------------------------------------------+
//| Get UTC offset for a specific time                               |
//+------------------------------------------------------------------+
int GetTimeGMTOffset(datetime time)
{
    MqlDateTime dt;
    TimeToStruct(time, dt);
    datetime timeUTC = StructToTime(dt);
    return (int)(time - timeUTC);
}
6. EA Initialization and Cleanup
When the EA is initialized (OnInit), it sets a 1-second timer, which acts as a heartbeat for continuously checking whether we’re on a relevant NFP date. Upon deinitialization (OnDeinit), it stops the timer and deletes the rectangle object if it was drawn. This ensures that testing sessions start cleanly and do not leave residual graphics on the chart.
//+------------------------------------------------------------------+
//| Program entry point                                              |
//+------------------------------------------------------------------+
int OnInit()
{
    EventSetTimer(1);
    return(INIT_SUCCEEDED);
}

//+------------------------------------------------------------------+
//| Cleanup on exit                                                  |
//+------------------------------------------------------------------+
void OnDeinit(const int reason)
{
    EventKillTimer();
    ObjectDelete(0, rectName);
}
7. OnTimer: The Heart of the EA
The OnTimer function is the main execution block, called every second by the timer. It avoids redundant processing by checking for changes in the current chart time. If the day is a valid first Friday, it calculates the NFP release timestamp for the current year and month, applies any necessary timezone offset, and then checks whether the current time falls within the user-defined rectangle window. If conditions are met and the drawing for the current month hasn’t already occurred, it draws the event rectangle. Additionally, debug messages are printed for better visibility when testing. Outside NFP days, the EA resets tracking variables and removes any existing drawing.
//+------------------------------------------------------------------+
//| Timer handler - main logic                                       |
//+------------------------------------------------------------------+
void OnTimer()
{
    static datetime lastBarTime = 0;
    datetime now = TimeCurrent();

    if(now == lastBarTime) return;
    lastBarTime = now;

    MqlDateTime dtNow;
    TimeToStruct(now, dtNow);

    // Process only on first Fridays
    if(IsFirstFriday(now))
    {
        // Show alert once per day
        if(!alertShown)
        {
            Alert("NFP Day: Set tester replay speed to 70%");
            alertShown = true;
        }

        // Calculate exact NFP release time in UTC
        int releaseDay = GetFirstFriday(dtNow.year, dtNow.mon);
        datetime nfpUTC = GetNFPTimestamp(dtNow.year, dtNow.mon, releaseDay);

        // Convert to broker time (Zimbabwe CAT = UTC+2)
        int offset = GetTimeGMTOffset(now);
        datetime nfpBroker = nfpUTC + offset;

        // Calculate rectangle boundaries
        datetime startTime = nfpBroker - MinutesBefore*60;
        datetime endTime = nfpBroker + MinutesAfter*60;

        // Draw rectangle if in time window
        if(now >= startTime && now <= endTime)
        {
            if(drawnYear != dtNow.year || drawnMonth != dtNow.mon)
            {
                DrawEventWindow(startTime, endTime);
                drawnYear = dtNow.year;
                drawnMonth = dtNow.mon;

                // Debug output
                Print("NFP UTC Time: ", TimeToString(nfpUTC, TIME_MINUTES|TIME_SECONDS));
                Print("Broker Time: ", TimeToString(now, TIME_MINUTES|TIME_SECONDS));
                Print("NFP Broker Time: ", TimeToString(nfpBroker, TIME_MINUTES|TIME_SECONDS));
                Print("Event Window: ", TimeToString(startTime), " to ", TimeToString(endTime));
            }
        }
    }
    else
    {
        alertShown = false;
        if(drawnYear != 0 || drawnMonth != 0)
        {
            ObjectDelete(0, rectName);
            drawnYear = 0;
            drawnMonth = 0;
        }
    }
}
8. GetNFPTimestamp: NFP at 8:30 AM Eastern
This function builds the exact UTC timestamp of the NFP release. It incorporates U.S. daylight saving logic to determine whether the release time should be considered as 12:30 UTC (summer) or 13:30 UTC (winter). This precise timestamp is essential to synchronize the chart window with real-world event timing.
//+------------------------------------------------------------------+
//| Create precise UTC timestamp for NFP event                       |
//+------------------------------------------------------------------+
datetime GetNFPTimestamp(int year, int month, int day)
{
    MqlDateTime dt = {0};
    dt.year = year;
    dt.mon = month;
    dt.day = day;

    // Determine correct UTC hour based on US daylight saving
    // US Eastern Time: EST = UTC-5 (winter), EDT = UTC-4 (summer)
    // NFP always releases at 8:30 AM US Eastern Time
    bool isDst = IsUSDST(StructToTime(dt));
    dt.hour = isDst ? 12 : 13;  // 12:30 UTC (summer) or 13:30 UTC (winter)
    dt.min = 30;

    return StructToTime(dt);
}
9. Daylight Saving Time Logic
To account for changes in U.S. daylight saving time (DST), this function calculates whether a given date falls within the DST window. According to U.S. law, DST begins on the second Sunday in March and ends on the first Sunday in November. By computing the boundaries for each year and checking the date against them, the EA dynamically adapts its timestamp calculation throughout the year.
//+------------------------------------------------------------------+
//| Check if US is in daylight saving time                           |
//+------------------------------------------------------------------+
bool IsUSDST(datetime time)
{
    MqlDateTime dt;
    TimeToStruct(time, dt);

    // US DST rules (since 2007):
    // Starts: Second Sunday in March at 2:00 AM
    // Ends: First Sunday in November at 2:00 AM

    // Calculate DST start
    datetime dstStart = GetNthDayOfMonth(dt.year, 3, 0, 2) + (2 * 3600);  // Second Sunday in March at 2:00 AM
    // Calculate DST end
    datetime dstEnd = GetNthDayOfMonth(dt.year, 11, 0, 1) + (2 * 3600);    // First Sunday in November at 2:00 AM

    return (time >= dstStart && time < dstEnd);
}
10. GetNthDayOfMonth
This utility function finds the nth occurrence of a specific weekday in a given month. For example, it can return the second Sunday in March or the first Sunday in November, which is used to determine DST changeover points. This function makes the EA robust and forward-compatible, allowing it to adapt automatically across years without requiring updates.
//+------------------------------------------------------------------+
//| Get nth day of week in a month                                   |
//+------------------------------------------------------------------+
datetime GetNthDayOfMonth(int year, int month, int dayOfWeek, int nth)
{
    MqlDateTime dtFirst = {0};
    dtFirst.year = year;
    dtFirst.mon = month;
    dtFirst.day = 1;
    datetime first = StructToTime(dtFirst);

    MqlDateTime dt;
    TimeToStruct(first, dt);
    int firstDayOfWeek = dt.day_of_week;

    // Calculate days to the first occurrence
    int daysToAdd = (dayOfWeek - firstDayOfWeek + 7) % 7;
    datetime firstOccurrence = first + daysToAdd * 86400;

    // Add weeks for nth occurrence
    if(nth > 1)
    {
        firstOccurrence += (nth - 1) * 7 * 86400;
    }

    // Verify if still in same month
    TimeToStruct(firstOccurrence, dt);
    if(dt.mon != month)
    {
        // Adjust to last occurrence in month
        firstOccurrence -= 7 * 86400;
    }

    return firstOccurrence;
}
11. Drawing the Rectangle on the Chart
Once the correct time window for NFP is determined, the EA creates a rectangle spanning that time period. The rectangle covers the full visible price range and is styled with distinct visual properties, such as dashed borders and a light blue background fill. If a rectangle already exists from a previous run, it is first deleted to prevent overlap or duplication.
//+------------------------------------------------------------------+
//| Draw the NFP event window on chart                               |
//+------------------------------------------------------------------+
void DrawEventWindow(datetime start, datetime end)
{
    ObjectDelete(0, rectName);

    double high = ChartGetDouble(0, CHART_PRICE_MAX);
    double low = ChartGetDouble(0, CHART_PRICE_MIN);

    if(ObjectCreate(0, rectName, OBJ_RECTANGLE, 0, start, high, end, low))
    {
        ObjectSetInteger(0, rectName, OBJPROP_COLOR, clrDodgerBlue);
        ObjectSetInteger(0, rectName, OBJPROP_STYLE, STYLE_DASHDOT);
        ObjectSetInteger(0, rectName, OBJPROP_WIDTH, 2);
        ObjectSetInteger(0, rectName, OBJPROP_BACK, true);
        ObjectSetInteger(0, rectName, OBJPROP_FILL, true);
        ObjectSetInteger(0, rectName, OBJPROP_BGCOLOR, C'240,248,255'); // AliceBlue
    }
}
12. OnTick (Placeholder)
While the EA is designed to operate using time-based events rather than price ticks, an empty OnTick function is still defined for completeness and compatibility. It serves no purpose in this implementation but is required by the MetaTrader EA structure.
Testing the NFP_Event Replay
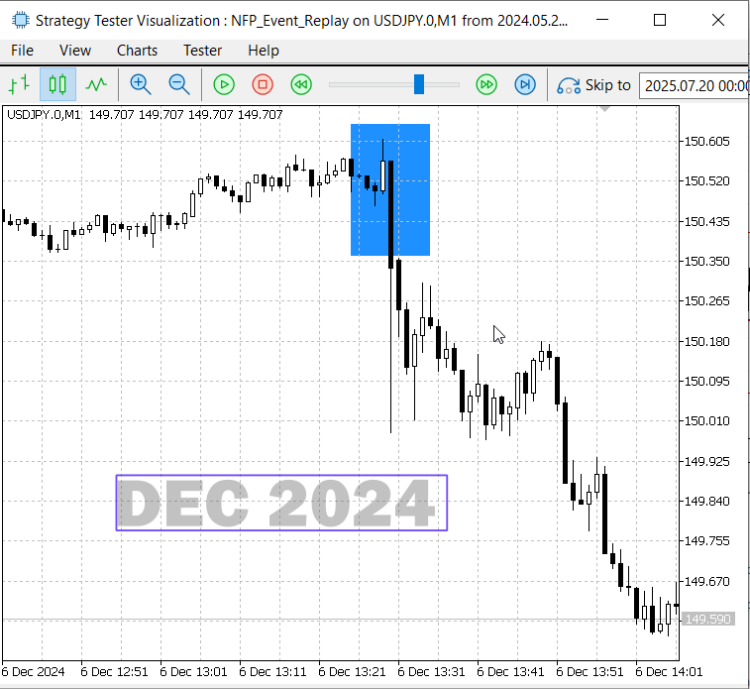
After successfully compiling the complete EA from the code sections above, we proceeded to test its functionality using the Strategy Tester’s Visualization mode in MetaTrader 5. The results were impressive—on each identified NFP release day, the EA accurately highlighted the event window with a clrAliceBlue rectangle. This visual marker allowed us to easily pinpoint the price behavior surrounding the NFP announcement. In particular, the replay segment from June 2024 to December 2024 clearly illustrates the typical volatility spike associated with NFP, confirming that the EA correctly identifies and marks the event period. Below the results, I have compiled some of the recorded chart snippets, which will now be analyzed to develop a robust after-impact trading strategy based on post-NFP price behavior.
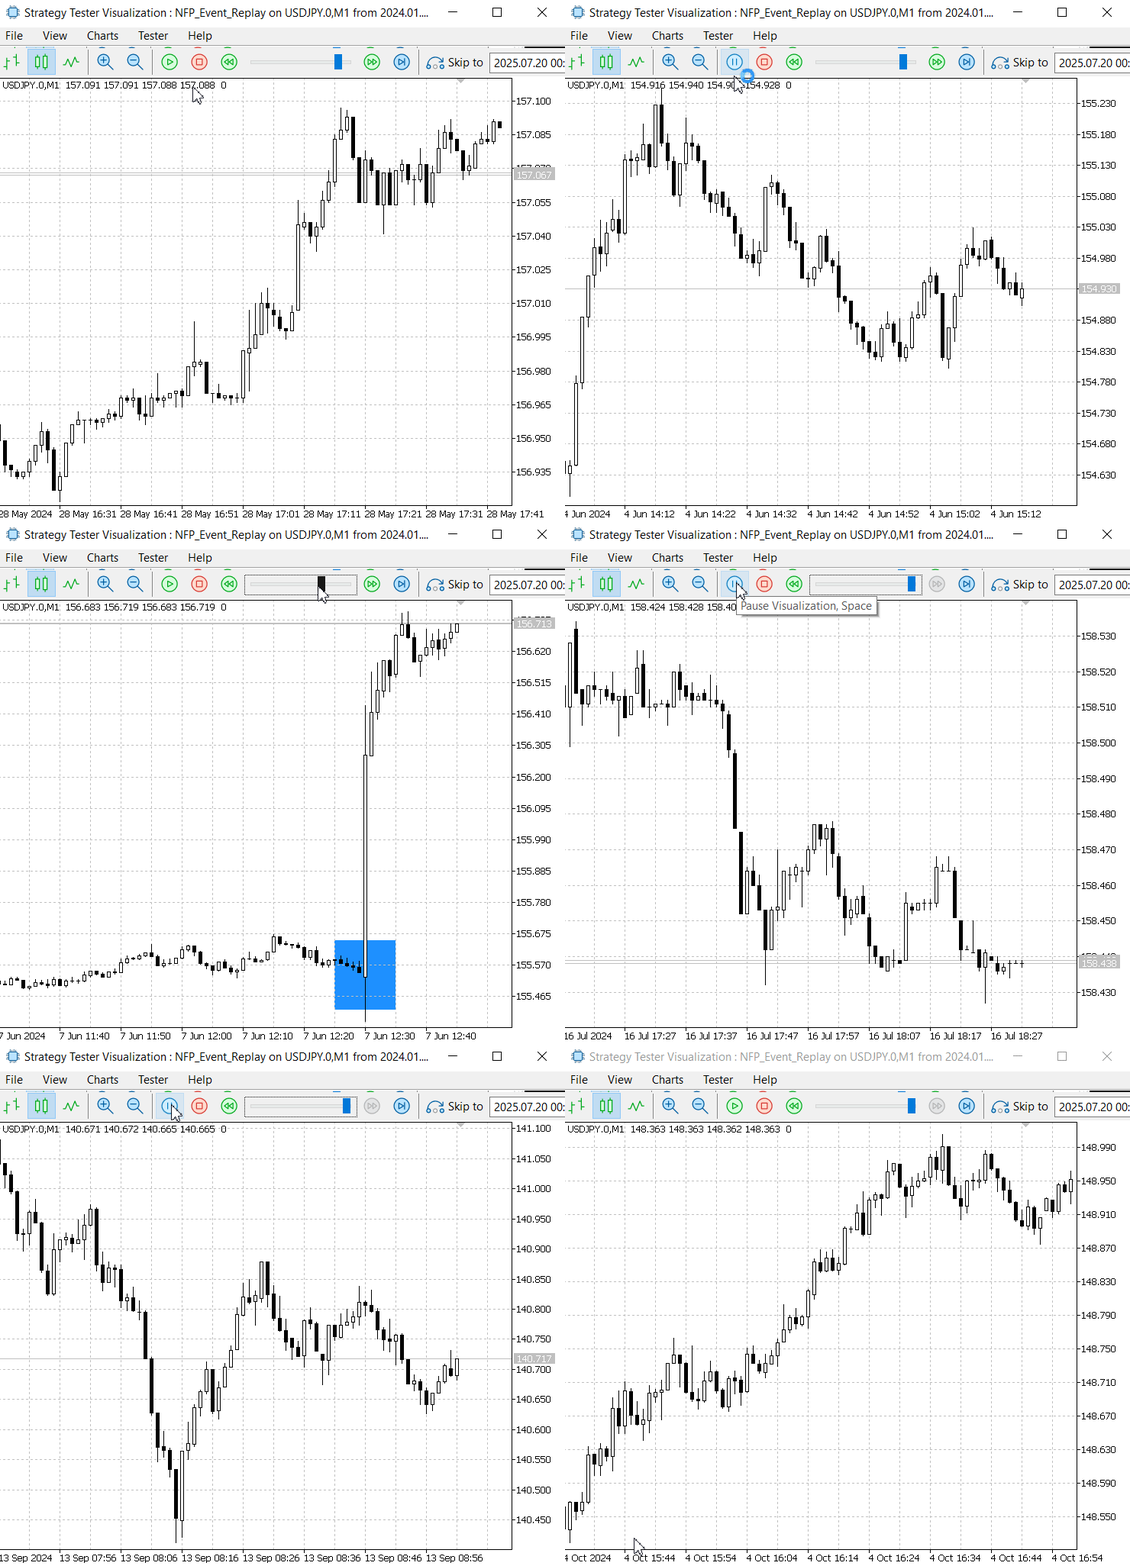
Testing the NFP_Event_Replay
Tester Log:
2025.07.17 19:20:59.343 USDJPY.0: symbol to be synchronized
2025.07.17 19:20:59.346 USDJPY.0: symbol synchronized, 3960 bytes of symbol info received
2025.07.17 19:20:59.347 USDJPY.0: history synchronization started
2025.07.17 19:20:59.514 USDJPY.0: load 31 bytes of history data to synchronize in 0:00:00.013
2025.07.17 19:20:59.514 USDJPY.0: history synchronized from 2024.05.26 to 2025.07.20
2025.07.17 19:20:59.547 USDJPY.0: start time changed to 2024.05.27 00:00 to provide data at beginning
2025.07.17 19:20:59.548 USDJPY.0,M1: history cache allocated for 224402 bars and contains 173 bars from 2024.05.26 21:05 to 2024.05.26 23:59
2025.07.17 19:20:59.548 USDJPY.0,M1: history begins from 2024.05.26 21:05
2025.07.17 19:20:59.563 USDJPY.0,M1 (Deriv-Demo): every tick generating
2025.07.17 19:20:59.563 USDJPY.0,M1: testing of Experts\NFP_Event_Replay.ex5 from 2024.01.01 00:00 to 2024.12.31 00:00 started with inputs:
2025.07.17 19:20:59.563   MinutesBefore=5
2025.07.17 19:20:59.563   MinutesAfter=5
2025.07.17 19:29:59.082 2024.06.07 00:00:00   Alert: NFP Day: Set tester replay speed to 70%
2025.07.17 19:30:02.995 2024.06.07 12:25:00   NFP UTC Time: 12:30:00
2025.07.17 19:30:02.995 2024.06.07 12:25:00   Broker Time: 12:25:00
2025.07.17 19:30:02.995 2024.06.07 12:25:00   NFP Broker Time: 12:30:00
2025.07.17 19:30:02.995 2024.06.07 12:25:00   Event Window: 2024.06.07 12:25 to 2024.06.07 12:35
2025.07.17 19:30:41.055 2024.07.05 00:00:00   Alert: NFP Day: Set tester replay speed to 70%
2025.07.17 19:30:41.717 2024.07.05 12:25:00   NFP UTC Time: 12:30:00
2025.07.17 19:30:41.717 2024.07.05 12:25:00   Broker Time: 12:25:00
2025.07.17 19:30:41.717 2024.07.05 12:25:00   NFP Broker Time: 12:30:00
2025.07.17 19:30:41.717 2024.07.05 12:25:00   Event Window: 2024.07.05 12:25 to 2024.07.05 12:35
2025.07.17 19:30:55.060 2024.08.02 00:00:00   Alert: NFP Day: Set tester replay speed to 70%
2025.07.17 19:30:55.551 2024.08.02 12:25:00   NFP UTC Time: 12:30:00
2025.07.17 19:30:55.551 2024.08.02 12:25:00   Broker Time: 12:25:00
2025.07.17 19:30:55.551 2024.08.02 12:25:00   NFP Broker Time: 12:30:00
2025.07.17 19:30:55.551 2024.08.02 12:25:00   Event Window: 2024.08.02 12:25 to 2024.08.02 12:35
2025.07.17 19:31:15.547 2024.09.06 00:00:00   Alert: NFP Day: Set tester replay speed to 70%
2025.07.17 19:31:16.250 2024.09.06 12:25:00   NFP UTC Time: 12:30:00
2025.07.17 19:31:16.250 2024.09.06 12:25:00   Broker Time: 12:25:00
2025.07.17 19:31:16.250 2024.09.06 12:25:00   NFP Broker Time: 12:30:00
2025.07.17 19:31:16.250 2024.09.06 12:25:00   Event Window: 2024.09.06 12:25 to 2024.09.06 12:35
2025.07.17 19:31:30.214 2024.10.04 00:00:00   Alert: NFP Day: Set tester replay speed to 70%
2025.07.17 19:31:30.699 2024.10.04 12:25:00   NFP UTC Time: 12:30:00
2025.07.17 19:31:30.699 2024.10.04 12:25:00   Broker Time: 12:25:00
2025.07.17 19:31:30.699 2024.10.04 12:25:00   NFP Broker Time: 12:30:00
2025.07.17 19:31:30.699 2024.10.04 12:25:00   Event Window: 2024.10.04 12:25 to 2024.10.04 12:35
2025.07.17 21:23:38.212 2024.11.01 00:00:00   Alert: NFP Day: Set tester replay speed to 70%
2025.07.17 21:23:38.448 2024.11.01 12:25:00   NFP UTC Time: 12:30:00
2025.07.17 21:23:38.448 2024.11.01 12:25:00   Broker Time: 12:25:00
2025.07.17 21:23:38.448 2024.11.01 12:25:00   NFP Broker Time: 12:30:00
2025.07.17 21:23:38.448 2024.11.01 12:25:00   Event Window: 2024.11.01 12:25 to 2024.11.01 12:35
2025.07.17 21:23:47.754 2024.12.06 00:00:00   Alert: NFP Day: Set tester replay speed to 70%
2025.07.17 21:23:47.940 2024.12.06 13:25:00   NFP UTC Time: 13:30:00
2025.07.17 21:23:47.940 2024.12.06 13:25:00   Broker Time: 13:25:00
2025.07.17 21:23:47.940 2024.12.06 13:25:00   NFP Broker Time: 13:30:00
2025.07.17 21:23:47.940 2024.12.06 13:25:00   Event Window: 2024.12.06 13:25 to 2024.12.06 13:35
Analysis of the NFP events after Impact
The EA effectively helped us pinpoint NFP days based on our customized logic. While the earlier animated replay offered a quick overview, it wasn't ideal for closely examining the fine details of price action due to the high playback speed. To address this, I compiled a series of still images below, allowing for a more focused and detailed analysis. These snapshots provide a clearer view of the market’s reaction around the NFP event window, making it easier to identify recurring patterns and brainstorm viable strategies to exploit after-impact movements. Go through the images and read the my thoughts just below the pictures.
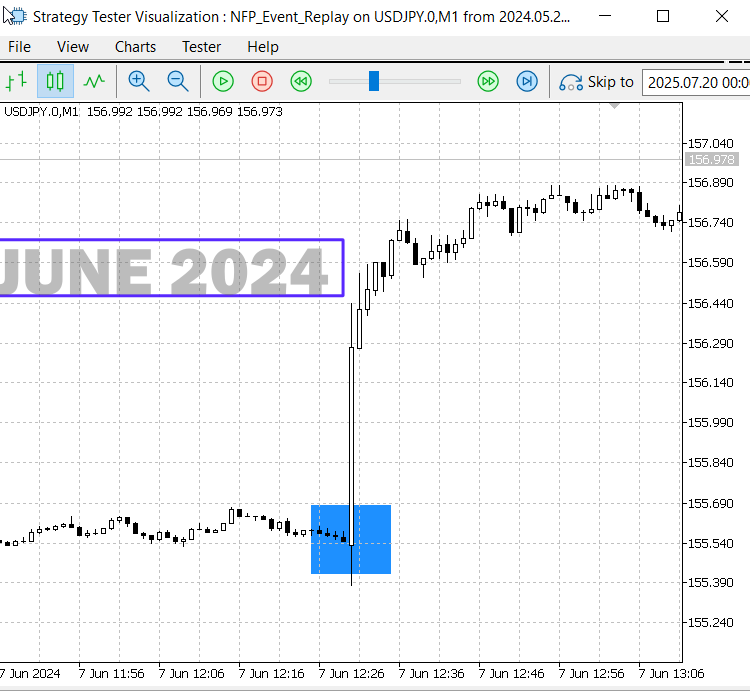
NFP June 2024
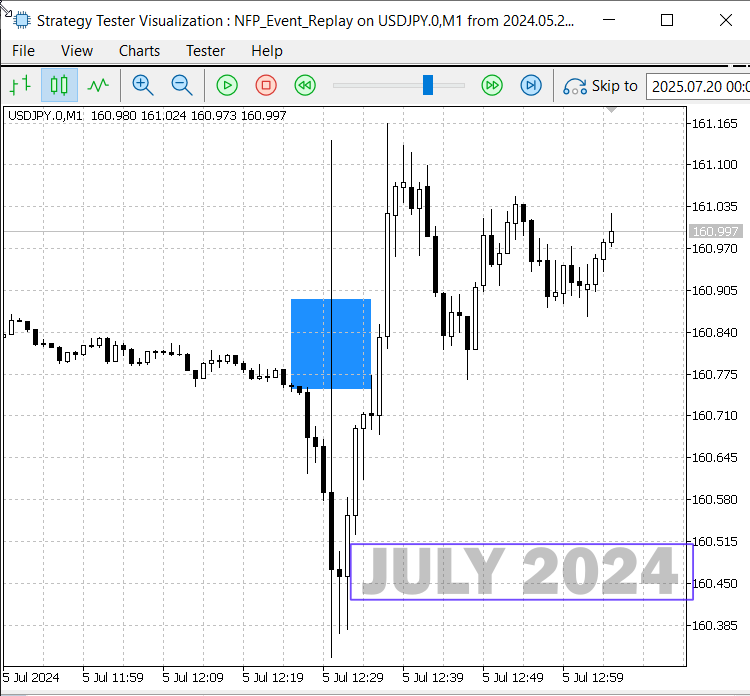
NFP July 2024
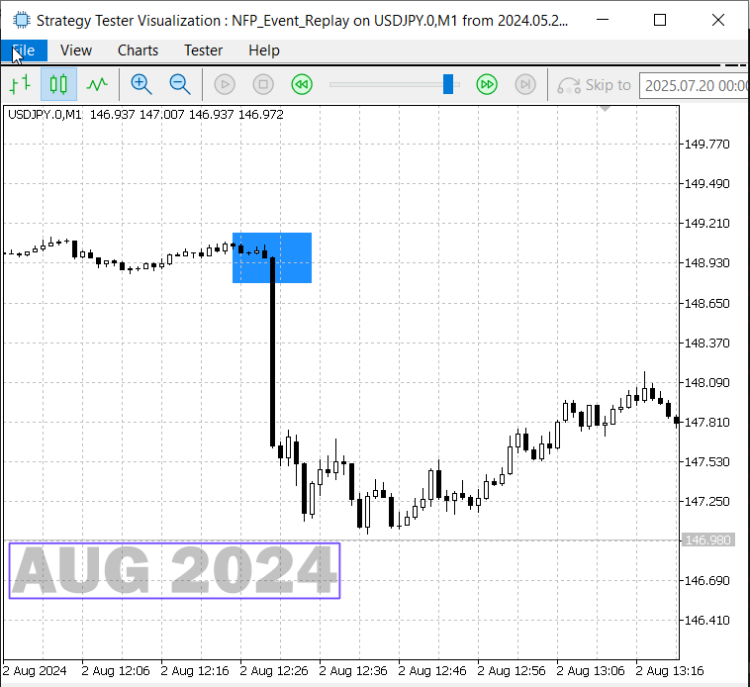
NFP Aug 2024
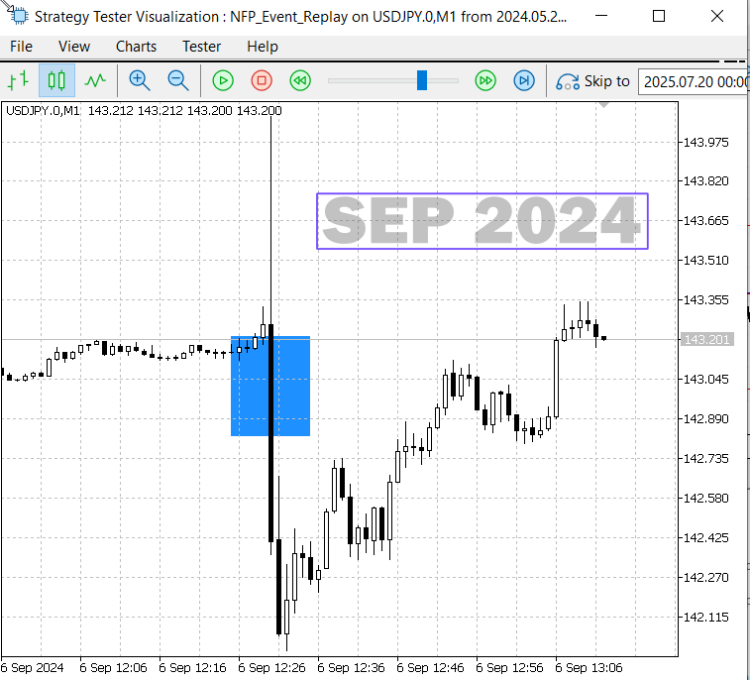
NFP Sep 2024
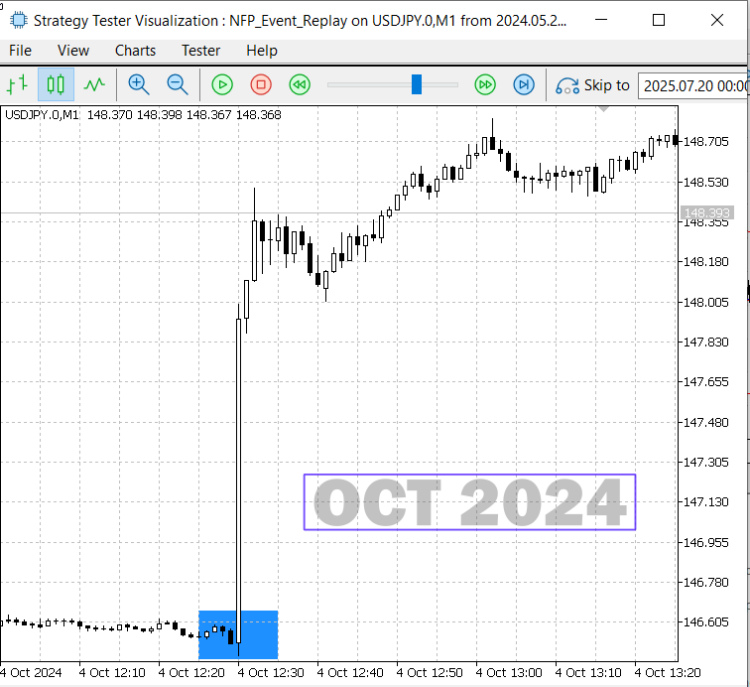
NFP Oct 2024
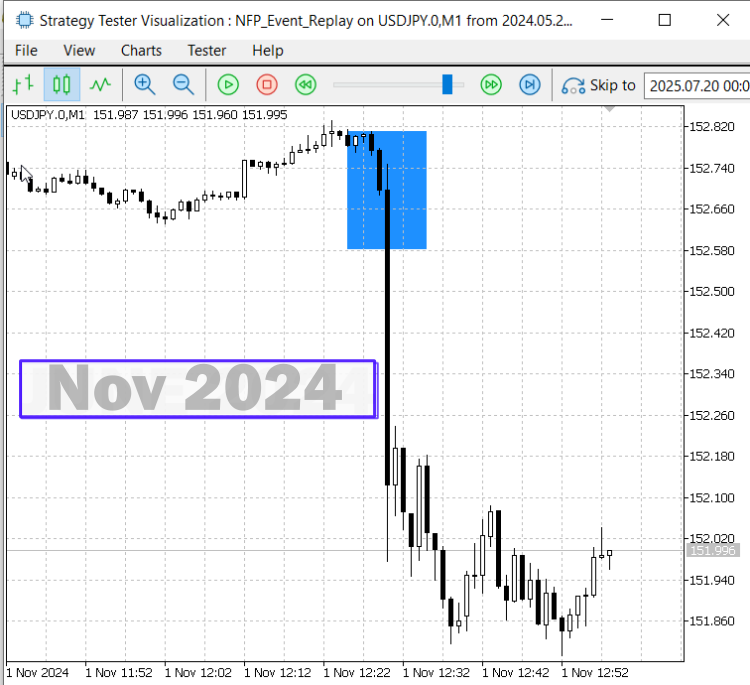
NFP Nov 2024
NFP Dec 2024
The collection of images above provides a clear visual representation of price action before, during, and after the NFP news release. These snapshots highlight how markets react to such high-impact events. I believe that with the integration of machine learning and more in-depth analysis of historical high-impact news data, many hidden patterns and trading opportunities can be uncovered. From the results observed during the second half of 2024, a key insight emerges: when two or more candlesticks followed the initial spike in the same direction, price often continued in that momentum. However, in instances where such confirmation was absent, the market failed to sustain the move, often reversing or consolidating instead.
Good examples of this behavior are seen in the June, October, and December NFP events. In June and October, strong directional movement continued for several minutes after the spike, confirming the momentum and creating potential entry opportunities. In contrast, the July event showed initial volatility but lacked follow-through, leading to a choppy or failed continuation—an important distinction when designing after-impact trading strategies.
Strategy blueprint
When a high-impact news event occurs, it often triggers a sharp bullish or bearish spike within a few ticks. In some cases, the market may quickly test both directions—up and down—before settling, which can lead to premature stop-outs or unintended triggered orders. To avoid the risks associated with this initial volatility, this strategy focuses on entering trades shortly after the spike, once the market shows clearer intent. Entry is based on confirming conditions that follow the event, rather than anticipating the move itself. Below, we outline both bullish and bearish strategy setups based on this post-impact approach.
Bullish setup
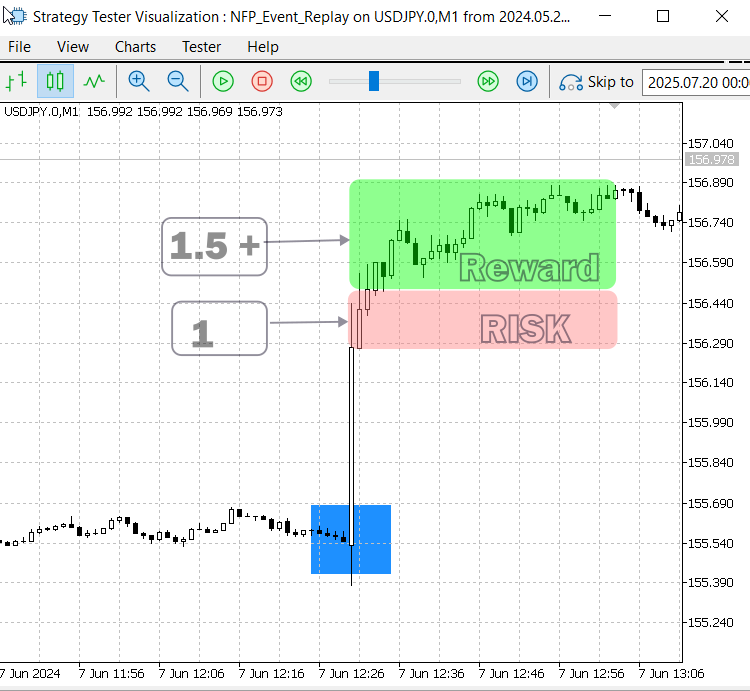
After a bullish spike triggered by a high-impact news event, our strategy requires two consecutive bullish candlesticks to follow as confirmation before entering a long position. Once these confirming candles appear, we initiate a buy trade. The price range covered by the two candles defines our risk zone—this becomes the basis for setting the stop-loss. The take-profit level should offer a reward that is greater than the risk, maintaining a favorable risk-reward ratio. In some scenarios, this setup may also signal the beginning of a strong momentum swing, offering the potential for exceptionally high returns if captured early. See the illustration below, captured from the Strategy Tester Visualization during the NFP Event Replay, highlighting the setup in action.
Post Impact Strategy — Bullish Momentum Setup
Bearish setup
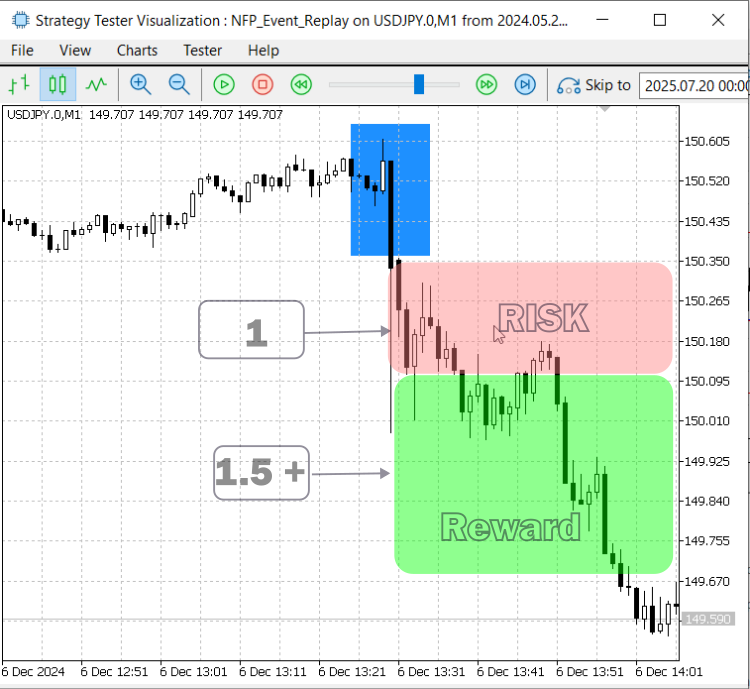
A bearish setup mirrors the approach explained in the bullish setup above. Below is an image illustrating how this pattern typically unfolds.
Post Impact Strategy — Bearish Momentum Setup
What we have accomplished above is a strategy development exercise based on price action analysis. By leveraging the power of MQL5, we built a unique EA capable of replaying and marking NFP events—something that would be tedious, time-consuming, and inefficient to perform manually. This approach has provided us with valuable insights and actionable ideas that can now be translated into trading logic. In the next step, we will focus on implementing the trading strategy, enabling the EA to detect these setups and execute trades automatically. This new logic will complement the pending order strategy we explored previously, creating a more robust and versatile news-trading tool.
Final Implementation — Integration of the Post Impact Strategy into the News Headline EA
To make our News Headline EA more adaptable and powerful, the next logical step is to integrate both strategies—the pending order approach and the post-impact confirmation strategy—into one seamless system. While the pending order strategy aims to capture the initial volatility spike by placing trades just before the news release, the confirmation-based strategy allows the EA to respond intelligently after the market reveals its bias.
By combining both techniques, the EA can trade both the immediate breakout and the sustained move that often follows. This dual-approach framework increases flexibility and improves the chances of catching profitable setups whether the news causes a sharp, clean breakout or a whipsaw followed by a clearer trend. In this development phase, we will embed both strategies into the EA’s logic, allowing it to select, alternate, or even combine them based on the event profile or user-defined settings.
Let’s move on to the next steps: we’ll split the code below into sections, explaining each section in detail and showing exactly how the newly added lines integrate with the existing modules and overall strategy.
Step 1: Post‑Impact Inputs Configuration
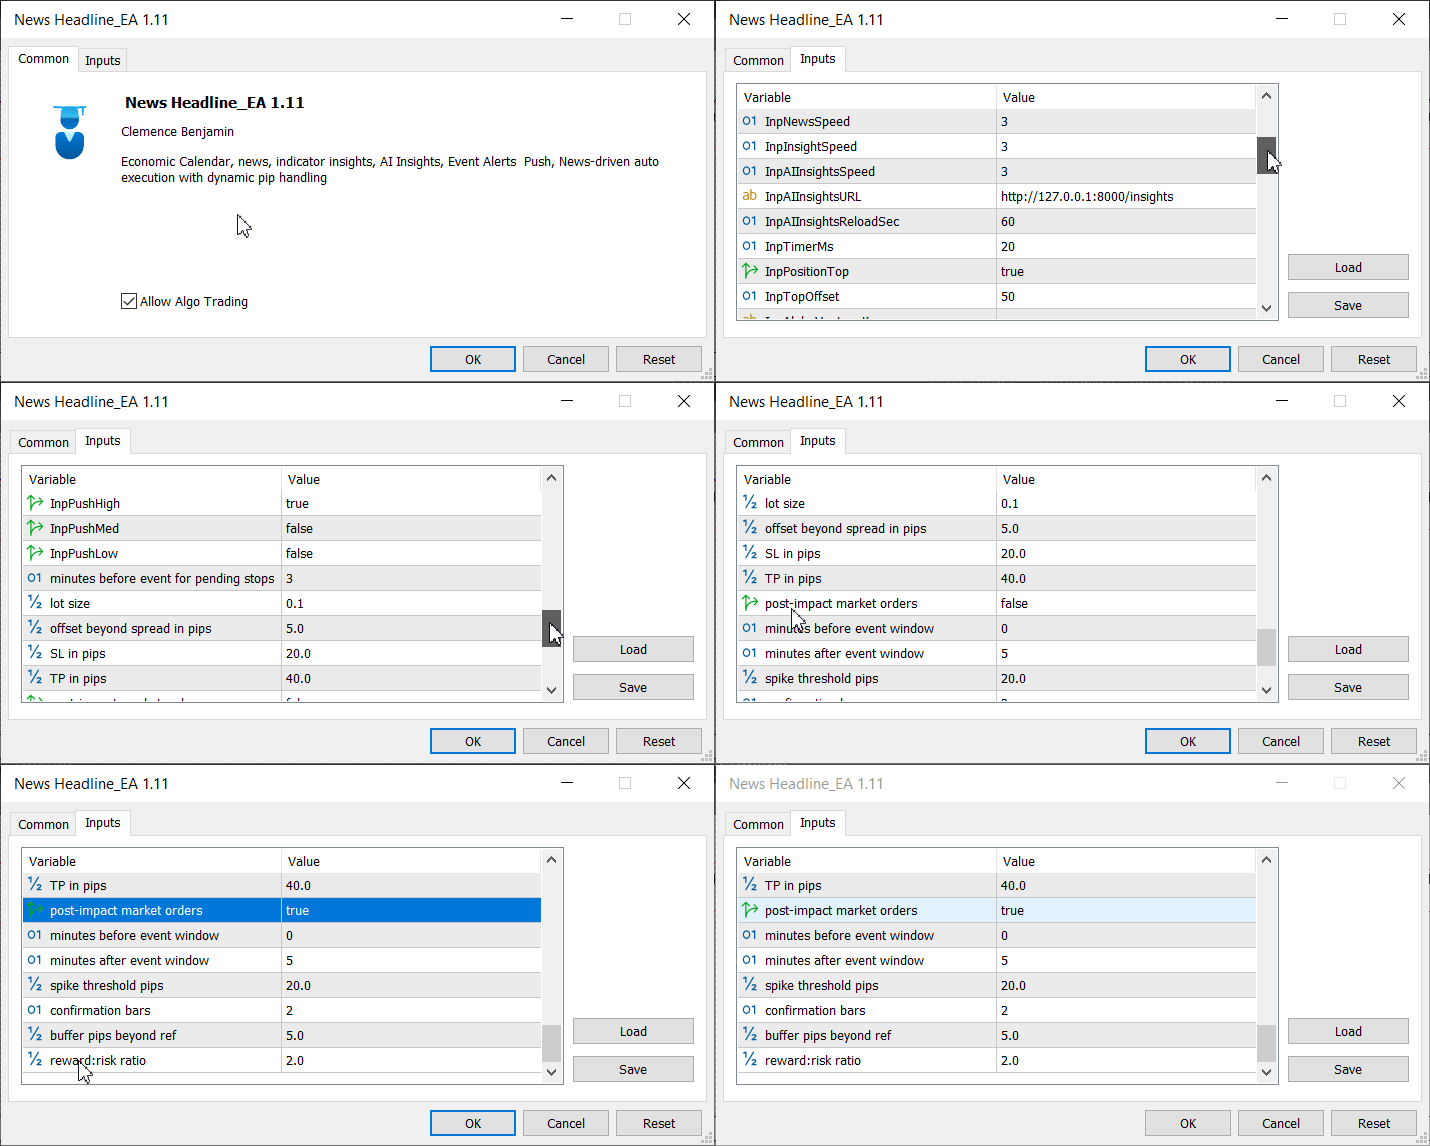
At the very top of the EA, we introduce a dedicated block of input parameters that let the user enable or disable the post‑impact strategy and adjust its behavior. In MQL5, an input defines a compile‑time constant that traders can tweak in the EA’s properties dialog. Here, a Boolean flag turns the feature on or off, while numeric inputs specify the time window around the event (minutes before and after), the minimum spike magnitude in pips, the number of confirmation bars required, the buffer beyond the reference high or low, and the desired reward‑to‑risk ratio. This design makes the strategy highly configurable without changing the code itself.
//--- POST-IMPACT STRATEGY INPUTS -------------------------------------
input bool   InpEnablePostImpact       = false;  // Enable post-impact market orders
input int    InpPostImpactBeforeMin    = 0;      // Minutes before event to start window
input int    InpPostImpactAfterMin     = 5;      // Minutes after event to end window
input double InpSpikeThresholdPipsPI   = 20.0;   // Minimum pip spike magnitude
input int    InpConfirmBarsPI          = 2;      // Number of confirming bars
input double InpBufferPipsPI           = 5.0;    // Buffer beyond reference high/low
input double InpRR_PIP                 = 2.0;    // Desired reward:risk ratio
Step 2: State Variables Global Objects
To manage the feature’s lifecycle, we declare several global variables. Flags like postImpactPlaced and postRectDrawn ensure that we draw our on‑chart highlight and place a market order only once per event. We assign a unique string identifier for the rectangle object so we can create, refer to, and delete it reliably. Additionally, we instantiate a single CTrade object, which provides the EA with built‑in trading methods (Buy(), Sell(), etc.) to execute orders programmatically.
// Trade object & post-impact state
CTrade  trade;
bool    postImpactPlaced = false;          // Ensures only one post-impact trade
string  postRectName     = "PostImpact_Window";  // Unique object name
bool    postRectDrawn    = false;          // Ensures rectangle drawn once
Step 3: Resetting State in ReloadEvents()
Every time the EA refreshes its list of upcoming economic events, it calls ReloadEvents(). At the end of that routine, we reset all post‑impact state flags and delete any existing rectangle object. This “clean‑slate” approach guarantees that each new event is treated independently, avoiding leftover artifacts or duplicate trades from previous events.
// Inside ReloadEvents(), after nextEventTime is computed:
ordersPlaced      = false;
postImpactPlaced  = false;
postRectDrawn     = false;
ObjectDelete(0, postRectName);  // Remove any old rectangle
Step 4: Drawing the Post‑Impact Window
Within the main timer handler (OnTimer()), once the current server time enters the user‑defined window around a high‑impact event, we draw a semi‑transparent rectangle on the chart. We retrieve the chart’s visible high and low prices, then use MQL5’s object‑management functions to create and style an OBJ_RECTANGLE. A Boolean flag ensures this drawing happens only once, making the event visually prominent without redrawing on every tick.
// In OnTimer(), when now ∈ [evt - BeforeMin, evt + AfterMin]
if(!postRectDrawn && now >= winStart && now <= winEnd)
{
   double hi = ChartGetDouble(0, CHART_PRICE_MAX);
   double lo = ChartGetDouble(0, CHART_PRICE_MIN);
   ObjectCreate(0, postRectName, OBJ_RECTANGLE, 0, winStart, hi, winEnd, lo);
   ObjectSetInteger(0, postRectName, OBJPROP_COLOR, clrOrange);
   ObjectSetInteger(0, postRectName, OBJPROP_STYLE, STYLE_DASH);
   ObjectSetInteger(0, postRectName, OBJPROP_BACK,  true);
   ObjectSetInteger(0, postRectName, OBJPROP_FILL,  true);
   postRectDrawn = true;
}
Step 5: Spike Detection Market Order Placement
After the event window closes, the EA locates the exact one‑minute bar at the event timestamp. It calculates the price spike in pips by comparing the bar’s close and open, and checks whether this spike exceeds the user’s threshold. If it does, the EA inspects a configurable number of subsequent bars to confirm the direction (all bullish or all bearish). Upon successful confirmation, it places a market order at the next bar’s open, calculating stop‑loss and take‑profit levels based on the user’s buffer and reward‑to‑risk settings. A final global flag prevents more than one trade per event.
// In OnTimer(), once now > winEnd and !postImpactPlaced
int barIdx = iBarShift(_Symbol, PERIOD_M1, evt, true);
if(barIdx >= 0)
{
   double point = SymbolInfoDouble(_Symbol, SYMBOL_POINT), pip = point*10.0;
   double o = iOpen(_Symbol,PERIOD_M1,barIdx), c = iClose(_Symbol,PERIOD_M1,barIdx);
   double spike = (c - o)/pip;
   if(MathAbs(spike) >= InpSpikeThresholdPipsPI)
   {
      bool bullish = (c > o), ok = true;
      for(int i=1; i<=InpConfirmBarsPI; i++)
      {
         double oi = iOpen(_Symbol,PERIOD_M1,barIdx-i), ci = iClose(_Symbol,PERIOD_M1,barIdx-i);
         if(bullish ? (ci <= oi) : (ci >= oi)) { ok=false; break; }
      }
      if(ok)
      {
         int entryBar = barIdx - InpConfirmBarsPI - 1;
         double entry = iOpen(_Symbol,PERIOD_M1,entryBar);
         double refP  = bullish ? iLow(_Symbol,PERIOD_M1,barIdx-1)
                                : iHigh(_Symbol,PERIOD_M1,barIdx-1);
         double sl   = bullish ? refP - InpBufferPipsPI*pip : refP + InpBufferPipsPI*pip;
         double rr   = MathAbs(entry - sl);
         double tp   = bullish ? entry + rr*InpRR_PIP : entry - rr*InpRR_PIP;
         postImpactPlaced = true;
         trade.SetExpertMagicNumber(888888);
         trade.SetDeviationInPoints(5);
         if(bullish)
            trade.Buy(InpOrderVolume, _Symbol, entry, sl, tp, "PostImpact Buy");
         else
            trade.Sell(InpOrderVolume, _Symbol, entry, sl, tp, "PostImpact Sell");
      }
   }
}
The fully integrated, compact source code—including every feature—is provided at the end of this article, ready for you to compile. Now, we can proceed to the testing section.
Testing
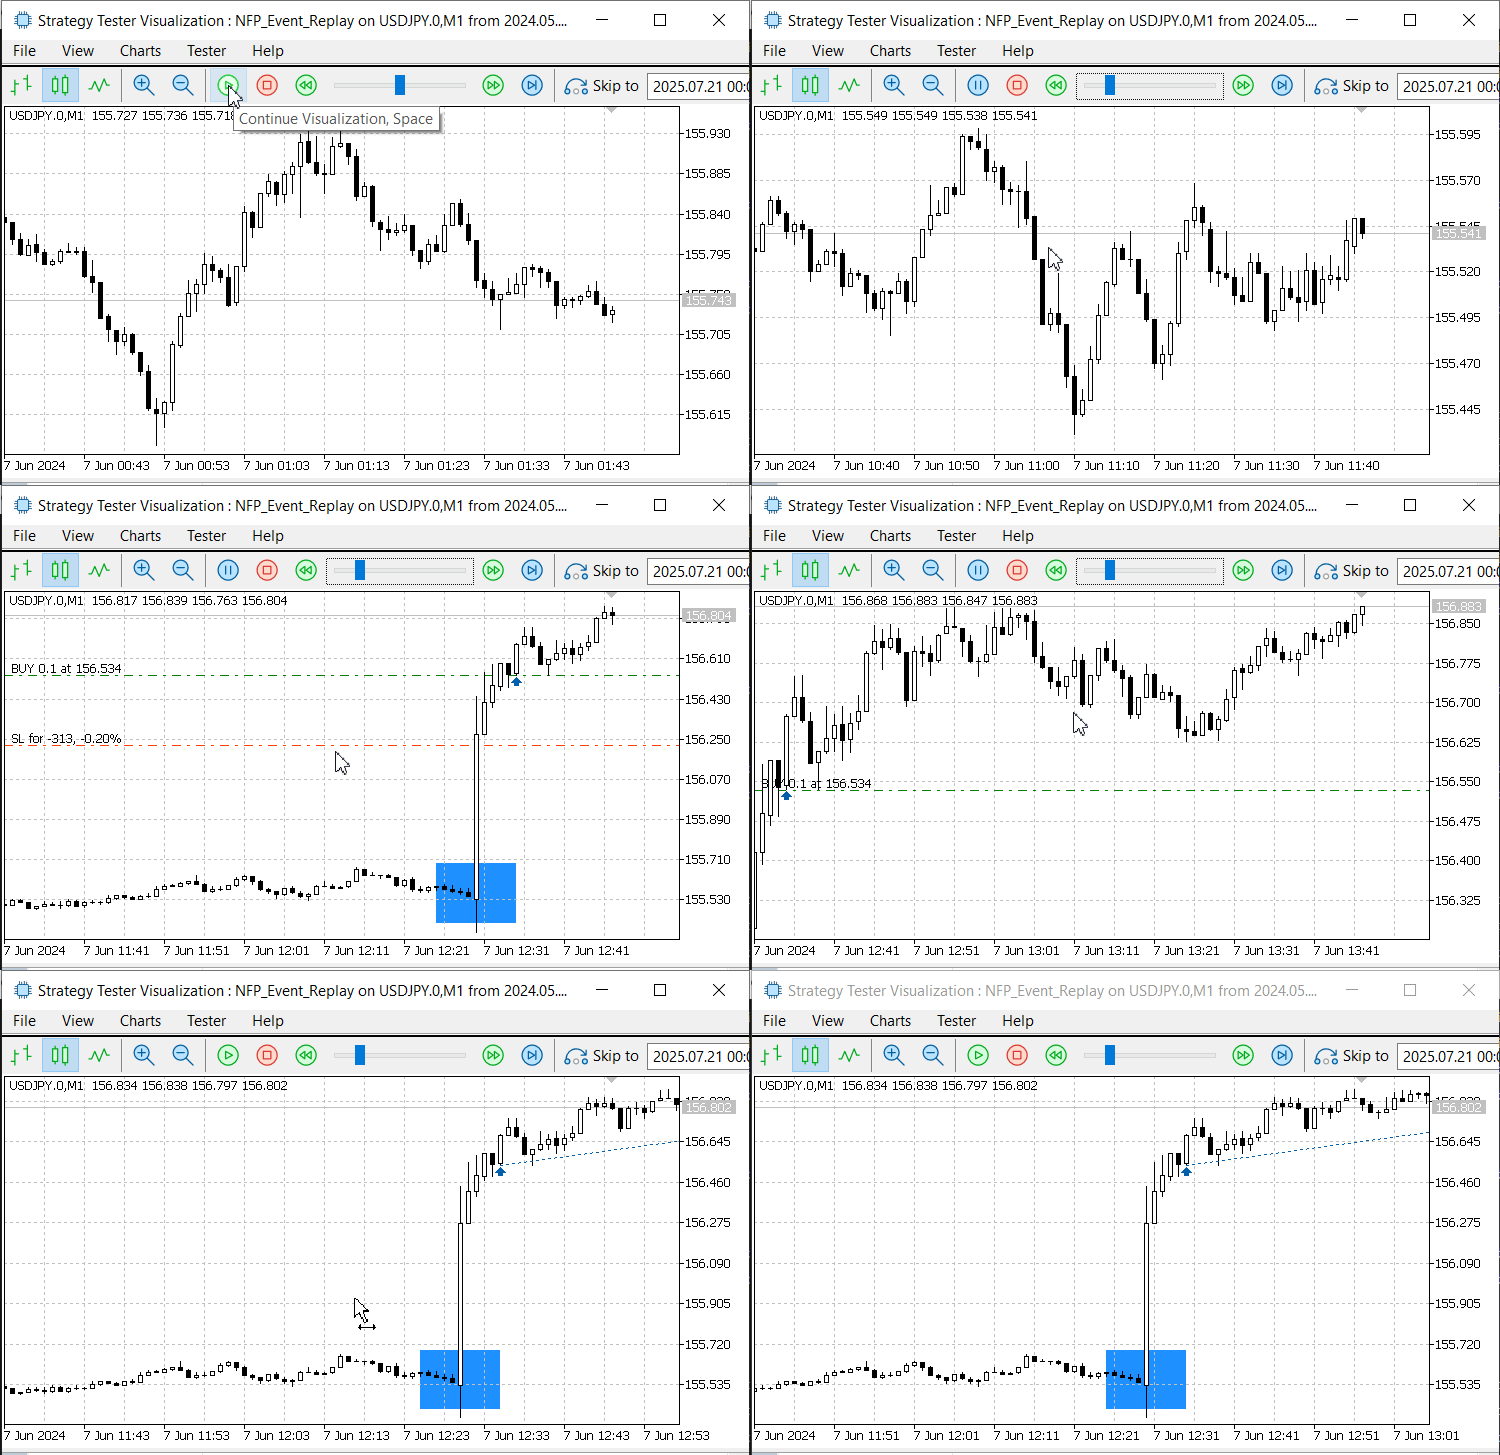
The fully integrated News Headline EA could not be adequately validated in the Strategy Tester because the tester does not support real‑time calendar and news feeds. Replay mode with the combined EA produced no meaningful signals, so I migrated the post‑impact order logic into the dedicated NFP_Event_Replay EA. By using the replay framework—where Non‑Farm Payroll releases are simulated on historical data—I was able to rapidly verify the strategy’s entry, stop‑loss, and take‑profit behavior without waiting for live high‑impact announcements. The animation below, captured from the Strategy Tester, demonstrates that the post‑impact logic performs exactly as intended under controlled, repeatable conditions. Please find attached the second version of NFP_Event_Replay with the complete trading logic included at the end of the article.
Post-impact strategy test result for NFP news release on the first Friday for the month of July 2024
New Headline EA with Post Impact Order Execution
Conclusion
We’ve just wrapped up another in‑depth, educational exploration—this time integrating a post‑impact trading strategy into our News Headline EA and then validating it via the NFP_Event_Replay framework. By trading immediately after high‑importance news releases, we tap into setups with higher probability: the initial volatility spike is over, price has “settled,” and the confirmation bars give us clarity on direction and strength. This approach slots in seamlessly alongside our other news‑driven tactics, making the EA more versatile and robust.
Moreover, the same methods we used here—systematic event detection, pip‑based spike filters, multi‑bar confirmation and reward‑to‑risk management—can be enhanced further with machine learning or AI. Imagine a model that adapts its spike threshold or confirmation rules based on historical success rates for different currencies or news types. There’s ample room to refine every feature we’ve built, whether it’s on‑chart visualization, alerts, or automated order placement. And of course, while our focus was NFP for precision across history and testing speed in the Strategy Tester, the tool remains immediately useful for live NFP trading as well.
I’d love to hear your feedback! Share your experiences, ideas or questions in the comments below. Together we can continue simplifying MQL5 development and build ever more powerful, trader‑friendly algorithmic tools.
Key Lessons
| Lesson | Description |
|---|---|
| 1. Post‑Impact Trading | Trading a moment after High Importance news release is feasible and can improve win‑rate by waiting for initial volatility to subside. |
| 2. Time-Based Event Detection | Using MQL5 date and time functions to programmatically locate specific calendar events like the first Friday of each month (NFP day) and align logic with real-world schedules. |
| 3. Strategy Tester Visualization | Creating visual elements like rectangles and lines to mark historical windows during backtesting, enhancing manual strategy evaluation without relying on external tools. |
| 4. Dynamic Object Drawing | Employing ObjectCreate() and ObjectSetInteger() to render chart objects dynamically based on computed times and values, enabling event tracking and visual feedback. |
| 5. Real-Time vs Tester Mode | Using MQLInfoInteger(MQL_TESTER) to differentiate between Strategy Tester and live execution, allowing customized logic paths for testing and production environments. |
| 6. Trade Management via CTrade | Integrating the CTrade class for secure and structured order placement, stop-loss, take-profit, and order cancellation in both pre-impact and post-impact strategies. |
| 7. Post-Impact Confirmation Logic | Building delayed trade entries based on candlestick confirmations after high-impact spikes — a safer and rule-driven alternative to instant execution. |
| 8. Input Parameter Customization | Using input variables to let users control which strategies are active, how many confirmation candles are required, and what event impact levels should trigger logic. |
| 9. Calendar API Integration | Employing built-in MQL5 calendar functions (CalendarValueHistory, CalendarEventById, etc.) to work with upcoming economic events without external API dependencies. |
| 10. Canvas-Based UI Rendering | Using the CCanvas class to create custom scrolling interfaces for economic news, technical indicators, and AI-driven insights, directly overlayed on the chart. |
| 11. Hybrid Strategy Design | Combining pre-impact pending orders and post-impact reactive trades into a single EA system with runtime conditions, promoting flexibility and adaptability to various market conditions. |
Attachments
| Filename | Version | Description |
|---|---|---|
| NFP_Event_Replay.mq5 | 1.0 | Strategy Tester visual tool that marks NFP event windows using rectangles based on historical first-Friday logic and US daylight saving time. Helps manually analyze price reaction during high-impact news events. |
| News_Headline_EA.mq5 | 1.11 | Real-time economic calendar EA with event scrolling, Alpha Vantage news headlines, AI insights, and dual strategy execution logic for both pending orders and post-impact confirmation trades. Includes NFP replay compatibility during testing. |
| NFP_Event_Replay.mq5 | 1.01 | Second version of the NFP replay EA, now containing the full post‑impact order execution logic. |
Warning: All rights to these materials are reserved by MetaQuotes Ltd. Copying or reprinting of these materials in whole or in part is prohibited.
This article was written by a user of the site and reflects their personal views. MetaQuotes Ltd is not responsible for the accuracy of the information presented, nor for any consequences resulting from the use of the solutions, strategies or recommendations described.
 Implementing Practical Modules from Other Languages in MQL5 (Part 03): Schedule Module from Python, the OnTimer Event on Steroids
 Price Action Analysis Toolkit Development (Part 33): Candle Range Theory Tool
 Building a Trading System (Part 1): A Quantitative Approach
 MQL5 Trading Tools (Part 6): Dynamic Holographic Dashboard with Pulse Animations and Controls
- Free trading apps
- Over 8,000 signals for copying
- Economic news for exploring financial markets
You agree to website policy and terms of use