
Building a Volume Bubble Indicator in MQL5 Using Standard Deviation

Introduction
A volume spike can look impressive, but without context it is just a taller bar. Traders use volume to judge the strength behind price moves, yet a standard histogram does not show whether a surge is truly unusual or simply part of the market's normal rhythm. That makes it harder to spot meaningful shifts in participation and even harder to compare volume over time.
In this article, we solve that problem by building a Volume Bubble Indicator in MQL5. Instead of treating raw volume as a simple sequence of bars, we will compare it with recent market behavior using a lookback window, average volume, and standard deviation. Then we will normalize those values and plot them as bubbles directly on the chart, where bubble size reflects how strong the current activity is relative to the recent baseline. The result is a clearer and more adaptive way to read volume at a glance.
In this article, you will learn how to:
- distinguish tick volume from real volume in MQL5
- access built-in volume arrays inside indicators
- define recent market context with a lookback window
- calculate mean volume, variance, and standard deviation
- normalize volume so it remains comparable as conditions change
- convert normalized values into bubble sizes
- create and manage chart objects for bubble visualization
- configure object color, size, position, and anchoring
- add formatted volume labels to large bubbles
- prevent duplication, update existing objects, and remove outdated elements during cleanup
Project Overview and Implementation Plan
Before writing a single line of code, it’s important to understand the full picture of what we are building and how each piece connects to the next. This chapter breaks the indicator down into clear stages so that by the time we get to the actual implementation, nothing comes as a surprise.
What We Are Building
The Volume Bubble Indicator is a chart overlay that sits directly on your candlestick chart. Instead of a histogram on a separate window, it places a circle, which we can name a bubble, directly above every candle. The size of the bubble tells you how significant that candle's volume is compared to recent activity. The color tells you whether volume is growing or shrinking. And at the most extreme spikes, a formatted label appears showing the precise volume variety in a readable layout.
The finished indicator will behave like this on your chart. Bars with small volume get small bubbles. Bars with slightly elevated volume get medium bubbles. Candles with very high volume get large bubbles, and these large bubbles will be paired with a text label displaying the actual quantity. A green bubble means volume on that candle is higher than the candle before it. Orange means volume is lower than the candle before it. Gray appears on the very first candle of the window where there is nothing to compare against.

Everything on this indicator is built around one question. Is this candle's volume unusual compared to what has been normal recently?
To answer that question objectively, we’ll use standard deviation, which is a statistical measure that tells us how far any single value sits from the average. We will cover the full calculation in detail in a later chapter. For now, just know that the output of that calculation is a single number we will call the normalized volume, and every visual decision the indicator makes flows from that one number. The bigger that number, the bigger the bubble.
Implementation Plan
The indicator is built in six clean stages. Each level has one obligation and passes its result to the next.
Stage 1: Define the Lookback Window
The indicator does not look at every candle on the chart. It only looks at the most recent N candles, where N represents the number of bars you are keen to work with. This window of N candles defines what counts as recent and normal. Everything outside that window is ignored. This stage simply identifies where that window begins on the chart.
Stage 2: Calculate Standard Deviation
After defining the window, we loop through all N candles and perform three sequential calculations. The mean, or average volume across those N candles, comes first. The variance, which gauges how dispersed the numbers are around that average, comes next. The standard deviation, which is obtained from the variance and provides us with a baseline for the typical volume during this window, comes last.
Stage 3: Normalize Each Candle's Volume
We may now score each candle after calculating the standard deviation. To get a normalized value, we divide its raw volume by the standard deviation. This figure indicates how many standard deviations the volume of this candle is above the average. A candle is comparatively silent if its normalized value is less than 1. A candle is extremely active if its normalized value is 4 or higher. Everything that follows is based on this score.
Stage 4: Draw the Bubble
For every candle in the window, we draw a circle above its high point on the chart. The size of that circle is determined directly by the normalized value calculated in the previous stage. Five size levels are defined, each one corresponding to a range of normalized values. The higher the normalized value, the larger the bubble. The color of the bubble is determined by comparing the current candle's volume to the previous candle, giving the trader an instant sense of whether activity is accelerating or cooling down.

Stage 5: Add a Volume Label on Extreme Spikes
When the normalized value reaches four or above, the bubble alone is not enough. A formatted text label is located near the candle, displaying the actual volume number. To keep the chart readable, big numbers are automatically shortened right into a compact layout, so a million, as an instance, appears as 1M, preferring 1000000.

Stage 6: Manage Object Lifecycle
The majority of novices ignore this step, which maintains the chart's cleanliness and the indicator's effectiveness. Here, three things need to be taken care of. To prevent stacking invisible duplicate items on top of one another, the previous version of each bubble must be eliminated before redrawing it on any candle. Second, candles that fall off the left side of the window must have their bubbles removed from the chart when the window moves forward and new candles are formed. Third, all objects created by the indicator must be cleaned up so nothing is left behind after it is completely removed from the chart.
Understanding Volume in MQL5
The level of trading activity in the market over a specific time period is represented by volume. It provides an answer to a straightforward but crucial query: what level of involvement underlies a change in price? Strong interest and active participation from market participants are indicated by high volume. Low volume can indicate consolidation, diminished interest, or poor momentum. As a result, volume is frequently utilized to discover anomalous market behavior, validate trends, and spot possible reversals.
MQL5 provides two forms of volume: tick volume and real volume, and understanding the difference between them is essential.
The number of price updates (ticks) that take place within a bar is measured by tick volume. Every time the price fluctuates, one tick is added. This acts as a stand-in for market activity even though it does not reflect real transacted quantities. Tick volume becomes the main method of estimating activity in decentralized markets like forex, where there is no central exchange to record total traded volume. It's important to note that tick volume frequently has a strong correlation with actual volume, which makes it a useful substitute for analysis. Conversely, real volume shows how many contracts or units were actually exchanged over a certain time period. Only centralized marketplaces with exchange-recorded transactions can offer this kind of volume. Because real volume reflects actual performed trades rather than price fluctuations, it offers a more accurate way to quantify market involvement.
The asset being exchanged determines which volume categories are available. Due to the decentralized nature of the market and the absence of a central reporting mechanism, forex pairings like EURUSD usually only offer tick volume. However, assets like stocks (like Apple shares) and futures (like S&P 500 futures) provide actual volume because they are exchanged on centralized exchanges. Sometimes, especially with certain brokers or exchange-linked instruments, both tick volume and real volume may be accessible, allowing traders to choose the optimal data source for their research.
It's critical to understand these variations because they affect how volume should be perceived. Since tick volume is the most widely available in many trading environments and adequate for creating a trustworthy volume-based indicator, it will be the main focus of this article.
Built-in Volume Indicator in MetaTrader 5
MetaTrader 5 provides a built-in volume indicator that allows you to visualize trading activity for each bar on the current timeframe. It is displayed as a histogram below the main chart, where each bar represents the volume recorded during that period. This gives a quick overview of how active the market has been, making volume one of the first tools traders use to understand participation.

The indicator includes several customizable parameters that control how volume is displayed. One of the key settings is Value Up and Value Down, which determine the colors of the histogram bars. Unlike price, where a bullish candle (close price greater than open price) and a bearish candle (close price less than open price) define direction, volume is compared relative to the previous bar.
- Value Up is used when the current bar’s volume is greater than the previous bar’s volume.
- Value Down is used when the current bar’s volume is lower than the previous bar’s volume.
This means the color reflects changes in activity rather than price direction. A bearish candle can still appear as “Value Up” if it has higher volume than the previous bar, emphasizing participation instead of direction.
Another important parameter allows you to choose between tick volume and real volume. Tick volume counts price updates, while real volume reflects actual traded quantity. The availability of these depends on the asset and broker, and selecting an unsupported type will result in an empty indicator window.
While this built-in indicator is useful, it still presents raw volume values. This makes it difficult to quickly determine whether current activity is relatively high or low compared to recent market behavior. Traders are left to visually estimate significance without a clear reference. This limitation is precisely what motivates the approach in this article, where we transform volume into a normalized measure and represent it using bubbles with varying size and color, making changes in activity easier to interpret at a glance.
Creating Volume Bubbles
In this chapter, we are going to build the Volume Bubble Indicator step by step, but in a very practical way. First, think about this: when you look at raw volume, can you easily tell if a value is “high” or “low”? Not really. So the first thing we will do is create a reference point. We will calculate the average (mean) volume over recent bars so we know what “normal” looks like. Then we will go a step further and measure how much volume usually moves away from that average using standard deviation. This helps us answer a better question: is the current volume just normal, or is it unusually high?
Once we understand that, we will use it to build something visual. We will take the current volume and compare it to that standard deviation to get a normalized value. Then we will use this value to control the size of bubbles, so higher activity creates bigger bubbles.
Calculating the Mean Volume
The mean, also known as the average, represents the typical value of a dataset over a given period. In simple terms, it answers the question, “What is the normal level of volume if we look at recent bars?” To calculate it, we sum the volume of a fixed number of bars (our lookback period) and divide by that number. This gives us a single value that represents the central tendency of volume within that window.
In this scenario, the mean is useful because it provides a baseline for comparison. Raw volume values on their own do not tell us much, since volume naturally fluctuates from bar to bar. By calculating the mean, we establish what “normal” volume looks like under current market conditions. This enables us to assess whether the current bar's volume is relatively high or low by comparing it to the average. It would be challenging to assess the significance of a volume spike or decline without the mean, but having it gives us a benchmark that improves the consistency and meaning of volume analysis.
Example:
#property indicator_chart_window
#property indicator_plots 0

//--- Look-back window: number of bars used to compute mean and stddev of volume
input int N = 30;   // Look Back Bars
//+------------------------------------------------------------------+
//| Custom indicator initialization function                         |
//+------------------------------------------------------------------+
int OnInit()
  {
//--- indicator buffers mapping

//---
   return(INIT_SUCCEEDED);
  }
//+------------------------------------------------------------------+
//| Custom indicator iteration function                              |
//+------------------------------------------------------------------+
int OnCalculate(const int32_t rates_total,
                const int32_t prev_calculated,
                const datetime &time[],
                const double &open[],
                const double &high[],
                const double &low[],
                const double &close[],
                const long &tick_volume[],
                const long &volume[],
                const int32_t &spread[])
  {
//---

//--- Need at least N bars to calculate meaningful statistics
   if(rates_total < N)
      return 0;


//--- return value of prev_calculated for next call
   return(rates_total);
  }
Explanation:
Using chart objects rather than conventional plots or buffers, this code defines a custom indicator that operates directly on MetaTrader 5's main chart. It allows the user to balance responsiveness and smoothness by introducing a user-defined lookback period N that determines how many bars are used for computations. Every time fresh market data is received, the primary calculating function is activated. It analyzes market conditions by processing arrays including price, volume, and spread. The function initially assesses whether there are sufficient bars available based on the lookback period to prevent errors caused by insufficient data. If the condition is met, it proceeds and gives the total number of processed bars to enable efficient updates.
Now that the structure of the indicator is in place and we have ensured that enough data is available for our calculations, we can proceed to compute the mean.
Example:
double sum;
double mean;
int window_start;
//+------------------------------------------------------------------+
//| Custom indicator iteration function                              |
//+------------------------------------------------------------------+
int OnCalculate(const int32_t rates_total,
                const int32_t prev_calculated,
                const datetime &time[],
                const double &open[],
                const double &high[],
                const double &low[],
                const double &close[],
                const long &tick_volume[],
                const long &volume[],
                const int32_t &spread[])
  {
//---

//--- Need at least N bars to calculate meaningful statistics
   if(rates_total < N)
      return 0;

//--- The window covers the most recent N bars
   window_start = rates_total - N;

//--- Compute the mean tick volume over the window
   sum = 0.0;
   for(int i = window_start; i < rates_total; i++)
      sum += (double)tick_volume[i];
   mean = sum / N;

//--- return value of prev_calculated for next call
   return(rates_total);
  }
Explanation:
We compute the average volume across a chosen number of recent bars to set a baseline for typical market activity. Initializing a variable named sum to 0.0 is the first step. This variable adds up the total volume as we go through each bar in the specified range.
We then employ a loop to iterate through every bar in our lookback window, beginning at window_start and concluding at rates_total. The most recent N bars that we are interested in are defined by these two variables. We use tick_volume[i] to retrieve the current bar's tick volume for each loop iteration. Tick volume is specifically changed to a double before being added to the total because it is kept as an integer type. This guarantees the computation's accuracy, particularly when we subsequently divide the total to determine the average. The volume of each bar is added to the sum while the loop goes on, progressively increasing the total volume across all N bars. When the loop is finished, sum has the total volume of the entire window.
Lastly, we divide this entire sum by N, which stands for the number of bars used in the computation, to get the mean. This step gives us a single figure that represents the average volume for the chosen period by evenly distributing the total volume over the number of bars. This mean is crucial because it creates a benchmark that enables us to assess whether the present volume is usual or substantially deviates from past market trends.
Calculating Variance and Standard Deviation
After computing the mean, the next step is to understand how volume behaves around that average. This is where variance and standard deviation come in. While the mean tells us what “normal” volume looks like, it does not tell us how much volume typically changes from one bar to another. Variance solves this by measuring how far each volume value deviates from the mean. It does this by taking the difference between each value and the mean, squaring it, and then averaging those squared differences. The result is a measure of how spread out the volume data is.
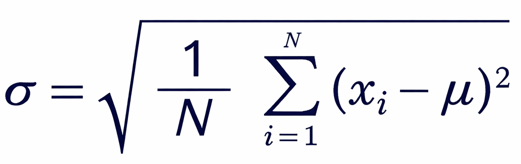
The standard deviation, which is just the variance's square root, is directly correlated with variance. This step makes the value easier to read by returning it to the same unit as the original data. To put it simply, standard deviation provides a more useful and significant explanation of the data's dispersion than variance does in squared terms.
This link is crucial in respect to this indicator. The standard deviation indicates how much volume generally varies around the baseline that the mean provides. This enables us to ascertain whether the present volume is considerably higher than typical or average. We wouldn't be able to determine the significance of a variation from the mean without variance and standard deviation. This is precisely what we require to build the Volume Bubble Indicator. We can normalize volume values and determine when activity is abnormally high by utilizing standard deviation. Later on, the size of the bubbles will be controlled by these variations, with larger bubbles signifying higher market activity and smaller ones signifying slower times.
Example:double variance; double diff; double stddev;
//+------------------------------------------------------------------+
//| Custom indicator iteration function                              |
//+------------------------------------------------------------------+
int OnCalculate(const int32_t rates_total,
                const int32_t prev_calculated,
                const datetime &time[],
                const double &open[],
                const double &high[],
                const double &low[],
                const double &close[],
                const long &tick_volume[],
                const long &volume[],
                const int32_t &spread[])
  {

//--- Need at least N bars to calculate meaningful statistics
   if(rates_total < N)
      return 0;

//--- The window covers the most recent N bars
   window_start = rates_total - N;

//--- Compute the mean tick volume over the window
   sum = 0.0;
   for(int i = window_start; i < rates_total; i++)
      sum += (double)tick_volume[i];
   mean = sum / N;

//--- Compute variance then standard deviation
   variance = 0.0;
   for(int i = window_start; i < rates_total; i++)
     {
      diff      = (double)tick_volume[i] - mean;
      variance += diff * diff;
     }
   variance /= N;
   stddev = MathSqrt(variance);

//--- Guard: if all volumes are identical stddev is zero; nothing useful to show
   if(stddev == 0.0)
      return rates_total;

//--- return value of prev_calculated for next call
   return(rates_total);
  }
Explanation:
The variance variable is initialized to 0 in the first line. This is crucial because you need a starting point before adding anything because variance is computed as an accumulation of values. At this point, the variable is merely serving as a container to store the sum of all the squared differences calculated during the loop. The loop then starts and iterates through every bar in the specified window. The code accesses the current bar's volume and compares it to the previously determined mean for each iteration. In this stage, the distance between each individual volume measurement and the average volume is measured. To ensure that all values within the lookback period are considered, each bar adds one data point to the total computation.
The loop computes and stores in a temporary variable the difference between the current volume and the mean. This difference shows how the volume of that particular bar deviates from the typical pattern. A slight variation implies that the volume is almost normal, whereas a greater variation suggests extraordinary activity in comparison to recent history. The code calculates the difference, squares it, and then adds the result to the running total that is kept in the variance variable. Regardless of whether a deviation is above or below the mean, squaring guarantees that every variation makes a positive contribution. Larger variances are also given greater weight, which is helpful when looking for notable shifts in market activity. All of these squared deviations add up to a single total as the loop proceeds. The number is divided by the number of bars in the window when the loop is finished. In this stage, the total is transformed into an average measure of the deviation of the values from the mean.
After that, the variance now represents the general distribution of volume values throughout the chosen time frame. The standard deviation is then calculated by taking the variance's square root. This is done because squared units, which are not immediately intuitive, are used to express the variance. The standard deviation makes the result easier to understand and utilize for additional computations like normalization by returning it to the same scale as the original volume data.
Lastly, if the standard deviation is zero, the code verifies. This condition arises when there is no variation at all and all the window's volume values are the same. Using the standard deviation in a division operation later on would result in an error in this situation. To prevent division by zero and preserve stability, the check makes sure the program safely ends the current calculation cycle.
Normalizing Volume and Mapping to Bubble Size
Because raw volume values by themselves are not always useful when compared across various market conditions, normalizing volume is a crucial step. Depending on the asset, time period, and general market activity, volume might change dramatically. A volume value that is deemed high in one period, for instance, can be entirely typical in another. We convert raw numbers into a relative scale that shows the significance of the current volume in relation to recent behavior by normalizing volume using standard deviation. This enables us to determine, within a consistent framework, whether the current activity is abnormally low, average, or high.
The creation of a uniform method for comparing volume values within the same lookback window is another important benefit of normalizing. The normalized value expresses volume in terms of variation from the mean rather than dealing with erratic raw figures. This facilitates the application of logical thresholds for volume strength classification. By guaranteeing that the indicator responds dynamically to shifting market conditions rather than depending on predetermined assumptions, normalization serves as a link between statistical analysis and visual interpretation in this situation.
Mapping normalized volume to bubble size is what turns numerical data into a visual representation that is easy to interpret at a glance. The idea is to assign larger bubble sizes to higher normalized volume values and smaller bubbles to lower ones. This visual scaling helps traders quickly identify periods of increased participation without needing to analyze exact numbers. Each bubble size range corresponds to a level of volume intensity, allowing the chart to communicate information intuitively.
Example:
long   v;
double n_vol;
int bubble_size;
//+------------------------------------------------------------------+
//| Custom indicator iteration function                              |
//+------------------------------------------------------------------+
int OnCalculate(const int32_t rates_total,
                const int32_t prev_calculated,
                const datetime &time[],
                const double &open[],
                const double &high[],
                const double &low[],
                const double &close[],
                const long &tick_volume[],
                const long &volume[],
                const int32_t &spread[])
  {
//---

//--- Need at least N bars to calculate meaningful statistics
   if(rates_total < N)
      return 0;

//--- The window covers the most recent N bars
   window_start = rates_total - N;

//--- Compute the mean tick volume over the window
   sum = 0.0;
   for(int i = window_start; i < rates_total; i++)
      sum += (double)tick_volume[i];
   mean = sum / N;

//--- Compute variance then standard deviation
   variance = 0.0;
   for(int i = window_start; i < rates_total; i++)
     {
      diff      = (double)tick_volume[i] - mean;
      variance += diff * diff;
     }
   variance /= N;
   stddev = MathSqrt(variance);

//--- Guard: if all volumes are identical stddev is zero; nothing useful to show
   if(stddev == 0.0)
      return rates_total;

//Draw or update a bubble (and optional label) for every bar in the window
   for(int i = window_start; i < rates_total; i++)
     {
      v     = tick_volume[i];
      n_vol = (double)v / stddev; // normalised volume: how many stddevs above the mean

      //--- Map normalised volume to a bubble font size
      if(n_vol < 1)
         bubble_size = 24;
      else
         if(n_vol < 2)
            bubble_size = 32;
         else
            if(n_vol < 3)
               bubble_size = 40;
            else
               if(n_vol < 4)
                  bubble_size = 48;
               else
                 {
                  bubble_size = 56;
                 }
       }

//--- return value of prev_calculated for next call
   return(rates_total);
  }
Explanation:
By giving each bar a bubble size based on its normalized volume, this piece of the algorithm transforms computed data into a visual manner. To compare it to recent activity, it cycles through the chosen lookback window, obtains the tick volume of each bar, and normalizes it by dividing by the standard deviation. Conditional checks are then used to categorize the resultant value into ranges, each of which represents a distinct degree of market activity. Larger bubbles show gradually increased volume in relation to the usual, whereas smaller bubbles indicate low activity. The largest bubbles highlight exceptional situations. All things considered, this method converts raw volume data into a clear visual scale that makes it simple to see different market participation levels right on the chart.
Displaying Volume Bubbles on the Chart
The next step is to show these bubbles directly on the chart after calculating each bubble's size using normalized volume. We employ chart objects to produce a visual depiction of volume activity because this indicator does not use regular plots or buffers. Every bubble is depicted as a text object that is placed at a certain location on the chart, usually around each candle's high to ensure that it is still easily visible.
A distinct name is created for the bubble object for each bar in the chosen window. This guarantees that every bubble is associated with a certain candle and can be changed or eliminated without impacting other bubbles. The code determines whether an object with the same name already exists before constructing a new one. If so, it is removed to avoid duplication. Maintaining a clear and accurate presentation when fresh data is received requires this step.
Example:
string name;
color bubble_color;
//+------------------------------------------------------------------+
//| stable bubble object name based on candle timestamp              |
//+------------------------------------------------------------------+
string BubbleName(datetime t)
  {

   return StringFormat("Bubble%d", (int)t);

  }
//Draw or update a bubble (and optional label) for every bar in the window
   for(int i = window_start; i < rates_total; i++)
     {
      v     = tick_volume[i];
      n_vol = (double)v / stddev; // normalised volume: how many stddevs above the mean

      //--- Map normalised volume to a bubble font size
      if(n_vol < 1)
         bubble_size = 24;
      else
         if(n_vol < 2)
            bubble_size = 32;
         else
            if(n_vol < 3)
               bubble_size = 40;
            else
               if(n_vol < 4)
                  bubble_size = 48;
               else
                 {
                  bubble_size = 56;

                 }

      //--- Determine bubble colour: green if volume rose, orange if fell, gray for first bar
      if(i > window_start)
         bubble_color = (tick_volume[i] > tick_volume[i - 1]) ? clrLime : clrOrange;
      else
         bubble_color = clrGray;

      //--- Draw the bubble dot — create only if missing, otherwise just update properties
      name = BubbleName(time[i]);

      if(ObjectFind(0, name) < 0)
         ObjectCreate(0, name, OBJ_TEXT, 0, time[i], high[i]);

      ObjectSetString(0,  name, OBJPROP_TEXT,       "●");
      ObjectSetInteger(0, name, OBJPROP_COLOR,      bubble_color);
      ObjectSetInteger(0, name, OBJPROP_FONTSIZE,   bubble_size);
      ObjectSetInteger(0, name, OBJPROP_BACK,       true);
      ObjectSetInteger(0, name, OBJPROP_ANCHOR,     ANCHOR_CENTER);
      ObjectSetInteger(0, name, OBJPROP_SELECTABLE, false);
      ObjectSetInteger(0, name, OBJPROP_HIDDEN,     true);
      ObjectMove(0,       name, 0, time[i], high[i]);
     }
Output:

Explanation:
To prevent conflicts and guarantee accurate tracking, this section describes how each bubble is formed, maintained, and shown on the chart using distinct time-based names. Rather than deleting and recreating objects on every update, the code first checks whether a bubble with that name already exists. It creates one only if none is found; otherwise, it simply updates the properties of the existing object. The bubble is then positioned above the matching candle and styled with a circular character. The color is chosen by comparing current and previous volumes. Green indicates growing activity, orange indicates declining activity, and gray is assigned to the first bar in the window where no prior bar exists for comparison. While other properties guarantee correct alignment and visibility, its size represents normalized volume.
Previous bubbles that fall outside the lookback window are not instantly eliminated, which might result in clutter. To address this, a cleanup procedure is implemented that uses the same naming logic to identify and remove outdated elements, guaranteeing that the chart stays precise, tidy, and concentrated on recent data.
Example:
string bubble_old_name;
int old_index;
//--- Remove objects that have scrolled out of the look-back window
static int last_window_start = -1;
if(window_start != last_window_start)
  {
   last_window_start = window_start;

   old_index = window_start - 1;

   if(old_index >= 0)
     {
      bubble_old_name = BubbleName(time[old_index]);

      if(ObjectFind(0, bubble_old_name) >= 0)
        {
         ObjectDelete(0, bubble_old_name);

        }
     }
  }
Explanation:
Cleaning up outdated bubble objects that are no longer inside the active lookback window is the responsibility of this code block. To maintain the chart's accuracy and cleanliness, the appropriate bubbles must be eliminated as new bars are added and older bars shift outside the range indicated by N. The loop starts from prev_calculated - N and runs up to window_start. This range represents bars that were previously processed but have now fallen outside the current window. In other words, these are the “expired” bars whose bubbles should no longer be displayed.
A safety check is included inside the loop to make sure the index doesn't go below zero. This is crucial because prev_calculated might be tiny during the indicator's early runs, and deducting N could provide a negative starting point. The condition skips such invalid indices to prevent runtime errors. For each valid bar in this range, the code generates the name of the bubble object using the same naming function based on the candle’s timestamp. This ensures consistency, meaning the program can correctly identify the exact object that was previously created for that bar.
Next, the algorithm determines if there is an object on the chart with the given name. The item is removed if it does. This stage guarantees the removal of out-of-date bubbles that are no longer within the computation window. Because of this, every update keeps the visualization clear, effective, and consistent with the specified lookback period by both creating and adjusting bubbles for recent data and eliminating ones that aren't needed.
Adding Volume Labels to Large Bubbles
To further enhance the readability of the indicator, we can display the actual volume values on bubbles that represent high activity. Since large bubbles already indicate significant volume, adding a text label helps provide precise information without overcrowding the chart. Usually, a text label is attached next to the largest bubble size category after it has been identified. Volume figures can be reduced using forms like "K" for thousands or "M" for millions to make them easier to read. Users can rapidly determine the location and intensity of strong activity thanks to this combination of size and labeled numbers.
Example:
string tex_name;
string old_name;

//+------------------------------------------------------------------+
//| Returns a stable label object name based on candle timestamp     |
//+------------------------------------------------------------------+
string MakeName(datetime t)
  {
   return StringFormat("VolLabel_%d", (int)t);
  }

//+------------------------------------------------------------------+
//| Formats a volume number into a compact readable string           |
//| e.g. 1500 -> "1K",  3000000 -> "3M",  2000000000 -> "2B"         |
//+------------------------------------------------------------------+
string FormatVolume(long vol)
  {
   int digits = StringLen(IntegerToString((int)vol));

   if(digits <= 3)
      return IntegerToString((int)vol);                            // hundreds: 123
   else
      if(digits <= 6)
         return IntegerToString((int)(vol / 1000)) + "K";          // thousands: 45K
      else
         if(digits <= 9)
            return IntegerToString((int)(vol / 1000000)) + "M";    // millions: 12M
         else
            return IntegerToString((int)(vol / 1000000000)) + "B"; // billions: 3B
  }
//+------------------------------------------------------------------+
//| Expert deinitialization function                                 |
//+------------------------------------------------------------------+
void OnDeinit(const int reason)
  {
   ObjectsDeleteAll(0, "VolLabel_");
   ObjectsDeleteAll(0, "Bubble");
   ChartRedraw(0);
  }
//--- Draw or update a bubble (and optional label) for every bar in the window
bool need_redraw = false;
for(int i = window_start; i < rates_total; i++)
  {
   v     = tick_volume[i];
   n_vol = (double)v / stddev; // normalised volume: how many stddevs above the mean

//--- Map normalised volume to a bubble font size
   if(n_vol < 1)
      bubble_size = 24;
   else
      if(n_vol < 2)
         bubble_size = 32;
      else
         if(n_vol < 3)
            bubble_size = 40;
         else
            if(n_vol < 4)
               bubble_size = 48;
            else
              {
               bubble_size = 56;

               //--- Exceptional volume (>= 4 stddevs): also show a formatted volume label
               tex_name = MakeName(time[i]);

               //--- Create the label only if it does not already exist; otherwise just update it
               if(ObjectFind(0, tex_name) < 0)
                 {
                  ObjectCreate(0, tex_name, OBJ_TEXT, 0, time[i], high[i]);
                  need_redraw = true;
                 }
               ObjectSetString(0,  tex_name, OBJPROP_TEXT,       FormatVolume(v));
               ObjectSetInteger(0, tex_name, OBJPROP_ANCHOR,     ANCHOR_CENTER);
               ObjectSetInteger(0, tex_name, OBJPROP_COLOR,      clrDodgerBlue);
               ObjectSetInteger(0, tex_name, OBJPROP_FONTSIZE,   10);
               ObjectSetString(0,  tex_name, OBJPROP_FONT,       "Arial Bold");
               ObjectSetInteger(0, tex_name, OBJPROP_SELECTABLE, false);
               ObjectSetInteger(0, tex_name, OBJPROP_HIDDEN,     true);

               if(ObjectMove(0, tex_name, 0, time[i], high[i]))
                  need_redraw = true;
              }

//--- Determine bubble colour: green if volume rose, orange if fell, gray for first bar
   if(i > window_start)
      bubble_color = (tick_volume[i] > tick_volume[i - 1]) ? clrLime : clrOrange;
   else
      bubble_color = clrGray;

//--- Draw the bubble dot — create only if missing, otherwise just update properties
   name = BubbleName(time[i]);

   if(ObjectFind(0, name) < 0)
     {
      ObjectCreate(0, name, OBJ_TEXT, 0, time[i], high[i]);
      need_redraw = true;
     }

   ObjectSetString(0,  name, OBJPROP_TEXT,       "●");
   ObjectSetInteger(0, name, OBJPROP_COLOR,      bubble_color);
   ObjectSetInteger(0, name, OBJPROP_FONTSIZE,   bubble_size);
   ObjectSetInteger(0, name, OBJPROP_BACK,       true);
   ObjectSetInteger(0, name, OBJPROP_ANCHOR,     ANCHOR_CENTER);
   ObjectSetInteger(0, name, OBJPROP_SELECTABLE, false);
   ObjectSetInteger(0, name, OBJPROP_HIDDEN,     true);
   if(ObjectMove(0, name, 0, time[i], high[i]))
      need_redraw = true;
  }

//--- Remove objects that have scrolled out of the look-back window
static int last_window_start = -1;
if(window_start != last_window_start)
  {
   last_window_start = window_start;

   old_index = window_start - 1;

   if(old_index >= 0)
     {
      bubble_old_name = BubbleName(time[old_index]);

      if(ObjectFind(0, bubble_old_name) >= 0)
        {
         ObjectDelete(0, bubble_old_name);
         need_redraw = true;
        }

      old_name = MakeName(time[old_index]);

      if(ObjectFind(0, old_name) >= 0)
        {
         ObjectDelete(0, old_name);
         need_redraw = true;
        }
     }
  }

//--- Redraw ONLY when needed
if(need_redraw)
   ChartRedraw(0);
Output:

Explanation:
The distinct names of each text label that will show the volume value on the chart are stored in the variable tex_name. Similar to the bubbles, each label needs to be uniquely identified to be effectively managed. This is accomplished by defining a function that uses the timestamp of the candle to produce a stable name. Each label is uniquely associated with a particular bar by transforming the time into a string and appending a prefix. This avoids naming conflicts when numerous objects are generated and guarantees that each label precisely matches the candle it represents.
Raw volume values must be transformed into a more understandable format by another assistance function. It condenses large numbers into forms like thousands, millions, or billions rather than showing them in their entirety. Chart clarity is enhanced by this. A value such as 1,200,000 can be represented as 1M without losing its meaning because the function scales the integer based on its size evaluation.
In the section where the largest bubble size is assigned, the code adds an extra feature by displaying the volume value as text. This only happens for the highest volume category, which helps avoid overcrowding the chart. First, the timestamp is used to create a unique label name. The code then checks whether a label with the identical name already exists. If it does, the properties of the existing object are updated directly rather than deleting and recreating it. If none is found, a new text object is created at the candle's location. To make the label readable and visually consistent with the remainder of the indication, additional characteristics like alignment, color, font size, and font style are added.
Older bars must have their bubbles and labels deleted when new ones are introduced since they have passed the lookback window. The cleanup loop takes care of this. Using the defined naming logic, the code creates the names of the matching bubble and label, verifies that they are present on the chart, and removes them if needed. This keeps the chart clear and concentrated on recent data by ensuring that only elements within the active window are visible.
A flag named need_redraw is added to regulate when the chart should be refreshed to increase speed. The flag is only set to true when a graphical object is created, updated, moved, or deleted, as opposed to requiring a redraw on each tick. The chart is only redrawn after the computation if this flag is raised. This method guarantees that the chart is updated only when a noticeable change actually takes place, minimizes needless redraw processes, and increases efficiency.
Finally, when the indicator is removed from the chart, the deinitialization function ensures that all objects are deleted. Instead of removing each item separately, it eliminates all objects that share the prefixes used for labels and bubbles. This guarantees that the chart will be empty when the indicator is no longer in use. The cleanup is then promptly reflected in a new drawing of the chart. This step is crucial for keeping the workspace tidy and guaranteeing that the artifacts of the indication are removed.
Conclusion
We have built a complete workflow for transforming raw volume data into a meaningful and adaptive visual representation using a Volume Bubble Indicator in MQL5. In this article, you learned:
- The role of volume in MQL5 and the distinction between tick volume and real volume, including when each type is available depending on the market or asset.
- Accessing volume data through built-in arrays and integrating it into indicator logic for further computation and visualization.
- Establishing a baseline by computing the mean over a defined lookback window to understand what represents normal market activity.
- Measuring deviation from that baseline using variance and standard deviation to capture the spread of volume behavior over time.
- Normalizing volume values using standard deviation so that comparisons remain meaningful even as market conditions change.
- Converting normalized values into bubble sizes, allowing different levels of activity to be represented visually on the chart in an intuitive way.
- Leveraging chart objects in MQL5 to render bubbles, with control over their position, size, color, and overall appearance.
- Enhancing clarity by adding formatted volume labels to the most significant bubbles, making it easier to interpret actual volume magnitudes.
- Maintaining a clean and efficient chart by properly updating existing objects, removing outdated bubbles and labels, and handling full cleanup during de-initialization.
When these components are combined, volume is regarded as a contextual indicator of market participation rather than as mere numerical data. Compared to MetaTrader 5's default histogram, this method is easier to read, more effectively emphasizes significant activity, and offers a strong basis for developing into more sophisticated volume-based analysis, signals, and automated methods.
Warning: All rights to these materials are reserved by MetaQuotes Ltd. Copying or reprinting of these materials in whole or in part is prohibited.
This article was written by a user of the site and reflects their personal views. MetaQuotes Ltd is not responsible for the accuracy of the information presented, nor for any consequences resulting from the use of the solutions, strategies or recommendations described.

- Free trading apps
- Over 8,000 signals for copying
- Economic news for exploring financial markets
You agree to website policy and terms of use