

Implementing Anchored VWAP Indicator in MQL5: A Step-by-Step Guide
 1 465
1 465
 1
1

Introduction
The Anchored VWAP is a technical indicator that calculates the volume-weighted price of an asset starting from a user-defined anchor point. It helps traders gauge trend strength, pinpoint entries and exits, analyze market-moving events, investigate swing highs/lows, and measure price extension using standard deviation bands. Unlike regular moving averages that forget beyond a fixed window length, the Anchored VWAP has real memory as it accumulates price and volume data from the anchor point forward.
This allows traders to study price evolution over intraday, swing, and long-term timeframes based on actual transactions. By varying the anchor line around swing highs/lows, breakout points, and consolidations, traders can investigate the changes in the weighted price that led to the formation of those structures. Advanced traders can also use multiple anchors to define channels of high-volume activity.
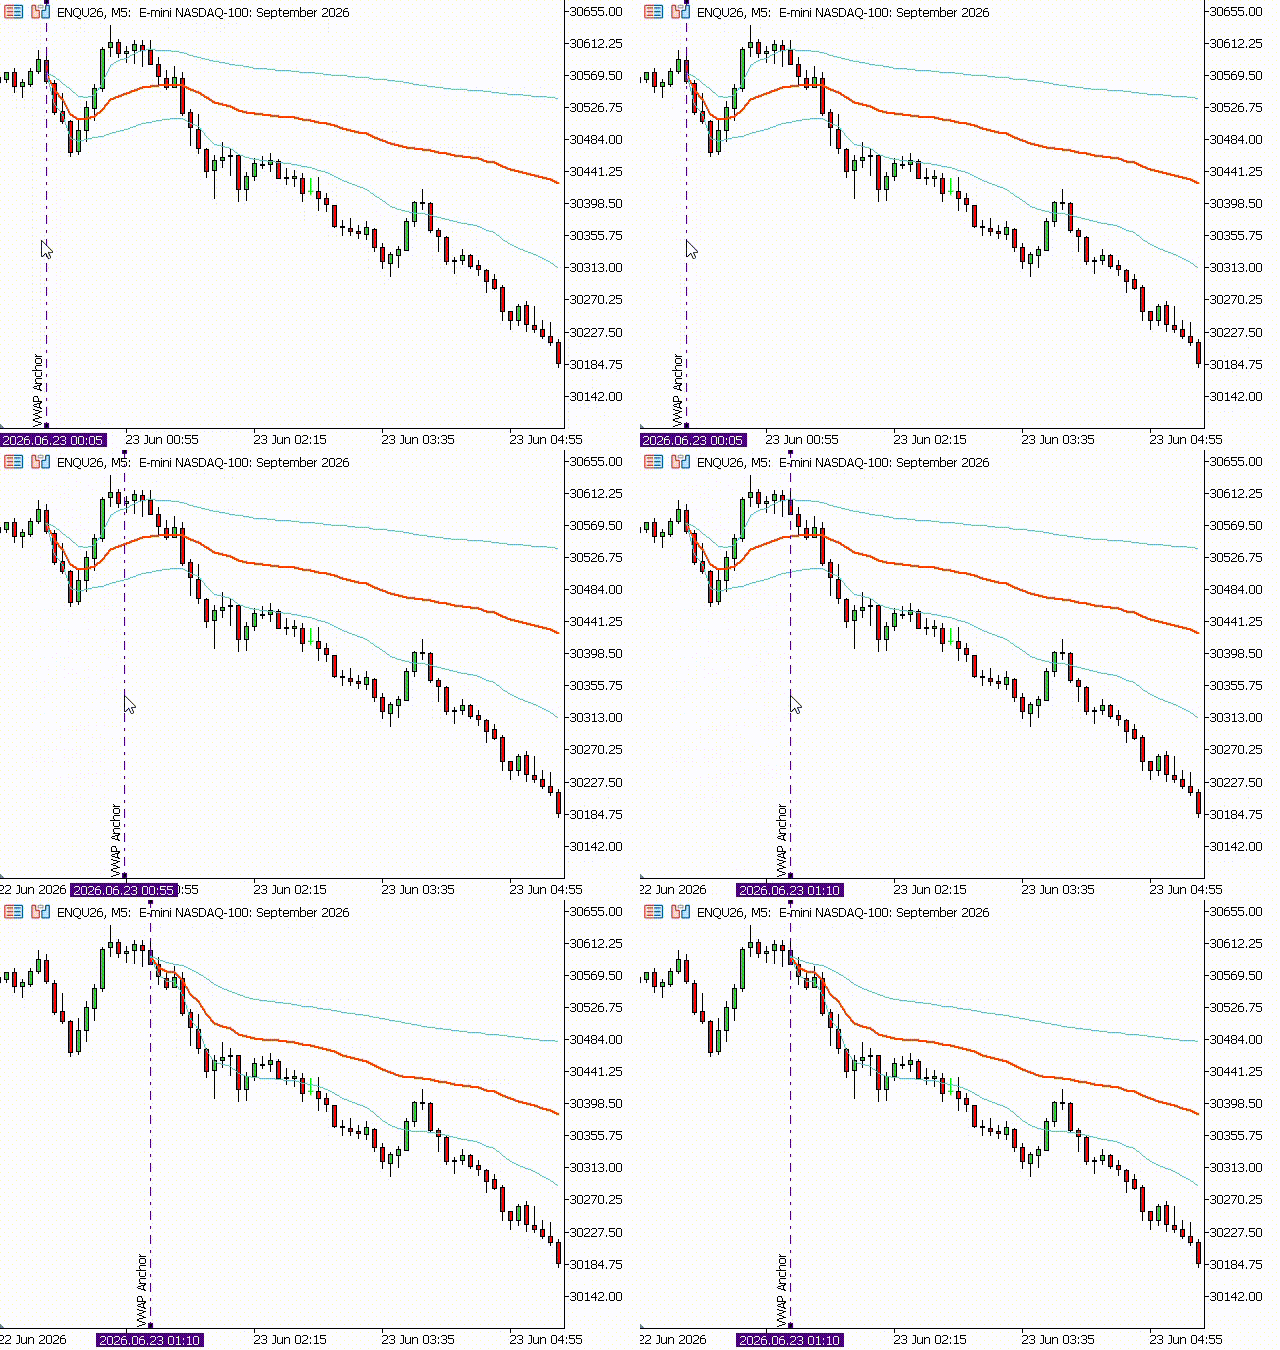
Anchored VWAP with a draggable anchor line
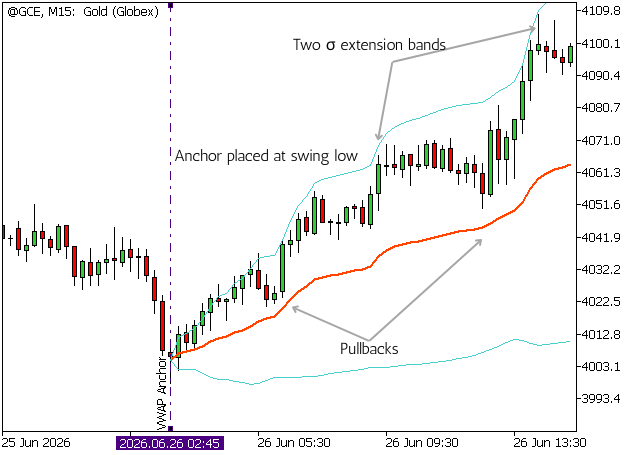
Trend analysis using VWAP anchored at swing low
In this article, we will build an Anchored VWAP indicator in MQL5. Users can set precise anchor times and drag an on-chart anchor line to adjust placement visually. We will implement two modes: a fixed anchor for single-event analysis and a session-reset mode. Session boundaries can be daily, weekly, or monthly. The indicator supports optional standard deviation bands and a selectable applied price. It also supports multiple instances to run several anchors on the same chart. We will focus on indicator architecture: buffer layout, anchor state management, chart object handling, and efficient recalculation.
Why Anchored VWAP Matters
A precursor of the Anchored VWAP is the standard VWAP, which has the same mathematical basis as the Anchored VWAP, but it starts the calculation at the session open and resets at the end of the trading day. By letting traders anchor VWAP beyond the standard session boundary, Anchored VWAP resolves the standard VWAP's main limitation. It also extends volume-weighted analysis to non-session-based use cases. This makes the Anchored VWAP suitable for:
- Custom Session Boundaries
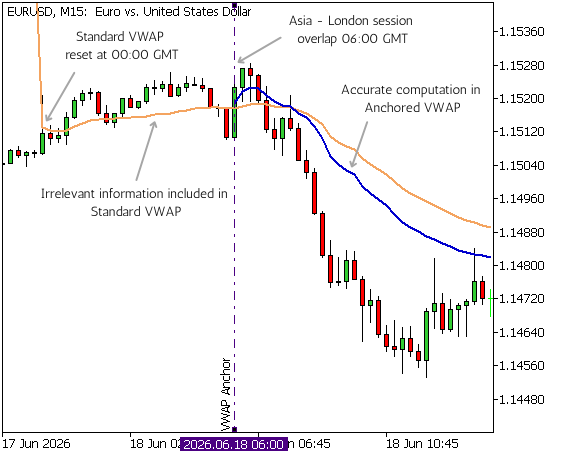
By placing the anchor at the start of the actual personal trading session, a trader can benchmark against an average that is indicative of the activity of the participants, analyze trends, and establish key levels pertaining to the session.
Custom session boundaries using Anchored VWAP
- Event-Driven Trading
The Anchored VWAP, when placed at the time of key market-moving events, can offer a view that is genuinely representative of the event-driven trading.
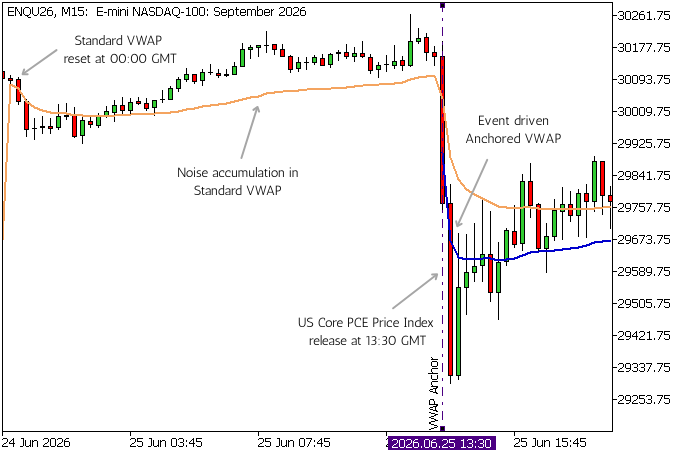
Event-driven trading using Anchored VWAP
- Accumulative Analysis
By positioning the anchor at specific market points such as year starts, traders can gauge the overall state of the average market participant as the Anchored VWAP dynamically evolves over any timeframe.
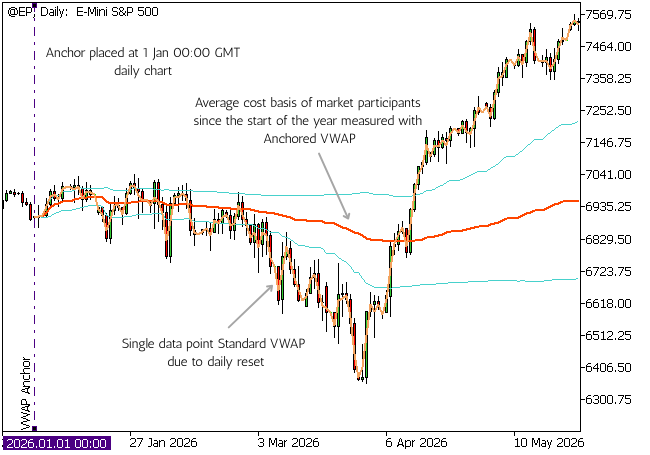
Accumulative analysis using Anchored VWAP
It is safe to say that the Anchored VWAP is not just an improvement over the standard VWAP but a wholly new trading tool in its own right. With its benchmarking, technical, and analytical capabilities beyond the standard VWAP, the Anchored VWAP is a versatile all-in-one indicator.
Calculation Methodology
The Anchored VWAP consists of the main volume-weighted average price and the standard deviation bands calculated cumulatively from the anchor point forward. The VWAP is given by the formula:
VWAP = Σ(P × Volume) / Σ(Volume)

Where:
P = Typical price
Volume = Tick/Real volume
Σ = Cumulative total beyond the anchor point
The typical price is the average of the high, low, and closing prices for a given period and is traditionally the price base over which the VWAP is calculated. The typical price is obtained using the formula:
P = (High + Low + Close) / 3 Standard deviation bands are added to define statistical probability zones and normalize volatility visualization across different instruments. The standard deviation σ is given by:
σ = √[ Σ(P² × Volume) / Σ(Volume) - VWAP² ]
The upper and lower standard deviation bands are calculated for a user-input multiplier as follows:
Upper Band = VWAP + (Multiplier × σ)
Lower Band = VWAP - (Multiplier × σ)
Throughout the article, we will implement the Anchored VWAP to work with all price bases, including the typical price. The Applied Price section will cover the computations of the price bases. The Volume Types section will describe volume types and use tick volume as a practical proxy for trading activity in asset classes where real volume is inaccessible. The formulas from this section will be implemented in the Indicator Calculation section.
Indicator Template
Get started by creating a custom indicator document in the MetaEditor; include the OnCalculate and OnChartEvent event handlers in the MQL Wizard. The generated indicator template should appear as shown below.
//+------------------------------------------------------------------+
//|                                                Anchored VWAP.mq5 |
//|                                                      Author Name |
//|                                             https://www.mql5.com |
//+------------------------------------------------------------------+
#property copyright "Author Name"
#property link      "https://www.mql5.com"
#property version   "1.00"
#property indicator_chart_window
//+------------------------------------------------------------------+
//| Custom indicator initialization function                         |
//+------------------------------------------------------------------+
int OnInit()
  {
//--- indicator buffers mapping

//---
   return(INIT_SUCCEEDED);
  }
//+------------------------------------------------------------------+
//| Custom indicator iteration function                              |
//+------------------------------------------------------------------+
int OnCalculate(const int32_t rates_total,
                const int32_t prev_calculated,
                const datetime &time[],
                const double &open[],
                const double &high[],
                const double &low[],
                const double &close[],
                const long &tick_volume[],
                const long &volume[],
                const int32_t &spread[])
  {
//---

//--- return value of prev_calculated for next call
   return(rates_total);
  }
//+------------------------------------------------------------------+
//| ChartEvent function                                              |
//+------------------------------------------------------------------+
void OnChartEvent(const int32_t id,
                  const long &lparam,
                  const double &dparam,
                  const string &sparam)
  {
//---

  }
//+------------------------------------------------------------------+
The indicator makes use of four event handlers, each assigned a distinct responsibility within the indicator lifecycle. Here is an overview of their responsibilities:
| Function | Purpose |
|---|---|
| OnInit | Validate inputs, check object collisions, bind buffers, set globals and indicator properties, draw anchor line |
| OnCalculate | Compute VWAP and standard deviation bands |
| OnChartEvent | Handle changes when the anchor line gets dragged |
| OnDeinit | Delete anchor line |
Properties
Program properties can be broadly divided into general properties and indicator properties. The MQL wizard has already generated the copyright, link, and version properties for us. We will include description to provide a brief description of the indicator that can be viewed from the input wizard. Our general properties should appear as shown below.
//--- General properties
#property copyright     "Author Name"
#property link          "https://www.mql5.com"
#property version       "1.00"
#property description   "Anchored VWAP with session reset and a draggable anchor line"
We will now focus on the indicator properties. We want the Anchored VWAP to be overlaid onto the regular chart, so we specify the indicator_chart_window property. Plots are visual representations of the values in the buffers. The three plots of the Anchored VWAP in their corresponding numerical ordering are as follows:
- VWAP—the central plot representing the volume-weighted average price.
- Upper Band—the upper standard deviation plot at a user input multiplier.
- Lower Band—the lower standard deviation plot at a user input multiplier.
This ordering will be followed in the declaration of additional indicator properties. Each of these three plots will have corresponding buffers. In addition, we specify three auxiliary buffers to aid in the calculation logic. In total we get the mandatory indicator properties as shown below.
//--- Obligatory indicator properties
#property indicator_chart_window
#property indicator_buffers   6
#property indicator_plots     3
We can now specify the indicator properties that concern the external settings of indicators. We will use the DRAW_LINE type of the ENUM_DRAW_TYPE for all three of our plots. Colors for individual plots can be specified using the color type. We will opt for STYLE_SOLID of the ENUM_LINE_STYLE for our plot styles. The line width can be specified with an int numbering starting from 1. Putting it all together, we get the complete properties section.
//--- General properties
#property copyright     "Author Name"
#property link          "https://www.mql5.com"
#property version       "1.00"
#property description   "Anchored VWAP with session reset and a draggable anchor line"

//--- Indicator properties
#property indicator_chart_window
#property indicator_buffers   6
#property indicator_plots     3

#property indicator_label1    "Anchored VWAP"
#property indicator_type1     DRAW_LINE
#property indicator_color1    clrOrangeRed
#property indicator_style1    STYLE_SOLID
#property indicator_width1    2

#property indicator_label2    "Anchored VWAP Upper"
#property indicator_type2     DRAW_LINE
#property indicator_color2    clrMediumTurquoise
#property indicator_style2    STYLE_SOLID
#property indicator_width2    1

#property indicator_label3    "Anchored VWAP Lower"
#property indicator_type3     DRAW_LINE
#property indicator_color3    clrMediumTurquoise
#property indicator_style3    STYLE_SOLID
#property indicator_width3    1
Headers
MQL5 provides us with several predefined classes to aid in our development. Among them, we will use the CDateTime class for working with date and time. To instantiate objects of the CDateTime class, we include the header file containing its class declaration as shown below.
#include <Tools\DateTime.mqh> Input Definition and Validation
We are now ready to define the indicator inputs. Enum VwapType will indicate if the Anchored VWAP should reset at the end of each trading session or accumulate from the fixed anchor date onwards.
enum VwapType
  {
   vwap_reset, // Session (resets every session)
   vwap_fixed  // Fixed (single anchor)
  };
For the reset mode, we will need to determine the length of the trading session. Let us define an enum SessionType for session lengths lasting a day, a week, and a month.
enum SessionType
  {
   session_day,   // Day
   session_week,  // Week
   session_month, // Month
  };
Finally, we need an enum for the user to apply the VWAP to the price base of their choice. By default the VWAP is designed around the typical price that captures the full price action of the period. However, traders may prefer to opt for price points such as close and median prices or wider price averages, considering the entire OHLC data. So we define enum AppliedPriceType as shown below.
enum AppliedPriceType
  {
   applied_price_open,      // Open
   applied_price_high,      // High
   applied_price_low,       // Low
   applied_price_close,     // Close
   applied_price_median,    // Median (H+L)/2
   applied_price_typical,   // Typical (H+L+C)/3
   applied_price_weighted,  // Weighted (H+L+C+C)/4
   applied_price_average    // Average (O+H+L+C)/4
  };
Now we can define the first group of inputs for the general VWAP settings.
input group             "VWAP Settings"
input datetime          InpAncTime              = D'2026.01.01 00:00';     // Anchor Date and Time
input AppliedPriceType  InpAppliedPrice         = applied_price_typical;   // Applied Price
The second group of inputs corresponds to the session settings. It will comprise fields of the VwapType and SessionType enumerations. Default values will reset the VWAP at the end of the day like the standard VWAP counterpart.
input group             "Session Settings"
input VwapType          InpVwapType             = vwap_reset;              // VWAP Mode
input SessionType       InpSessionType          = session_day;             // Session Duration
The third group of inputs will enable the standard deviation bands at a certain multiplier.
input group             "Band Settings"
input bool              InpShouldShowBands      = true;                    // Show Standard Deviation Bands
input double            InpBandMultiplier       = 1.0;                     // Band Multiplier
The fourth set of inputs will concern the interactivity and appearance of the anchor line.
input group             "Anchor Line Settings"
input bool              InpIsAnchorLineDrag     = false;                   // Draggable Anchor
input color             InpAnchorLineColor      = clrIndigo;               // Line Color
input ENUM_LINE_STYLE   InpAnchorLineStyle      = STYLE_DASHDOT;           // Line Style
Finally, we add a uint ID to uniquely identify each indicator instance on the chart. The anchor line is a graphical object, and every graphical object should have a unique name within one chart. The ID is used to generate unique object names. This prevents collisions when multiple instances run on the same chart.
input group             "Identification Settings"
input uint              InpIndicatorId          = 1;                       // Unique Indicator Instance ID
Putting it all together, we have our input definitions.
//--- Input definition
input group             "VWAP Settings"
input datetime          InpAncTime              = D'2026.01.01 00:00';     // Anchor Date and Time
input AppliedPriceType  InpAppliedPrice         = applied_price_typical;   // Applied Price
input group             "Session Settings"
input VwapType          InpVwapType             = vwap_reset;              // VWAP Mode
input SessionType       InpSessionType          = session_day;             // Session Duration
input group             "Band Settings"
input bool              InpShouldShowBands      = true;                    // Show Standard Deviation Bands
input double            InpBandMultiplier       = 1.0;                     // Band Multiplier
input group             "Anchor Line Settings"
input bool              InpIsAnchorLineDrag     = false;                   // Draggable Anchor
input color             InpAnchorLineColor      = clrIndigo;               // Line Color
input ENUM_LINE_STYLE   InpAnchorLineStyle      = STYLE_DASHDOT;           // Line Style
input group             "Identification Settings"
input uint              InpIndicatorId          = 1;                       // Unique Indicator Instance ID
The inputs defined above are global to the program. Likewise, we will define three global variables of string type for the anchor line, outside the scope of any function. The AnchorLinePrefix is the prefix for the anchor line name, and AnchorLineLabel is the label to be displayed along the anchor line. We assign appropriate values for these but defer the AnchorLineName to OnInit to maintain the uniqueness of the graphical object name by incorporating the indicator ID from the inputs in the anchor line name.
//--- Global variables
string   AnchorLinePrefix     = "anchor_line_";
string   AnchorLineLabel      = "VWAP Anchor";
string   AnchorLineName;
Now we can validate our inputs in the initialization function. The InpBandMultiplier cannot be zero or negative; a zero or negative multiplier does not represent a valid state. To validate InpIndicatorId, we first derive the name of the anchor line object by appending the string representation of InpIndicatorId to the global variable AnchorLinePrefix defined above. We then use object functions, particularly ObjectFind, to search if an object with the specified ID already exists on the chart. ObjectFind returns the number of the subwindow in which the object belongs, if found, and a negative number otherwise. So we check for a nonnegative return value. Combining the two, our OnInit function should appear as shown below.
//+------------------------------------------------------------------+
//| Custom indicator initialization function                         |
//+------------------------------------------------------------------+
int OnInit()
  {
//--- Input validation
   if(InpBandMultiplier <= 0)
     {
      Print("Band multiplier should be greater than 0");
      return INIT_PARAMETERS_INCORRECT;
     }

//--- Check if indicator with the same id already exists and prompt the user for new id to avoid object collision
   AnchorLineName    = AnchorLinePrefix + IntegerToString(InpIndicatorId);
   if(ObjectFind(ChartID(), AnchorLineName) >= 0)
     {
      Print("Indicator with the same id already exists, supply a new id to avoid object collision."); // Alert can be used as an alternative to Print
      return INIT_PARAMETERS_INCORRECT;
     }

   return(INIT_SUCCEEDED);
  }
Buffer Declaration
In this section, we will declare the dynamic arrays for our indicator buffers. We will declare six arrays of double type as global variables, shown below. The comments following the declaration explain the responsibility of each buffer array.
//--- Indicator buffers
double vwapBuffer[];    // Holds the values of the anchored vwap
double upperBuffer[];   // Holds the values of the upper standard deviation band
double lowerBuffer[];   // Holds the values of the lower standard deviation band
double pvBuffer[];      // Holds the cumulative sum values of (price * volume)
double vBuffer[];       // Holds the cumulative sum values of volume
double p2vBuffer[];     // Holds the cumulative sum values of (price^2 * volume)
By default, arrays and indicator buffers are indexed left to right: index 0 is the leftmost bar, and the last index is the rightmost (current) bar. MQL5 also offers time series indexing, which reverses the default using ArraySetAsSeries. Throughout this tutorial, we will follow standard array indexing for the indicator buffers as illustrated in the figure below.
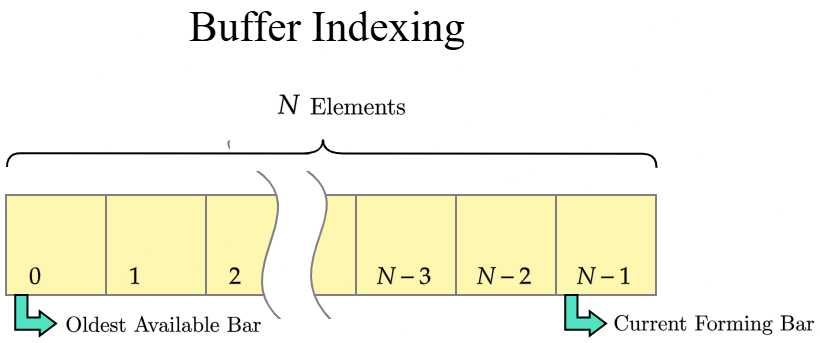
Buffer values accessed using left-to-right array indexing
Initialization
With our inputs validated and our buffer arrays defined, in this section, we will initialize the indicator buffers and plots in OnInit. We begin by binding the dynamic arrays to the specified indicator buffer using the SetIndexBuffer function. The ENUM_INDEXBUFFER_TYPE specifies the type of data that the buffer will store. Plots are graphical representations of the INDICATOR_DATA buffer type. We need to follow the same ordering as the plots defined in the Properties section while binding their corresponding indicator buffers. A nuance is that the numeration of plots starts with one, while the numeration of the index of the indicator buffers and plots starts with zero. Keeping that in mind, we will bind the INDICATOR_DATA buffers in the order of their corresponding plots in the OnInit function.
//--- Binding indicator data buffers
SetIndexBuffer(0, vwapBuffer,    INDICATOR_DATA);
SetIndexBuffer(1, upperBuffer,   INDICATOR_DATA);
SetIndexBuffer(2, lowerBuffer,   INDICATOR_DATA);
We will then bind the three auxiliary INDICATOR_CALCULATIONS buffers. Since calculation buffers do not have corresponding plots, the indexing order only serves as a way to reference the buffer in future function calls.
//--- Binding indicator calculation buffers
SetIndexBuffer(3, pvBuffer,      INDICATOR_CALCULATIONS);
SetIndexBuffer(4, vBuffer,       INDICATOR_CALCULATIONS);
SetIndexBuffer(5, p2vBuffer,     INDICATOR_CALCULATIONS);
With the buffer binding completed, we can proceed to set the indicator and plot properties using function calls. We first set the PLOT_EMPTY_VALUE property using PlotIndexSetDouble. This property represents the values for which the plot should not draw. We will set this to a named constant, EMPTY_VALUE.
//--- Set the plot value for empty buffer values
PlotIndexSetDouble(0, PLOT_EMPTY_VALUE, EMPTY_VALUE);
PlotIndexSetDouble(1, PLOT_EMPTY_VALUE, EMPTY_VALUE);
PlotIndexSetDouble(2, PLOT_EMPTY_VALUE, EMPTY_VALUE);
We set the accuracy of our indicator by setting the INDICATOR_DIGITS property using IndicatorSetInteger and passing the Digits function value to match the digits of the chart.
//--- Set the accuracy of the indicator
IndicatorSetInteger(INDICATOR_DIGITS, Digits());
Finally, we set the INDICATOR_SHORTNAME property using IndicatorSetString to set a short display name for the indicator and its parameters. This name will appear in the indicator list of our chart. We first define two helper functions that return a string representation of our VwapType and AppliedPriceType. As a design choice, we pass the enum value as a function argument instead of directly referencing the inputs to make the function reusable in other MQL5 projects.
//+------------------------------------------------------------------+
//| Returns string representation of enum VwapType                   |
//+------------------------------------------------------------------+
string GetVwapTypeString(VwapType vwapType)
  {
   switch(vwapType)
     {
      case vwap_reset:
         return "Session";
      case vwap_fixed:
         return "Fixed";
      default:
         return "Session";
     }
  }

//+------------------------------------------------------------------+
//| Returns string representation of enum AppliedPriceType           |
//+------------------------------------------------------------------+
string GetAppliedPriceString(AppliedPriceType appPrice)
  {
   switch(appPrice)
     {
      case applied_price_open:
         return "Open";
      case applied_price_high:
         return "High";
      case applied_price_low:
         return "Low";
      case applied_price_close:
         return "Close";
      case applied_price_median:
         return "Median HL/2";
      case applied_price_typical:
         return "Typical HLC/3";
      case applied_price_weighted:
         return "Weighted HLCC/4";
      case applied_price_average:
         return "Average OHLC/4";
      default:
         return "Typical HLC/3";
     }
  }
We will format the name using StringFormat and set the indicator short name.
//--- Set the indicator short name
IndicatorSetString(INDICATOR_SHORTNAME, StringFormat("Anchored VWAP, %s, %s", GetVwapTypeString(InpVwapType), GetAppliedPriceString(InpAppliedPrice)));
Putting it all together, we get our OnInit function.
//+------------------------------------------------------------------+
//| Custom indicator initialization function                         |
//+------------------------------------------------------------------+
int OnInit()
  {
//--- Input validation
   if(InpBandMultiplier <= 0)
     {
      Print("Band multiplier should be greater than 0");
      return INIT_PARAMETERS_INCORRECT;
     }

//--- Check if indicator with the same id already exists and prompt the user for new id to avoid object collision
   AnchorLineName    = AnchorLinePrefix + IntegerToString(InpIndicatorId);
   if(ObjectFind(ChartID(), AnchorLineName) >= 0)
     {
      Print("Indicator with the same id already exists, supply a new id to avoid object collision."); // Alert can be used as an alternative to Print
      return INIT_PARAMETERS_INCORRECT;
     }

//--- Binding indicator data buffers
   SetIndexBuffer(0, vwapBuffer,    INDICATOR_DATA);
   SetIndexBuffer(1, upperBuffer,   INDICATOR_DATA);
   SetIndexBuffer(2, lowerBuffer,   INDICATOR_DATA);

//--- Binding indicator calculation buffers
   SetIndexBuffer(3, pvBuffer,      INDICATOR_CALCULATIONS);
   SetIndexBuffer(4, vBuffer,       INDICATOR_CALCULATIONS);
   SetIndexBuffer(5, p2vBuffer,     INDICATOR_CALCULATIONS);

//--- Set the plot value for empty buffer values
   PlotIndexSetDouble(0, PLOT_EMPTY_VALUE, EMPTY_VALUE);
   PlotIndexSetDouble(1, PLOT_EMPTY_VALUE, EMPTY_VALUE);
   PlotIndexSetDouble(2, PLOT_EMPTY_VALUE, EMPTY_VALUE);

//--- Set the accuracy of the indicator
   IndicatorSetInteger(INDICATOR_DIGITS, Digits());

//--- Set the indicator short name
   IndicatorSetString(INDICATOR_SHORTNAME, StringFormat("Anchored VWAP, %s, %s", GetVwapTypeString(InpVwapType), GetAppliedPriceString(InpAppliedPrice)));

   return(INIT_SUCCEEDED);
  }
//+------------------------------------------------------------------+
The Anchor Line
In this section, we will define all the functions we need to work with the anchor line. We will create the anchor line in the DrawAnchorLine function, manage user-made changes in the OnChartEvent handler, and clean up the anchor line object in the OnDeinit handler. First, we need to understand the control flow of the anchor line. The user launches the indicator with an input anchor date and time, InpAncTime. This is the initial anchor for the indicator calculation and also the anchor at which we will first draw the anchor line. The anchor line, however, is configurable to be dragged. When the user drags the anchor line, the indicator recalculates from the new anchor time. The anchor line is therefore an indirect input to the indicator. Thus, we keep track of:
- Is a recalculation needed due to the anchor line being dragged?
- What is the new value of the anchor date and time?
Let us create global variables for the same. The first variable tracks the anchor line change by denoting whether the indicator has to be recalculated. The second variable stores the value of the new anchor. We prefix these with gbl to indicate that they are actively involved in state management. We ensure that gblAncTime always tracks the latest value of the anchor date and time. By doing so, we can base the indicator calculations on the value of gblAncTime alone and decouple it from the input and anchor line logic.
//--- Global variables
bool     gblShouldRecalc;
datetime gblAncTime;
We initialize gblShouldRecalc to false and gblAncTime to InpAncTime at initialization in OnInit to represent the user inputs.
//--- Initialize the global variables inside OnInit
gblShouldRecalc   = false;
gblAncTime        = InpAncTime;
Let us define the DrawAnchorLine function to create the anchor line using the ObjectCreate. The anchor line is OBJ_VLINE and requires only the time coordinate of the horizontal intercept, which, as explained above, will be the gblAncTime. The OBJPROP_COLOR and OBJPROP_STYLE object properties can be set to user inputs using ObjectSetInteger. For the display label, AnchorLineLabel defined in the Input Definition section, we will set the OBJPROP_TEXT property using the ObjectSetString function and enable CHART_SHOW_OBJECT_DESCR using ChartSetInteger. Finally, to make the anchor line selectable and draggable, we will set the OBJPROP_SELECTABLE and OBJPROP_SELECTED properties to true using ObjectSetInteger depending on the value of InpIsAnchorLineDrag. This will give us the DrawAnchorLine function.
//+------------------------------------------------------------------+
//| Draws the anchor line                                            |
//+------------------------------------------------------------------+
void DrawAnchorLine()
  {
   long chartId   = ChartID();
   int  subWindow = 0; // Main chart

//--- Create the anchor line
   ObjectCreate(chartId, AnchorLineName, OBJ_VLINE, subWindow, gblAncTime, 0); // OBJ_VLINE has no price coordinate

//--- Set anchor line display properties
   ObjectSetInteger(chartId, AnchorLineName, OBJPROP_COLOR, InpAnchorLineColor);
   ObjectSetInteger(chartId, AnchorLineName, OBJPROP_STYLE, InpAnchorLineStyle);

//--- Set anchor line label and enable display
   ObjectSetString(chartId,  AnchorLineName, OBJPROP_TEXT, AnchorLineLabel);
   ChartSetInteger(chartId,  CHART_SHOW_OBJECT_DESCR, true);

//--- Make the anchor line selectable
   if(InpIsAnchorLineDrag)
     {
      ObjectSetInteger(chartId, AnchorLineName, OBJPROP_SELECTABLE,  true);
      ObjectSetInteger(chartId, AnchorLineName, OBJPROP_SELECTED,    true);
     }
  }
Object creation and cleanup go hand in hand. We should delete the anchor line object when the indicator is removed to not clutter the chart. We can do this in the OnDeinit deinitialization function whose signature we need to include from the OnDeinit documentation page. To delete the anchor line object, call ObjectDelete and pass the AnchorLineName along with the ChartID. Thus, we get our OnDeinit function.
//+------------------------------------------------------------------+
//| Custom indicator deinitialization function                       |
//+------------------------------------------------------------------+
void  OnDeinit(const int  reason)
  {
   ObjectDelete(ChartID(), AnchorLineName);
  }
Finally, let us define the OnChartEvent function to process changes made to the anchor line. We check if the id parameter is equal to CHARTEVENT_OBJECT_DRAG and if the sparam value matches AnchorLineName to verify that the anchor line was dragged. Also, we only process the event if InpIsAnchorLineDrag is true. We read the new anchor time via OBJPROP_TIME and ObjectGetInteger. Then we update gblAncTime and set gblShouldRecalc = true.
//+------------------------------------------------------------------+
//| ChartEvent function                                              |
//+------------------------------------------------------------------+
void OnChartEvent(const int32_t id,
                  const long &lparam,
                  const double &dparam,
                  const string &sparam)
  {
   if(!InpIsAnchorLineDrag)
      return;

//--- Verify if the chart event relates to the anchor line
   if(id != CHARTEVENT_OBJECT_DRAG)
      return;
   if(sparam != AnchorLineName)
      return;

//--- Update the values of the global variables.
   gblAncTime = (datetime) ObjectGetInteger(ChartID(), AnchorLineName, OBJPROP_TIME);
   gblShouldRecalc = true;
  }
We call DrawAnchorLine from OnInit to complete the function and the initialization process.
//+------------------------------------------------------------------+
//| Custom indicator initialization function                         |
//+------------------------------------------------------------------+
int OnInit()
  {
//--- Input validation
   if(InpBandMultiplier <= 0)
     {
      Print("Band multiplier should be greater than 0");
      return INIT_PARAMETERS_INCORRECT;
     }

//--- Check if indicator with the same id already exists and prompt the user for new id to avoid object collision
   AnchorLineName    = AnchorLinePrefix + IntegerToString(InpIndicatorId);
   if(ObjectFind(ChartID(), AnchorLineName) >= 0)
     {
      Print("Indicator with the same id already exists, supply a new id to avoid object collision."); // Alert can be used as an alternative to Print
      return INIT_PARAMETERS_INCORRECT;
     }

//--- Binding indicator data buffers
   SetIndexBuffer(0, vwapBuffer,    INDICATOR_DATA);
   SetIndexBuffer(1, upperBuffer,   INDICATOR_DATA);
   SetIndexBuffer(2, lowerBuffer,   INDICATOR_DATA);

//--- Binding indicator calculation buffers
   SetIndexBuffer(3, pvBuffer,      INDICATOR_CALCULATIONS);
   SetIndexBuffer(4, vBuffer,       INDICATOR_CALCULATIONS);
   SetIndexBuffer(5, p2vBuffer,     INDICATOR_CALCULATIONS);

//--- Set the plot value for empty buffer values
   PlotIndexSetDouble(0, PLOT_EMPTY_VALUE, EMPTY_VALUE);
   PlotIndexSetDouble(1, PLOT_EMPTY_VALUE, EMPTY_VALUE);
   PlotIndexSetDouble(2, PLOT_EMPTY_VALUE, EMPTY_VALUE);

//--- Set the accuracy of the indicator
   IndicatorSetInteger(INDICATOR_DIGITS, Digits());

//--- Set the indicator short name
   IndicatorSetString(INDICATOR_SHORTNAME, StringFormat("Anchored VWAP, %s, %s", GetVwapTypeString(InpVwapType), GetAppliedPriceString(InpAppliedPrice)));

//--- Initialize the global variables
   gblShouldRecalc   = false;
   gblAncTime        = InpAncTime;

//--- Draw the anchor line
   DrawAnchorLine();
   return(INIT_SUCCEEDED);
  }
Applied Price
With the initialization completed, the rest of the article will focus on the implementation of the OnCalculate function and the formulas in the Calculation Methodology section. We begin by defining helpers that will retrieve the appropriate values of the price, volume, and time. In this section, we will define the GetAppliedPrice function for the applied price base. The Price Constants documentation lists the formulas for the various applied price bases. Additionally, we include the average price, which is the average of the OHLC values. While it is possible to maintain a separate buffer for these computed prices, we choose to save those resources as a design choice by observing that the formula does not call for repeated computation of price values. The GetAppliedPrice function accepts a reference to the OHLC arrays of the price values and returns the applied price value for the idx position. This gives us our GetAppliedPrice function.
//+------------------------------------------------------------------+
//| Returns the applied price for the idx index position             |
//+------------------------------------------------------------------+
double GetAppliedPrice(int idx, const double &open[], const double &high[], const double &low[], const double &close[])
  {
   switch(InpAppliedPrice)
     {
      case applied_price_open:
         return open[idx];
      case applied_price_high:
         return high[idx];
      case applied_price_low:
         return low[idx];
      case applied_price_close:
         return close[idx];
      case applied_price_median:
         return (high[idx] + low[idx])/2;
      case applied_price_typical:
         return (high[idx] + low[idx]  + close[idx])/3;
      case applied_price_weighted:
         return (high[idx] + low[idx]  + close[idx] + close[idx])/4;
      case applied_price_average:
         return (open[idx] + high[idx] + low[idx]   + close[idx])/4;
      default:
         return (high[idx] + low[idx]  + close[idx])/3;
     }
  }
Volume Types
The OnCalculate function provides volume data in the form of two arrays—volume and tick_volume. The volume array holds real volume that represents the actual number of contracts or lots traded during the specified period. Tick volume is the number of price changes (ticks) within the specified period. Let us define a function GetVolume to return the volume data for our indicator calculation. It will accept a reference to both the volume and tick_volume arrays as well as the index idx for which the volume data is needed. We will first check for real volume data, and in asset classes where real volume is inaccessible, return the tick volume as a practical proxy for trading activity. Either volume data of long type will need to be typecast to a double value for the indicator calculations.
//+------------------------------------------------------------------+
//| Returns the volume for the idx index position                    |
//+------------------------------------------------------------------+
double GetVolume(int idx, const long &volume[], const long &tick_volume[])
  {
   if(volume[idx] > 0)
      return (double) volume[idx];
   return (double) tick_volume[idx];
  }
Next Anchor Time
In this section, we will define the GetNextAnchor function to return the anchor datetime value for the next trading session whenever we need to reset the VWAP. This will enable us to reset the cumulative sums of our indicator calculation buffers at the start of the next session. The function takes an anchor time, ancTime, and a current time, curTime, and returns the next session anchor time following curTime. For the fixed VWAP mode, where we do not need to reset the anchor, GetNextAnchor will return the numerical type constant, LONG_MAX, indicating an infinite session reset time. We will return 0 when curTime is less than ancTime as the first session will not have yet begun. Let us start by coding these two edge cases.
if(curTime < ancTime)
   return 0;

//--- Return the maximum value of long for fixed vwap mode
if(InpVwapType == vwap_fixed)
   return LONG_MAX;
For day and week sessions, the next anchor can be computed in O(1) time. We convert the session length to seconds and round the current datetime up to the next multiple since ancTime. As months have varying lengths, we will first approximate a month's length to 28 days to first guarantee convergence in O(1) time and then use the MonInc method of the CDateTime class to precisely add the number of seconds depending on the month and loop until we find the session time next to curTime.
int secondsPerDay   = 86400;  // Seconds in a day
int minDaysPerMonth = 28;     // February

if(InpSessionType == session_month)
  {
   CDateTime dateOp;
   dateOp.DateTime(ancTime);
//--- Approximate the month using least days in a month
   int monthsElapsed = (int)((curTime-ancTime) / (secondsPerDay*minDaysPerMonth));

//--- Loop until date exceeds current time
   if(monthsElapsed > 1)
      dateOp.MonInc(monthsElapsed-1);    // Subtract one extra month for safe approximation
   while(dateOp.DateTime() <= curTime)
      dateOp.MonInc(1);
   return dateOp.DateTime();
  }
We will calculate the number of seconds for the day and week trading sessions and round up the elapsed sessions between curTime and ancTime. Finally, we will multiply the rounded-up sessions with the seconds per session and add it to ancTime to get the next anchor datetime.
//--- Calculate seconds per session
int secondsPerSession;
switch(InpSessionType)
  {
case session_day:
   secondsPerSession = secondsPerDay;
   break;
case session_week:
   secondsPerSession = secondsPerDay * 7;
   break;
default:
   secondsPerSession = secondsPerDay;
   break;
  }

//--- Add one to elapsed units to round up datetime to the next session
long elapsed = (long)(curTime - ancTime);
long units   = elapsed / secondsPerSession;
return (datetime)(ancTime + (long)((units+1) * secondsPerSession));
Putting it together, we get our GetNextAnchor function.
//+------------------------------------------------------------------+
//| Returns the anchor time next to curTime starting from ancTime    |
//+------------------------------------------------------------------+
datetime GetNextAnchor(datetime ancTime, datetime curTime)
  {
   if(curTime < ancTime)
      return 0;

//--- Return the maximum value of long for fixed vwap mode
   if(InpVwapType == vwap_fixed)
      return LONG_MAX;

   int secondsPerDay   = 86400;  // Seconds in a day
   int minDaysPerMonth = 28;     // February

   if(InpSessionType == session_month)
     {
      CDateTime dateOp;
      dateOp.DateTime(ancTime);
      //--- Approximate the month using least days in a month
      int monthsElapsed = (int)((curTime-ancTime) / (secondsPerDay*minDaysPerMonth));

      //--- Loop until date exceeds current time
      if(monthsElapsed > 1)
         dateOp.MonInc(monthsElapsed-1);    // Subtract one extra month for safe approximation
      while(dateOp.DateTime() <= curTime)
         dateOp.MonInc(1);
      return dateOp.DateTime();
     }

//--- Calculate seconds per session
   int secondsPerSession;
   switch(InpSessionType)
     {
      case session_day:
         secondsPerSession = secondsPerDay;
         break;
      case session_week:
         secondsPerSession = secondsPerDay * 7;
         break;
      default:
         secondsPerSession = secondsPerDay;
         break;
     }

//--- Add one to elapsed units to round up datetime to the next session
   long elapsed = (long)(curTime - ancTime);
   long units   = elapsed / secondsPerSession;
   return (datetime)(ancTime + (long)((units+1) * secondsPerSession));
  }
Indicator Calculation
In this section, we will implement the OnCalculate function. In MQL5, rates_total is the size of the input arrays. prev_calculated is the number of bars processed on the previous call. Therefore, we typically calculate from prev_calculated - 1 to rates_total - 1. At the first call to OnCalculate, prev_calculated will be 0. If there is any change in the historical data, the terminal will again set prev_calculated to 0 to signal a full recalculation from the start. Finally, the global variable gblShouldRecalc will indicate if a full recalculation is needed due to the dragging of the anchor line. Since rates_total represents the number of bars on the chart, we will return 0 until there are sufficient bars. We set the start index, startIdx, to 0 when we need a full recalculation and to prev_calculated-1 when we do not.
//--- Insufficient number of bars for calculation
if(rates_total < 1)
   return 0;

//--- Set the value of the start index
int startIdx;
if(prev_calculated == 0)
   startIdx = 0;
else
   startIdx = prev_calculated - 1;

//--- Recalculate if anchor line is dragged
if(gblShouldRecalc)
  {
   startIdx = 0;
   gblShouldRecalc = false;
  }
Now we define the master for loop of the indicator inclusive of indexes from startIdx to rates_total-1.
for(int i = startIdx; i < rates_total; i++)
We will obtain the next anchor for the time value at index i. If the value returned is 0, the time at index i is before gblAncTime, so we set the buffers to appropriate empty values and continue to the next iteration of the loop. We will assign the named constant, EMPTY_VALUE, for the indicator data buffers to match the PLOT_EMPTY_VALUE property set in the Initialization section. For the calculation buffers, we will assign 0.
datetime nextAnchor = GetNextAnchor(gblAncTime, time[i]);

//--- Empty values for dates before the anchor time
if(nextAnchor == 0)
  {
   vwapBuffer[i]  = EMPTY_VALUE;
   upperBuffer[i] = EMPTY_VALUE;
   lowerBuffer[i] = EMPTY_VALUE;
   pvBuffer[i]    = 0.0;
   vBuffer[i]     = 0.0;
   p2vBuffer[i]   = 0.0;
   continue;
  }
If we have reached this point in the code, we are at or beyond gblAncTime and will need the price and volume data to assign values for our buffers. Let us obtain them using the functions defined in the Applied Price and Volume Types section, respectively.
//--- Get price and volume values for calculation
double price = GetAppliedPrice(i, open, high, low, close);
double vol   = GetVolume(i, volume, tick_volume);
First we assign values to the calculation buffers. To know if the time at index i is a session anchor, we can compare its GetNextAnchor value to the GetNextAnchor value of the time at index i-1. If they do not match, we are at a session boundary and need to reset the cumulative totals in the calculation buffers using the price and volume values of the new session starting at index i; if the values do match, both time at index i and i-1 belong to the same session, and we maintain the cumulative sum in the calculation buffers. If i == 0, this is the first bar at or beyond gblAncTime, so it becomes the initial anchor bar. We check this condition first to leverage short-circuit evaluation of || and avoid going out of bounds in the i-1 check.
//--- Assign values to calculation buffers
if(i == 0 || (nextAnchor != GetNextAnchor(gblAncTime, time[i-1])))
  {
//--- Initialize buffers at session anchors
   vBuffer[i]     = vol;
   pvBuffer[i]    = price * vol;
   p2vBuffer[i]   = price * price * vol;
  }
else
  {
//--- Cumulative sum of buffers
   vBuffer[i]     = vBuffer[i-1] + vol;
   pvBuffer[i]    = pvBuffer[i-1] + price * vol;
   p2vBuffer[i]   = p2vBuffer[i-1] + price * price * vol;
  }
Now we assign values to the indicator data buffers, implementing the formulas in the Calculation Methodology section. When InpShouldShowBands is false, both upperBuffer and lowerBuffer are assigned EMPTY_VALUE.
//--- Assign values to the indicator buffers
vwapBuffer[i]  = pvBuffer[i] / vBuffer[i];
if(InpShouldShowBands)
  {
   double var = p2vBuffer[i] / vBuffer[i] - MathPow(vwapBuffer[i], 2);
   double sd  = MathSqrt(var);
   upperBuffer[i] = vwapBuffer[i] + InpBandMultiplier * sd;
   lowerBuffer[i] = vwapBuffer[i] - InpBandMultiplier * sd;
  }
else
  {
   upperBuffer[i] = EMPTY_VALUE;
   lowerBuffer[i] = EMPTY_VALUE;
  }
Finally, we return rates_total to be the prev_calculated value to the next call to OnCalculate and keep the computations efficient.
return rates_total; With that, we complete the implementation of the OnCalculate function and the indicator calculation.
//+------------------------------------------------------------------+
//| Custom indicator iteration function                              |
//+------------------------------------------------------------------+
int OnCalculate(const int32_t rates_total,
                const int32_t prev_calculated,
                const datetime &time[],
                const double &open[],
                const double &high[],
                const double &low[],
                const double &close[],
                const long &tick_volume[],
                const long &volume[],
                const int32_t &spread[])
  {
//--- Insufficient number of bars for calculation
   if(rates_total < 1)
      return 0;

//--- Set the value of the start index
   int startIdx;
   if(prev_calculated == 0)
      startIdx = 0;
   else
      startIdx = prev_calculated - 1;

//--- Recalculate if anchor line is dragged
   if(gblShouldRecalc)
     {
      startIdx = 0;
      gblShouldRecalc = false;
     }

//--- Master loop
   for(int i = startIdx; i < rates_total; i++)
     {
      datetime nextAnchor = GetNextAnchor(gblAncTime, time[i]);

      //--- Empty values for dates before the anchor time
      if(nextAnchor == 0)
        {
         vwapBuffer[i]  = EMPTY_VALUE;
         upperBuffer[i] = EMPTY_VALUE;
         lowerBuffer[i] = EMPTY_VALUE;
         pvBuffer[i]    = 0.0;
         vBuffer[i]     = 0.0;
         p2vBuffer[i]   = 0.0;
         continue;
        }

      //--- Get price and volume values for calculation
      double price = GetAppliedPrice(i, open, high, low, close);
      double vol   = GetVolume(i, volume, tick_volume);

      //--- Assign values to calculation buffers
      if(i == 0 || (nextAnchor != GetNextAnchor(gblAncTime, time[i-1])))
        {
         //--- Initialize buffers at session anchors
         vBuffer[i]     = vol;
         pvBuffer[i]    = price * vol;
         p2vBuffer[i]   = price * price * vol;
        }
      else
        {
         //--- Cumulative sum of buffers
         vBuffer[i]     = vBuffer[i-1] + vol;
         pvBuffer[i]    = pvBuffer[i-1] + price * vol;
         p2vBuffer[i]   = p2vBuffer[i-1] + price * price * vol;
        }

      //--- Assign values to the indicator buffers
      vwapBuffer[i]  = pvBuffer[i] / vBuffer[i];
      if(InpShouldShowBands)
        {
         double var = p2vBuffer[i] / vBuffer[i] - MathPow(vwapBuffer[i], 2);
         double sd  = MathSqrt(var);
         upperBuffer[i] = vwapBuffer[i] + InpBandMultiplier * sd;
         lowerBuffer[i] = vwapBuffer[i] - InpBandMultiplier * sd;
        }
      else
        {
         upperBuffer[i] = EMPTY_VALUE;
         lowerBuffer[i] = EMPTY_VALUE;
        }
     }

   return rates_total;
  }
Putting It All Together
The complete code for the Anchored VWAP indicator is provided below.
//+------------------------------------------------------------------+
//|                                                Anchored VWAP.mq5 |
//|                                                      Author Name |
//|                                             https://www.mql5.com |
//+------------------------------------------------------------------+
//--- General properties
#property copyright     "Author Name"
#property link          "https://www.mql5.com"
#property version       "1.00"
#property description   "Anchored VWAP with session reset and a draggable anchor line"

//--- Indicator properties
#property indicator_chart_window
#property indicator_buffers   6
#property indicator_plots     3

#property indicator_label1    "Anchored VWAP"
#property indicator_type1     DRAW_LINE
#property indicator_color1    clrOrangeRed
#property indicator_style1    STYLE_SOLID
#property indicator_width1    2

#property indicator_label2    "Anchored VWAP Upper"
#property indicator_type2     DRAW_LINE
#property indicator_color2    clrMediumTurquoise
#property indicator_style2    STYLE_SOLID
#property indicator_width2    1

#property indicator_label3    "Anchored VWAP Lower"
#property indicator_type3     DRAW_LINE
#property indicator_color3    clrMediumTurquoise
#property indicator_style3    STYLE_SOLID
#property indicator_width3    1

//--- Header files
#include <Tools\DateTime.mqh>

//--- Enums
enum VwapType
  {
   vwap_reset, // Session (resets every session)
   vwap_fixed  // Fixed (single anchor)
  };

enum SessionType
  {
   session_day,   // Day
   session_week,  // Week
   session_month, // Month
  };

enum AppliedPriceType
  {
   applied_price_open,      // Open
   applied_price_high,      // High
   applied_price_low,       // Low
   applied_price_close,     // Close
   applied_price_median,    // Median (H+L)/2
   applied_price_typical,   // Typical (H+L+C)/3
   applied_price_weighted,  // Weighted (H+L+C+C)/4
   applied_price_average    // Average (O+H+L+C)/4
  };

//--- Input definition
input group             "VWAP Settings"
input datetime          InpAncTime              = D'2026.01.01 00:00';     // Anchor Date and Time
input AppliedPriceType  InpAppliedPrice         = applied_price_typical;   // Applied Price
input group             "Session Settings"
input VwapType          InpVwapType             = vwap_reset;              // VWAP Mode
input SessionType       InpSessionType          = session_day;             // Session Duration
input group             "Band Settings"
input bool              InpShouldShowBands      = true;                    // Show Standard Deviation Bands
input double            InpBandMultiplier       = 1.0;                     // Band Multiplier
input group             "Anchor Line Settings"
input bool              InpIsAnchorLineDrag     = false;                   // Draggable Anchor
input color             InpAnchorLineColor      = clrIndigo;               // Line Color
input ENUM_LINE_STYLE   InpAnchorLineStyle      = STYLE_DASHDOT;           // Line Style
input group             "Identification Settings"
input uint              InpIndicatorId          = 1;                       // Unique Indicator Instance ID

//--- Indicator buffers
double vwapBuffer[];    // Holds the values of the anchored vwap
double upperBuffer[];   // Holds the values of the upper standard deviation band
double lowerBuffer[];   // Holds the values of the lower standard deviation band
double pvBuffer[];      // Holds the cumulative sum values of (price * volume)
double vBuffer[];       // Holds the cumulative sum values of volume
double p2vBuffer[];     // Holds the cumulative sum values of (price^2 * volume)

//--- Globals
string   AnchorLinePrefix     = "anchor_line_";
string   AnchorLineLabel      = "VWAP Anchor";
string   AnchorLineName;
bool     gblShouldRecalc;
datetime gblAncTime;

//+------------------------------------------------------------------+
//| Custom indicator initialization function                         |
//+------------------------------------------------------------------+
int OnInit()
  {
//--- Input validation
   if(InpBandMultiplier <= 0)
     {
      Print("Band multiplier should be greater than 0");
      return INIT_PARAMETERS_INCORRECT;
     }

//--- Check if indicator with the same id already exists and prompt the user for new id to avoid object collision
   AnchorLineName    = AnchorLinePrefix + IntegerToString(InpIndicatorId);
   if(ObjectFind(ChartID(), AnchorLineName) >= 0)
     {
      Print("Indicator with the same id already exists, supply a new id to avoid object collision."); // Alert can be used as an alternative to Print
      return INIT_PARAMETERS_INCORRECT;
     }

//--- Binding indicator data buffers
   SetIndexBuffer(0, vwapBuffer,    INDICATOR_DATA);
   SetIndexBuffer(1, upperBuffer,   INDICATOR_DATA);
   SetIndexBuffer(2, lowerBuffer,   INDICATOR_DATA);

//--- Binding indicator calculation buffers
   SetIndexBuffer(3, pvBuffer,      INDICATOR_CALCULATIONS);
   SetIndexBuffer(4, vBuffer,       INDICATOR_CALCULATIONS);
   SetIndexBuffer(5, p2vBuffer,     INDICATOR_CALCULATIONS);

//--- Set the plot value for empty buffer values
   PlotIndexSetDouble(0, PLOT_EMPTY_VALUE, EMPTY_VALUE);
   PlotIndexSetDouble(1, PLOT_EMPTY_VALUE, EMPTY_VALUE);
   PlotIndexSetDouble(2, PLOT_EMPTY_VALUE, EMPTY_VALUE);

//--- Set the accuracy of the indicator
   IndicatorSetInteger(INDICATOR_DIGITS, Digits());

//--- Set the indicator short name
   IndicatorSetString(INDICATOR_SHORTNAME, StringFormat("Anchored VWAP, %s, %s", GetVwapTypeString(InpVwapType), GetAppliedPriceString(InpAppliedPrice)));

//--- Initialize the global variables
   gblShouldRecalc   = false;
   gblAncTime        = InpAncTime;

//--- Draw the anchor line
   DrawAnchorLine();
   return(INIT_SUCCEEDED);
  }

//+------------------------------------------------------------------+
//| Custom indicator deinitialization function                       |
//+------------------------------------------------------------------+
void  OnDeinit(const int  reason)
  {
   ObjectDelete(ChartID(), AnchorLineName);
  }

//+------------------------------------------------------------------+
//| Custom indicator iteration function                              |
//+------------------------------------------------------------------+
int OnCalculate(const int32_t rates_total,
                const int32_t prev_calculated,
                const datetime &time[],
                const double &open[],
                const double &high[],
                const double &low[],
                const double &close[],
                const long &tick_volume[],
                const long &volume[],
                const int32_t &spread[])
  {
//--- Insufficient number of bars for calculation
   if(rates_total < 1)
      return 0;

//--- Set the value of the start index
   int startIdx;
   if(prev_calculated == 0)
      startIdx = 0;
   else
      startIdx = prev_calculated - 1;

//--- Recalculate if anchor line is dragged
   if(gblShouldRecalc)
     {
      startIdx = 0;
      gblShouldRecalc = false;
     }

//--- Master loop
   for(int i = startIdx; i < rates_total; i++)
     {
      datetime nextAnchor = GetNextAnchor(gblAncTime, time[i]);

      //--- Empty values for dates before the anchor time
      if(nextAnchor == 0)
        {
         vwapBuffer[i]  = EMPTY_VALUE;
         upperBuffer[i] = EMPTY_VALUE;
         lowerBuffer[i] = EMPTY_VALUE;
         pvBuffer[i]    = 0.0;
         vBuffer[i]     = 0.0;
         p2vBuffer[i]   = 0.0;
         continue;
        }

      //--- Get price and volume values for calculation
      double price = GetAppliedPrice(i, open, high, low, close);
      double vol   = GetVolume(i, volume, tick_volume);

      //--- Assign values to calculation buffers
      if(i == 0 || (nextAnchor != GetNextAnchor(gblAncTime, time[i-1])))
        {
         //--- Initialize buffers at session anchors
         vBuffer[i]     = vol;
         pvBuffer[i]    = price * vol;
         p2vBuffer[i]   = price * price * vol;
        }
      else
        {
         //--- Cumulative sum of buffers
         vBuffer[i]     = vBuffer[i-1] + vol;
         pvBuffer[i]    = pvBuffer[i-1] + price * vol;
         p2vBuffer[i]   = p2vBuffer[i-1] + price * price * vol;
        }

      //--- Assign values to the indicator buffers
      vwapBuffer[i]  = pvBuffer[i] / vBuffer[i];
      if(InpShouldShowBands)
        {
         double var = p2vBuffer[i] / vBuffer[i] - MathPow(vwapBuffer[i], 2);
         double sd  = MathSqrt(var);
         upperBuffer[i] = vwapBuffer[i] + InpBandMultiplier * sd;
         lowerBuffer[i] = vwapBuffer[i] - InpBandMultiplier * sd;
        }
      else
        {
         upperBuffer[i] = EMPTY_VALUE;
         lowerBuffer[i] = EMPTY_VALUE;
        }
     }

   return rates_total;
  }

//+------------------------------------------------------------------+
//| ChartEvent function                                              |
//+------------------------------------------------------------------+
void OnChartEvent(const int32_t id,
                  const long &lparam,
                  const double &dparam,
                  const string &sparam)
  {
   if(!InpIsAnchorLineDrag)
      return;

//--- Verify if the chart event relates to the anchor line
   if(id != CHARTEVENT_OBJECT_DRAG)
      return;
   if(sparam != AnchorLineName)
      return;

//--- Update the values of the global variables.
   gblAncTime = (datetime) ObjectGetInteger(ChartID(), AnchorLineName, OBJPROP_TIME);
   gblShouldRecalc = true;
  }

//+------------------------------------------------------------------+
//| Returns the applied price for the idx index position             |
//+------------------------------------------------------------------+
double GetAppliedPrice(int idx, const double &open[], const double &high[], const double &low[], const double &close[])
  {
   switch(InpAppliedPrice)
     {
      case applied_price_open:
         return open[idx];
      case applied_price_high:
         return high[idx];
      case applied_price_low:
         return low[idx];
      case applied_price_close:
         return close[idx];
      case applied_price_median:
         return (high[idx] + low[idx])/2;
      case applied_price_typical:
         return (high[idx] + low[idx]  + close[idx])/3;
      case applied_price_weighted:
         return (high[idx] + low[idx]  + close[idx] + close[idx])/4;
      case applied_price_average:
         return (open[idx] + high[idx] + low[idx]   + close[idx])/4;
      default:
         return (high[idx] + low[idx]  + close[idx])/3;
     }
  }

//+------------------------------------------------------------------+
//| Returns the volume for the idx index position                    |
//+------------------------------------------------------------------+
double GetVolume(int idx, const long &volume[], const long &tick_volume[])
  {
   if(volume[idx] > 0)
      return (double) volume[idx];
   return (double) tick_volume[idx];
  }

//+------------------------------------------------------------------+
//| Returns the anchor time next to curTime starting from ancTime    |
//+------------------------------------------------------------------+
datetime GetNextAnchor(datetime ancTime, datetime curTime)
  {
   if(curTime < ancTime)
      return 0;

//--- Return the maximum value of long for fixed vwap mode
   if(InpVwapType == vwap_fixed)
      return LONG_MAX;

   int secondsPerDay   = 86400;  // Seconds in a day
   int minDaysPerMonth = 28;     // February

   if(InpSessionType == session_month)
     {
      CDateTime dateOp;
      dateOp.DateTime(ancTime);
      //--- Approximate the month using least days in a month
      int monthsElapsed = (int)((curTime-ancTime) / (secondsPerDay*minDaysPerMonth));

      //--- Loop until date exceeds current time
      if(monthsElapsed > 1)
         dateOp.MonInc(monthsElapsed-1);    // Subtract one extra month for safe approximation
      while(dateOp.DateTime() <= curTime)
         dateOp.MonInc(1);
      return dateOp.DateTime();
     }

//--- Calculate seconds per session
   int secondsPerSession;
   switch(InpSessionType)
     {
      case session_day:
         secondsPerSession = secondsPerDay;
         break;
      case session_week:
         secondsPerSession = secondsPerDay * 7;
         break;
      default:
         secondsPerSession = secondsPerDay;
         break;
     }

//--- Add one to elapsed units to round up datetime to the next session
   long elapsed = (long)(curTime - ancTime);
   long units   = elapsed / secondsPerSession;
   return (datetime)(ancTime + (long)((units+1) * secondsPerSession));
  }

//+------------------------------------------------------------------+
//| Draws the anchor line                                            |
//+------------------------------------------------------------------+
void DrawAnchorLine()
  {
   long chartId   = ChartID();
   int  subWindow = 0; // Main chart

//--- Create the anchor line
   ObjectCreate(chartId, AnchorLineName, OBJ_VLINE, subWindow, gblAncTime, 0); // OBJ_VLINE has no price coordinate

//--- Set anchor line display properties
   ObjectSetInteger(chartId, AnchorLineName, OBJPROP_COLOR, InpAnchorLineColor);
   ObjectSetInteger(chartId, AnchorLineName, OBJPROP_STYLE, InpAnchorLineStyle);

//--- Set anchor line label and enable display
   ObjectSetString(chartId,  AnchorLineName, OBJPROP_TEXT, AnchorLineLabel);
   ChartSetInteger(chartId,  CHART_SHOW_OBJECT_DESCR, true);

//--- Make the anchor line selectable
   if(InpIsAnchorLineDrag)
     {
      ObjectSetInteger(chartId, AnchorLineName, OBJPROP_SELECTABLE,  true);
      ObjectSetInteger(chartId, AnchorLineName, OBJPROP_SELECTED,    true);
     }
  }

//+------------------------------------------------------------------+
//| Returns string representation of enum VwapType                   |
//+------------------------------------------------------------------+
string GetVwapTypeString(VwapType vwapType)
  {
   switch(vwapType)
     {
      case vwap_reset:
         return "Session";
      case vwap_fixed:
         return "Fixed";
      default:
         return "Session";
     }
  }

//+------------------------------------------------------------------+
//| Returns string representation of enum AppliedPriceType           |
//+------------------------------------------------------------------+
string GetAppliedPriceString(AppliedPriceType appPrice)
  {
   switch(appPrice)
     {
      case applied_price_open:
         return "Open";
      case applied_price_high:
         return "High";
      case applied_price_low:
         return "Low";
      case applied_price_close:
         return "Close";
      case applied_price_median:
         return "Median HL/2";
      case applied_price_typical:
         return "Typical HLC/3";
      case applied_price_weighted:
         return "Weighted HLCC/4";
      case applied_price_average:
         return "Average OHLC/4";
      default:
         return "Typical HLC/3";
     }
  }
//+------------------------------------------------------------------+
Conclusion
This article presented a complete step-by-step implementation of an Anchored VWAP indicator in MQL5, progressing from the mathematical foundation through buffer management, event handling, and core calculation logic. The deliverable supports fixed and session reset modes through a unified stateless calculation loop with O(1) boundary detection, optional standard deviation bands, a real-time draggable anchor line, transparent volume handling across asset classes, and safe multi-instance chart support through unique ID-based collision detection. Use the indicator as an all-in-one tool for execution benchmarking, technical trading, and accumulative analysis, and expand its utility further through multi-anchor and multi-instrument setups. The source code is attached as a downloadable .mq5 file.
Warning: All rights to these materials are reserved by MetaQuotes Ltd. Copying or reprinting of these materials in whole or in part is prohibited.
This article was written by a user of the site and reflects their personal views. MetaQuotes Ltd is not responsible for the accuracy of the information presented, nor for any consequences resulting from the use of the solutions, strategies or recommendations described.

 Integrating MQL5 with Data Processing Packages (Part 10): Deploying Python AutoML Pipelines for Strategy Testing
 Neural Networks in Trading: A Cross-Domain Time Series Forecasting Framework (Conclusion)
 Feature Engineering for ML (Part 11): Fractal Features in Python
 Generating a Per-Symbol Trade Analytics PDF Report from MQL5

- Free trading apps
- Over 8,000 signals for copying
- Economic news for exploring financial markets
You agree to website policy and terms of use
Very nice one!
This is the only free source code anchored VWAP with a moveable anchor time for MT5 that actually works.
I might even add 2 more up and down, respectively, standard deviation stepped bands─to make it more like my own anchored VWAP indicator.