Examples of Working with the Chart

This section contains examples of working with chart properties. One or two complete functions are displayed for each property. These functions allow setting/receiving the value of the property. These functions can be used "as is" in custom mql5 applications.

The screenshot below demonstrates the graphic panel illustrating how changing of the chart property changes its appearance. Clicking Next button allows setting the new value of the appropriate property and view the changes in the chart window.

chart_properties_panel

The panel's source code is located below.

Chart Properties and Sample Functions for Working with Them

  • CHART_IS_OBJECT defines if an object is a real chart or a graphic object.

//+------------------------------------------------------------------+
//| Checks if an object is a chart. If it is a graphic object,       |
//| the result is true. If it is a real chart, the result variable   |
//| has the value of false.                                          |
//+------------------------------------------------------------------+
bool ChartIsObject(bool &result,const long chart_ID=0)
  {
//--- prepare the variable to get the property value
   long value;
//--- reset the error value
   ResetLastError();
//--- get the chart property
   if(!ChartGetInteger(chart_ID,CHART_IS_OBJECT,0,value))
     {
      //--- display the error message in Experts journal
      Print(__FUNCTION__+", Error Code = ",GetLastError());
      //--- return false
      return(false);
     }
//--- store the value of the chart property in memory
   result=value;
//--- successful execution
   return(true);
  }


  • CHART_BRING_TO_TOP shows the chart on top of all others.

//+----------------------------------------------------------------------+
//| Sends command to the terminal to display the chart above all others  |
//+----------------------------------------------------------------------+
bool ChartBringToTop(const long chart_ID=0)
  {
//--- reset the error value
   ResetLastError();
//--- show the chart on top of all others
   if(!ChartSetInteger(chart_ID,CHART_BRING_TO_TOP,0,true))
     {
      //--- display the error message in Experts journal
      Print(__FUNCTION__+", Error Code = ",GetLastError());
      return(false);
     }
//--- successful execution
   return(true);
  }


  • CHART_MOUSE_SCROLL is a property for scrolling the chart using left mouse button.

//+--------------------------------------------------------------------------+
//| Checks if scrolling of chart using left mouse button is enabled          |
//+--------------------------------------------------------------------------+
bool ChartMouseScrollGet(bool &result,const long chart_ID=0)
  {
//--- prepare the variable to get the property value
   long value;
//--- reset the error value
   ResetLastError();
//--- receive the property value
   if(!ChartGetInteger(chart_ID,CHART_MOUSE_SCROLL,0,value))
     {
      //--- display the error message in Experts journal
      Print(__FUNCTION__+", Error Code = ",GetLastError());
      return(false);
     }
//--- store the value of the chart property in memory
   result=value;
//--- successful execution
   return(true);
  }
//+--------------------------------------------------------------------+
//| Enables/disables scrolling of chart using left mouse button        |
//+--------------------------------------------------------------------+
bool ChartMouseScrollSet(const bool value,const long chart_ID=0)
  {
//--- reset the error value
   ResetLastError();
//--- set property value
   if(!ChartSetInteger(chart_ID,CHART_MOUSE_SCROLL,0,value))
     {
      //--- display the error message in Experts journal
      Print(__FUNCTION__+", Error Code = ",GetLastError());
      return(false);
     }
//--- successful execution
   return(true);
  }


  • CHART_EVENT_MOUSE_MOVE is a property of sending messages concerning move events and mouse clicks to mql5 applications (CHARTEVENT_MOUSE_MOVE).

//+------------------------------------------------------------------+
//| Checks if messages concerning move events and mouse clicks       |
//| are sent to all MQL5 applications on the chart                   |
//+------------------------------------------------------------------+
bool ChartEventMouseMoveGet(bool &result,const long chart_ID=0)
  {
//--- prepare the variable to get the property value
   long value;
//--- reset the error value
   ResetLastError();
//--- receive the property value
   if(!ChartGetInteger(chart_ID,CHART_EVENT_MOUSE_MOVE,0,value))
     {
      //--- display the error message in Experts journal
      Print(__FUNCTION__+", Error Code = ",GetLastError());
      return(false);
     }
//--- store the value of the chart property in memory
   result=value;
//--- successful execution
   return(true);
  }
//+------------------------------------------------------------------------------+
//| Enables/disables the mode of sending messages concerning move events and     |
//| mouse clicks to MQL5 applications on the chart                               |
//+------------------------------------------------------------------------------+
bool ChartEventMouseMoveSet(const bool value,const long chart_ID=0)
  {
//--- reset the error value
   ResetLastError();
//--- set property value
   if(!ChartSetInteger(chart_ID,CHART_EVENT_MOUSE_MOVE,0,value))
     {
      //--- display the error message in Experts journal
      Print(__FUNCTION__+", Error Code = ",GetLastError());
      return(false);
     }
//--- successful execution
   return(true);
  }


  • CHART_EVENT_OBJECT_CREATE is a property of sending messages concerning the event of a graphic object creation to mql5 applications (CHARTEVENT_OBJECT_CREATE).

//+---------------------------------------------------------------------+
//| Checks if messages concerning the event of a graphic                |
//| object creation are sent to all MQL5 applications on the chart      |
//+---------------------------------------------------------------------+
bool ChartEventObjectCreateGet(bool &result,const long chart_ID=0)
  {
//--- prepare the variable to get the property value
   long value;
//--- reset the error value
   ResetLastError();
//--- receive the property value
   if(!ChartGetInteger(chart_ID,CHART_EVENT_OBJECT_CREATE,0,value))
     {
      //--- display the error message in Experts journal
      Print(__FUNCTION__+", Error Code = ",GetLastError());
      return(false);
     }
//--- store the value of the chart property in memory
   result=value;
//--- successful execution
   return(true);
  }
//+--------------------------------------------------------------------------+
//| Enables/disables the mode of sending messages concerning the event of a  |
//| graphic object creation to all mql5 applications on the chart            |
//+--------------------------------------------------------------------------+
bool ChartEventObjectCreateSet(const bool value,const long chart_ID=0)
  {
//--- reset the error value
   ResetLastError();
//--- set property value
   if(!ChartSetInteger(chart_ID,CHART_EVENT_OBJECT_CREATE,0,value))
     {
      //--- display the error message in Experts journal
      Print(__FUNCTION__+", Error Code = ",GetLastError());
      return(false);
     }
//--- successful execution
   return(true);
  }


  • CHART_EVENT_OBJECT_DELETE is a property of sending messages concerning the event of a graphic object deletion to mql5 applications (CHARTEVENT_OBJECT_DELETE).

//+---------------------------------------------------------------------+
//| Checks if messages concerning the event of a graphic object         |
//| deletion are sent to all mql5 applications on the chart             |
//+---------------------------------------------------------------------+
bool ChartEventObjectDeleteGet(bool &result,const long chart_ID=0)
  {
//--- prepare the variable to get the property value
   long value;
//--- reset the error value
   ResetLastError();
//--- receive the property value
   if(!ChartGetInteger(chart_ID,CHART_EVENT_OBJECT_DELETE,0,value))
     {
      //--- display the error message in Experts journal
      Print(__FUNCTION__+", Error Code = ",GetLastError());
      return(false);
     }
//--- store the value of the chart property in memory
   result=value;
//--- successful execution
   return(true);
  }
//+--------------------------------------------------------------------------+
//| Enables/disables the mode of sending messages concerning the event of a  |
//| graphic object deletion to all mql5 applications on the chart            |
//+--------------------------------------------------------------------------+
bool ChartEventObjectDeleteSet(const bool value,const long chart_ID=0)
  {
//--- reset the error value
   ResetLastError();
//--- set property value
   if(!ChartSetInteger(chart_ID,CHART_EVENT_OBJECT_DELETE,0,value))
     {
      //--- display the error message in Experts journal
      Print(__FUNCTION__+", Error Code = ",GetLastError());
      return(false);
     }
//--- successful execution
   return(true);
  }


  • CHART_MODE type of the chart (candlesticks, bars or line).

//+------------------------------------------------------------------+
//| Gets chart display type (candlesticks, bars or line)             |
//+------------------------------------------------------------------+
ENUM_CHART_MODE ChartModeGet(const long chart_ID=0)
  {
//--- prepare the variable to get the property value
   long result=WRONG_VALUE;
//--- reset the error value
   ResetLastError();
//--- receive the property value
   if(!ChartGetInteger(chart_ID,CHART_MODE,0,result))
     {
      //--- display the error message in Experts journal
      Print(__FUNCTION__+", Error Code = ",GetLastError());
     }
//--- return the value of the chart property
   return((ENUM_CHART_MODE)result);
  }
//+------------------------------------------------------------------+
//| Sets chart display type (candlesticks, bars or line)             |
//+------------------------------------------------------------------+
bool ChartModeSet(const long value,const long chart_ID=0)
  {
//--- reset the error value
   ResetLastError();
//--- set property value
   if(!ChartSetInteger(chart_ID,CHART_MODE,value))
     {
      //--- display the error message in Experts journal
      Print(__FUNCTION__+", Error Code = ",GetLastError());
      return(false);
     }
//--- successful execution
   return(true);
  }


  • CHART_FOREGROUND is a property of displaying a price chart in the foreground.

//+------------------------------------------------------------------+
//| Checks if a price chart is displayed in the foreground           |
//+------------------------------------------------------------------+
bool ChartForegroundGet(bool &result,const long chart_ID=0)
  {
//--- prepare the variable to get the property value
   long value;
//--- reset the error value
   ResetLastError();
//--- receive the property value
   if(!ChartGetInteger(chart_ID,CHART_FOREGROUND,0,value))
     {
      //--- display the error message in Experts journal
      Print(__FUNCTION__+", Error Code = ",GetLastError());
      return(false);
     }
//--- store the value of the chart property in memory
   result=value;
//--- successful execution
   return(true);
  }
//+------------------------------------------------------------------+
//| Enables/disables displaying of a price chart on the foreground   |
//+------------------------------------------------------------------+
bool ChartForegroundSet(const bool value,const long chart_ID=0)
  {
//--- reset the error value
   ResetLastError();
//--- set property value
   if(!ChartSetInteger(chart_ID,CHART_FOREGROUND,0,value))
     {
      //--- display the error message in Experts journal
      Print(__FUNCTION__+", Error Code = ",GetLastError());
      return(false);
     }
//--- successful execution
   return(true);
  }


  • CHART_SHIFT mode of shift of the price chart from the right border.

//+-------------------------------------------------------------------+
//| Checks if shifting a price chart from the right border is enabled |
//+-------------------------------------------------------------------+
bool ChartShiftGet(bool &result,const long chart_ID=0)
  {
//--- prepare the variable to get the property value
   long value;
//--- reset the error value
   ResetLastError();
//--- receive the property value
   if(!ChartGetInteger(chart_ID,CHART_SHIFT,0,value))
     {
      //--- display the error message in Experts journal
      Print(__FUNCTION__+", Error Code = ",GetLastError());
      return(false);
     }
//--- store the value of the chart property in memory
   result=value;
//--- successful execution
   return(true);
  }
//+---------------------------------------------------------------------------------+
//| Enables/disables displaying of a price chart with a shift from the right border |
//+---------------------------------------------------------------------------------+
bool ChartShiftSet(const bool value,const long chart_ID=0)
  {
//--- reset the error value
   ResetLastError();
//--- set property value
   if(!ChartSetInteger(chart_ID,CHART_SHIFT,0,value))
     {
      //--- display the error message in Experts journal
      Print(__FUNCTION__+", Error Code = ",GetLastError());
      return(false);
     }
//--- successful execution
   return(true);
  }


  • CHART_AUTOSCROLL the mode of automatic shift to the right border of the chart.

//+------------------------------------------------------------------+
//| Checks if automatic scrolling of a chart to the right            |
//| on new ticks arrival is enabled                                  |
//+------------------------------------------------------------------+
bool ChartAutoscrollGet(bool &result,const long chart_ID=0)
  {
//--- prepare the variable to get the property value
   long value;
//--- reset the error value
   ResetLastError();
//--- receive the property value
   if(!ChartGetInteger(chart_ID,CHART_AUTOSCROLL,0,value))
     {
      //--- display the error message in Experts journal
      Print(__FUNCTION__+", Error Code = ",GetLastError());
      return(false);
     }
//--- store the value of the chart property in memory
   result=value;
//--- successful execution
   return(true);
  }
//+------------------------------------------------------------------+
//| Enables/disables automatic scrolling of a chart to the right     |
//| on new ticks arrival                                             |
//+------------------------------------------------------------------+
bool ChartAutoscrollSet(const bool value,const long chart_ID=0)
  {
//--- reset the error value
   ResetLastError();
//--- set property value
   if(!ChartSetInteger(chart_ID,CHART_AUTOSCROLL,0,value))
     {
      //--- display the error message in Experts journal
      Print(__FUNCTION__+", Error Code = ",GetLastError());
      return(false);
     }
//--- successful execution
   return(true);
  }


  • CHART_SCALE chart scale property.

//+------------------------------------------------------------------+
//| Gets chart scale (from 0 to 5)                                   |
//+------------------------------------------------------------------+
int ChartScaleGet(const long chart_ID=0)
  {
//--- prepare the variable to get the property value
   long result=-1;
//--- reset the error value
   ResetLastError();
//--- receive the property value
   if(!ChartGetInteger(chart_ID,CHART_SCALE,0,result))
     {
      //--- display the error message in Experts journal
      Print(__FUNCTION__+", Error Code = ",GetLastError());
     }
//--- return the value of the chart property
   return((int)result);
  }
//+------------------------------------------------------------------+
//| Sets chart scale (from 0 to 5)                                   |
//+------------------------------------------------------------------+
bool ChartScaleSet(const long value,const long chart_ID=0)
  {
//--- reset the error value
   ResetLastError();
//--- set property value
   if(!ChartSetInteger(chart_ID,CHART_SCALE,0,value))
     {
      //--- display the error message in Experts journal
      Print(__FUNCTION__+", Error Code = ",GetLastError());
      return(false);
     }
//--- successful execution
   return(true);
  }


  • CHART_SCALEFIX the mode of fixed chart scale.

//+------------------------------------------------------------------+
//| Checks if the fixed scale mode is enabled                        |
//+------------------------------------------------------------------+
bool ChartScaleFixGet(bool &result,const long chart_ID=0)
  {
//--- prepare the variable to get the property value
   long value;
//--- reset the error value
   ResetLastError();
//--- receive the property value
   if(!ChartGetInteger(chart_ID,CHART_SCALEFIX,0,value))
     {
      //--- display the error message in Experts journal
      Print(__FUNCTION__+", Error Code = ",GetLastError());
      return(false);
     }
//--- store the value of the chart property in memory
   result=value;
//--- successful execution
   return(true);
  }
//+------------------------------------------------------------------+
//| Enables/disables the fixed scale mode                            |
//+------------------------------------------------------------------+
bool ChartScaleFixSet(const bool value,const long chart_ID=0)
  {
//--- reset the error value
   ResetLastError();
//--- set property value
   if(!ChartSetInteger(chart_ID,CHART_SCALEFIX,0,value))
     {
      //--- display the error message in Experts journal
      Print(__FUNCTION__+", Error Code = ",GetLastError());
      return(false);
     }
//--- successful execution
   return(true);
  }


  • CHART_SCALEFIX_11 1:1 chart scale mode.

//+------------------------------------------------------------------+
//| Checks if the "1:1" scale is enabled                             |
//+------------------------------------------------------------------+
bool ChartScaleFix11Get(bool &result,const long chart_ID=0)
  {
//--- prepare the variable to get the property value
   long value;
//--- reset the error value
   ResetLastError();
//--- receive the property value
   if(!ChartGetInteger(chart_ID,CHART_SCALEFIX_11,0,value))
     {
      //--- display the error message in Experts journal
      Print(__FUNCTION__+", Error Code = ",GetLastError());
      return(false);
     }
//--- store the value of the chart property in memory
   result=value;
//--- successful execution
   return(true);
  }
//+------------------------------------------------------------------+
//| Enables/disables the "1:1" scale mode                            |
//+------------------------------------------------------------------+
bool ChartScaleFix11Set(const bool value,const long chart_ID=0)
  {
//--- reset the error value
   ResetLastError();
//--- set property value
   if(!ChartSetInteger(chart_ID,CHART_SCALEFIX_11,0,value))
     {
      //--- display the error message in Experts journal
      Print(__FUNCTION__+", Error Code = ",GetLastError());
      return(false);
     }
//--- successful execution
   return(true);
  }


  • CHART_SCALE_PT_PER_BAR the mode of specifying the chart scale in points per bar.

//+------------------------------------------------------------------+
//| Checks if the "points per bar" chart scaling mode is enabled     |
//+------------------------------------------------------------------+
bool ChartScalePerBarGet(bool &result,const long chart_ID=0)
  {
//--- prepare the variable to get the property value
   long value;
//--- reset the error value
   ResetLastError();
//--- receive the property value
   if(!ChartGetInteger(chart_ID,CHART_SCALE_PT_PER_BAR,0,value))
     {
      //--- display the error message in Experts journal
      Print(__FUNCTION__+", Error Code = ",GetLastError());
      return(false);
     }
//--- store the value of the chart property in memory
   result=value;
//--- successful execution
   return(true);
  }
//+------------------------------------------------------------------+
//| Enables/disables the "points per bar" chart scaling mode         |
//+------------------------------------------------------------------+
bool ChartScalePerBarSet(const bool value,const long chart_ID=0)
  {
//--- reset the error value
   ResetLastError();
//--- set property value
   if(!ChartSetInteger(chart_ID,CHART_SCALE_PT_PER_BAR,0,value))
     {
      //--- display the error message in Experts journal
      Print(__FUNCTION__+", Error Code = ",GetLastError());
      return(false);
     }
//--- successful execution
   return(true);
  }


  • CHART_SHOW_OHLC the property of displaying OHLC values in the upper left corner.

//+----------------------------------------------------------------------------------+
//| Checks if displaying of OHLC values in the upper left corner of chart is enabled |
//+----------------------------------------------------------------------------------+
bool ChartShowOHLCGet(bool &result,const long chart_ID=0)
  {
//--- prepare the variable to get the property value
   long value;
//--- reset the error value
   ResetLastError();
//--- receive the property value
   if(!ChartGetInteger(chart_ID,CHART_SHOW_OHLC,0,value))
     {
      //--- display the error message in Experts journal
      Print(__FUNCTION__+", Error Code = ",GetLastError());
      return(false);
     }
//--- store the value of the chart property in memory
   result=value;
//--- successful execution
   return(true);
  }
//+------------------------------------------------------------------------------+
//| Enables/disables displaying of OHLC values in the upper left corner of chart |
//+------------------------------------------------------------------------------+
bool ChartShowOHLCSet(const bool value,const long chart_ID=0)
  {
//--- reset the error value
   ResetLastError();
//--- set property value
   if(!ChartSetInteger(chart_ID,CHART_SHOW_OHLC,0,value))
     {
      //--- display the error message in Experts journal
      Print(__FUNCTION__+", Error Code = ",GetLastError());
      return(false);
     }
//--- successful execution
   return(true);
  }


  • CHART_SHOW_BID_LINE the property of displaying Bid value as a horizontal line on the chart.

//+------------------------------------------------------------------+
//| Checks if displaying of Bid line on chart is enabled             |
//+------------------------------------------------------------------+
bool ChartShowBidLineGet(bool &result,const long chart_ID=0)
  {
//--- prepare the variable to get the property value
   long value;
//--- reset the error value
   ResetLastError();
//--- receive the property value
   if(!ChartGetInteger(chart_ID,CHART_SHOW_BID_LINE,0,value))
     {
      //--- display the error message in Experts journal
      Print(__FUNCTION__+", Error Code = ",GetLastError());
      return(false);
     }
//--- store the value of the chart property in memory
   result=value;
//--- successful execution
   return(true);
  }
//+------------------------------------------------------------------+
//| Enables/disables displaying of Bid line on chart                 |
//+------------------------------------------------------------------+
bool ChartShowBidLineSet(const bool value,const long chart_ID=0)
  {
//--- reset the error value
   ResetLastError();
//--- set property value
   if(!ChartSetInteger(chart_ID,CHART_SHOW_BID_LINE,0,value))
     {
      //--- display the error message in Experts journal
      Print(__FUNCTION__+", Error Code = ",GetLastError());
      return(false);
     }
//--- successful execution
   return(true);
  }


  • CHART_SHOW_ASK_LINE the property of displaying Ask value as a horizontal line on a chart.

//+------------------------------------------------------------------+
//| Checks if displaying of Ask line on chart is enabled             |
//+------------------------------------------------------------------+
bool ChartShowAskLineGet(bool &result,const long chart_ID=0)
  {
//--- prepare the variable to get the property value
   long value;
//--- reset the error value
   ResetLastError();
//--- receive the property value
   if(!ChartGetInteger(chart_ID,CHART_SHOW_ASK_LINE,0,value))
     {
      //--- display the error message in Experts journal
      Print(__FUNCTION__+", Error Code = ",GetLastError());
      return(false);
     }
//--- store the value of the chart property in memory
   result=value;
//--- successful execution
   return(true);
  }
//+------------------------------------------------------------------+
//| Enables/disables displaying of Ask line on chart                 |
//+------------------------------------------------------------------+
bool ChartShowAskLineSet(const bool value,const long chart_ID=0)
  {
//--- reset the error value
   ResetLastError();
//--- set property value
   if(!ChartSetInteger(chart_ID,CHART_SHOW_ASK_LINE,0,value))
     {
      //--- display the error message in Experts journal
      Print(__FUNCTION__+", Error Code = ",GetLastError());
      return(false);
     }
//--- successful execution
   return(true);
  }


  • CHART_SHOW_LAST_LINE the property of displaying Last value as a horizontal line on a chart.

//+-----------------------------------------------------------------------------+
//| Checks if displaying of line for the last performed deal's price is enabled |
//+-----------------------------------------------------------------------------+
bool ChartShowLastLineGet(bool &result,const long chart_ID=0)
  {
//--- prepare the variable to get the property value
   long value;
//--- reset the error value
   ResetLastError();
//--- receive the property value
   if(!ChartGetInteger(chart_ID,CHART_SHOW_LAST_LINE,0,value))
     {
      //--- display the error message in Experts journal
      Print(__FUNCTION__+", Error Code = ",GetLastError());
      return(false);
     }
//--- store the value of the chart property in memory
   result=value;
//--- successful execution
   return(true);
  }
//+-------------------------------------------------------------------------+
//| Enables/disables displaying of line for the last performed deal's price |
//+-------------------------------------------------------------------------+
bool ChartShowLastLineSet(const bool value,const long chart_ID=0)
  {
//--- reset the error value
   ResetLastError();
//--- set property value
   if(!ChartSetInteger(chart_ID,CHART_SHOW_LAST_LINE,0,value))
     {
      //--- display the error message in Experts journal
      Print(__FUNCTION__+", Error Code = ",GetLastError());
      return(false);
     }
//--- successful execution
   return(true);
  }


  • CHART_SHOW_PERIOD_SEP the property of displaying vertical separators between adjacent periods.

//+---------------------------------------------------------------------------------+
//| Checks if displaying of vertical separators between adjacent periods is enabled |
//+---------------------------------------------------------------------------------+
bool ChartShowPeriodSeparatorGet(bool &result,const long chart_ID=0)
  {
//--- prepare the variable to get the property value
   long value;
//--- reset the error value
   ResetLastError();
//--- receive the property value
   if(!ChartGetInteger(chart_ID,CHART_SHOW_PERIOD_SEP,0,value))
     {
      //--- display the error message in Experts journal
      Print(__FUNCTION__+", Error Code = ",GetLastError());
      return(false);
     }
//--- store the value of the chart property in memory
   result=value;
//--- successful execution
   return(true);
  }
//+-----------------------------------------------------------------------------+
//| Enables/disables displaying of vertical separators between adjacent periods |
//+-----------------------------------------------------------------------------+
bool ChartShowPeriodSepapatorSet(const bool value,const long chart_ID=0)
  {
//--- reset the error value
   ResetLastError();
//--- set property value
   if(!ChartSetInteger(chart_ID,CHART_SHOW_PERIOD_SEP,0,value))
     {
      //--- display the error message in Experts journal
      Print(__FUNCTION__+", Error Code = ",GetLastError());
      return(false);
     }
//--- successful execution
   return(true);
  }


  • CHART_SHOW_GRID the property of displaying the chart grid.

//+------------------------------------------------------------------+
//| Checks if the chart grid is displayed                            |
//+------------------------------------------------------------------+
bool ChartShowGridGet(bool &result,const long chart_ID=0)
  {
//--- prepare the variable to get the property value
   long value;
//--- reset the error value
   ResetLastError();
//--- receive the property value
   if(!ChartGetInteger(chart_ID,CHART_SHOW_GRID,0,value))
     {
      //--- display the error message in Experts journal
      Print(__FUNCTION__+", Error Code = ",GetLastError());
      return(false);
     }
//--- store the value of the chart property in memory
   result=value;
//--- successful execution
   return(true);
  }
//+------------------------------------------------------------------+
//| Enables/disables displaying of grid on chart                     |
//+------------------------------------------------------------------+
bool ChartShowGridSet(const bool value,const long chart_ID=0)
  {
//--- reset the error value
   ResetLastError();
//--- set the property value
   if(!ChartSetInteger(chart_ID,CHART_SHOW_GRID,0,value))
     {
      //--- display the error message in Experts journal
      Print(__FUNCTION__+", Error Code = ",GetLastError());
      return(false);
     }
//--- successful execution
   return(true);
  }


  • CHART_SHOW_VOLUMES the property of displaying the volumes on a chart.

//+------------------------------------------------------------------+
//| Checks if volumes are displayed on a chart                       |
//| The flag indicates the volumes showing mode                      |
//+------------------------------------------------------------------+
ENUM_CHART_VOLUME_MODE ChartShowVolumesGet(const long chart_ID=0)
  {
//--- prepare the variable to get the property value
   long result=WRONG_VALUE;
//--- reset the error value
   ResetLastError();
//--- receive the property value
   if(!ChartGetInteger(chart_ID,CHART_SHOW_VOLUMES,0,result))
     {
      //--- display the error message in Experts journal
      Print(__FUNCTION__+", Error Code = ",GetLastError());
     }
//--- return the value of the chart property
   return((ENUM_CHART_VOLUME_MODE)result);
  }
//+------------------------------------------------------------------+
//| Sets mode of displaying volumes on chart                         |
//+------------------------------------------------------------------+
bool ChartShowVolumesSet(const long value,const long chart_ID=0)
  {
//--- reset the error value
   ResetLastError();
//--- set property value
   if(!ChartSetInteger(chart_ID,CHART_SHOW_VOLUMES,value))
     {
      //--- display the error message in Experts journal
      Print(__FUNCTION__+", Error Code = ",GetLastError());
      return(false);
     }
//--- successful execution
   return(true);
  }


  • CHART_SHOW_OBJECT_DESCR the property of graphical object pop-up descriptions.

//+-------------------------------------------------------------------+
//| Checks if pop-up descriptions of graphical objects are displayed  |
//| when hovering mouse over them                                     |
//+-------------------------------------------------------------------+
bool ChartShowObjectDescriptionGet(bool &result,const long chart_ID=0)
  {
//--- prepare the variable to get the property value
   long value;
//--- reset the error value
   ResetLastError();
//--- receive the property value
   if(!ChartGetInteger(chart_ID,CHART_SHOW_OBJECT_DESCR,0,value))
     {
      //--- display the error message in Experts journal
      Print(__FUNCTION__+", Error Code = ",GetLastError());
      return(false);
     }
//--- store the value of the chart property in memory
   result=value;
//--- successful execution
   return(true);
  }
//+-------------------------------------------------------------------------+
//| Enables/disables displaying of pop-up descriptions of graphical objects |
//| when hovering mouse over them                                           |
//+-------------------------------------------------------------------------+
bool ChartShowObjectDescriptionSet(const bool value,const long chart_ID=0)
  {
//--- reset the error value
   ResetLastError();
//--- set property value
   if(!ChartSetInteger(chart_ID,CHART_SHOW_OBJECT_DESCR,0,value))
     {
      //--- display the error message in Experts journal
      Print(__FUNCTION__+", Error Code = ",GetLastError());
      return(false);
     }
//--- successful execution
   return(true);
  }


  • CHART_VISIBLE_BARS defines the number of bars on a chart that are available for display.

//+----------------------------------------------------------------------+
//| Gets the number of bars that are displayed (visible) in chart window |
//+----------------------------------------------------------------------+
int ChartVisibleBars(const long chart_ID=0)
  {
//--- prepare the variable to get the property value
   long result=-1;
//--- reset the error value
   ResetLastError();
//--- receive the property value
   if(!ChartGetInteger(chart_ID,CHART_VISIBLE_BARS,0,result))
     {
      //--- display the error message in Experts journal
      Print(__FUNCTION__+", Error Code = ",GetLastError());
     }
//--- return the value of the chart property
   return((int)result);
  }


  • CHART_WINDOWS_TOTAL defines the total number of chart windows including indicator subwindows.

//+-----------------------------------------------------------------------+
//| Gets the total number of chart windows including indicator subwindows |
//+-----------------------------------------------------------------------+
int ChartWindowsTotal(const long chart_ID=0)
  {
//--- prepare the variable to get the property value
   long result=-1;
//--- reset the error value
   ResetLastError();
//--- receive the property value
   if(!ChartGetInteger(chart_ID,CHART_WINDOWS_TOTAL,0,result))
     {
      //--- display the error message in Experts journal
      Print(__FUNCTION__+", Error Code = ",GetLastError());
     }
//--- return the value of the chart property
   return((int)result);
  }


  • CHART_WINDOW_IS_VISIBLE defines the subwindow's visibility.

//+------------------------------------------------------------------+
//| Checks if the current chart window or subwindow is visible       |
//+------------------------------------------------------------------+
bool ChartWindowsIsVisible(bool &result,const long chart_ID=0,const int sub_window=0)
  {
//--- prepare the variable to get the property value
   long value;
//--- reset the error value
   ResetLastError();
//--- receive the property value
   if(!ChartGetInteger(chart_ID,CHART_WINDOW_IS_VISIBLE,sub_window,value))
     {
      //--- display the error message in Experts journal
      Print(__FUNCTION__+", Error Code = ",GetLastError());
      return(false);
     }
//--- store the value of the chart property in memory
   result=value;
//--- successful execution
   return(true);
  }


  • CHART_WINDOW_HANDLE returns the chart handle.

//+------------------------------------------------------------------+
//| Gets the chart handle                                            |
//+------------------------------------------------------------------+
int ChartWindowsHandle(const long chart_ID=0)
  {
//--- prepare the variable to get the property value
   long result=-1;
//--- reset the error value
   ResetLastError();
//--- receive the property value
   if(!ChartGetInteger(chart_ID,CHART_WINDOW_HANDLE,0,result))
     {
      //--- display the error message in Experts journal
      Print(__FUNCTION__+", Error Code = ",GetLastError());
     }
//--- return the value of the chart property
   return((int)result);
  }


  • CHART_WINDOW_YDISTANCE defines the distance in pixels between the upper frame of the indicator subwindow and the upper frame of the chart's main window.

//+------------------------------------------------------------------+
//| Gets the distance in pixels between the upper border of          |
//| subwindow and the upper border of chart's main window            |
//+------------------------------------------------------------------+
int ChartWindowsYDistance(const long chart_ID=0,const int sub_window=0)
  {
//--- prepare the variable to get the property value
   long result=-1;
//--- reset the error value
   ResetLastError();
//--- receive the property value
   if(!ChartGetInteger(chart_ID,CHART_WINDOW_YDISTANCE,sub_window,result))
     {
      //--- display the error message in Experts journal
      Print(__FUNCTION__+", Error Code = ",GetLastError());
     }
//--- return the value of the chart property
   return((int)result);
  }


  • CHART_FIRST_VISIBLE_BAR returns the number of the first visible bar on the chart (bar indexing corresponds to the time series).

//+------------------------------------------------------------------------------+
//| Gets the index of the first visible bar on chart.                            |
//| Indexing is performed like in timeseries: latest bars have smallest indices. |
//+------------------------------------------------------------------------------+
int ChartFirstVisibleBar(const long chart_ID=0)
  {
//--- prepare the variable to get the property value
   long result=-1;
//--- reset the error value
   ResetLastError();
//--- receive the property value
   if(!ChartGetInteger(chart_ID,CHART_FIRST_VISIBLE_BAR,0,result))
     {
      //--- display the error message in Experts journal
      Print(__FUNCTION__+", Error Code = ",GetLastError());
     }
//--- return the value of the chart property
   return((int)result);
  }


  • CHART_WIDTH_IN_BARS returns the chart width in bars.

//+------------------------------------------------------------------+
//| Gets the width of chart (in bars)                                |
//+------------------------------------------------------------------+
int ChartWidthInBars(const long chart_ID=0)
  {
//--- prepare the variable to get the property value
   long result=-1;
//--- reset the error value
   ResetLastError();
//--- receive the property value
   if(!ChartGetInteger(chart_ID,CHART_WIDTH_IN_BARS,0,result))
     {
      //--- display the error message in Experts journal
      Print(__FUNCTION__+", Error Code = ",GetLastError());
     }
//--- return the value of the chart property
   return((int)result);
  }


  • CHART_WIDTH_IN_PIXELS returns the chart width in pixels.

//+------------------------------------------------------------------+
//| Gets the width of chart (in pixels)                              |
//+------------------------------------------------------------------+
int ChartWidthInPixels(const long chart_ID=0)
  {
//--- prepare the variable to get the property value
   long result=-1;
//--- reset the error value
   ResetLastError();
//--- receive the property value
   if(!ChartGetInteger(chart_ID,CHART_WIDTH_IN_PIXELS,0,result))
     {
      //--- display the error message in Experts journal
      Print(__FUNCTION__+", Error Code = ",GetLastError());
     }
//--- return the value of the chart property
   return((int)result);
  }


  • CHART_HEIGHT_IN_PIXELS chart height property in pixels.

//+------------------------------------------------------------------+
//| Gets the height of chart (in pixels)                             |
//+------------------------------------------------------------------+
int ChartHeightInPixelsGet(const long chart_ID=0,const int sub_window=0)
  {
//--- prepare the variable to get the property value
   long result=-1;
//--- reset the error value
   ResetLastError();
//--- receive the property value
   if(!ChartGetInteger(chart_ID,CHART_HEIGHT_IN_PIXELS,sub_window,result))
     {
      //--- display the error message in Experts journal
      Print(__FUNCTION__+", Error Code = ",GetLastError());
     }
//--- return the value of the chart property
   return((int)result);
  }
//+------------------------------------------------------------------+
//| Sets the height of chart (in pixels)                             |
//+------------------------------------------------------------------+
bool ChartHeightInPixelsSet(const int value,const long chart_ID=0,const int sub_window=0)
  {
//--- reset the error value
   ResetLastError();
//--- set property value
   if(!ChartSetInteger(chart_ID,CHART_HEIGHT_IN_PIXELS,sub_window,value))
     {
      //--- display the error message in Experts journal
      Print(__FUNCTION__+", Error Code = ",GetLastError());
      return(false);
     }
//--- successful execution
   return(true);
  }


  • CHART_COLOR_BACKGROUND - chart background color.

//+------------------------------------------------------------------+
//| Gets the background color of chart                               |
//+------------------------------------------------------------------+
color ChartBackColorGet(const long chart_ID=0)
  {
//--- prepare the variable to receive the color
   long result=clrNONE;
//--- reset the error value
   ResetLastError();
//--- receive chart background color
   if(!ChartGetInteger(chart_ID,CHART_COLOR_BACKGROUND,0,result))
     {
      //--- display the error message in Experts journal
      Print(__FUNCTION__+", Error Code = ",GetLastError());
     }
//--- return the value of the chart property
   return((color)result);
  }
//+------------------------------------------------------------------+
//| Sets the background color of chart                               |
//+------------------------------------------------------------------+
bool ChartBackColorSet(const color clr,const long chart_ID=0)
  {
//--- reset the error value
   ResetLastError();
//--- set the chart background color
   if(!ChartSetInteger(chart_ID,CHART_COLOR_BACKGROUND,clr))
     {
      //--- display the error message in Experts journal
      Print(__FUNCTION__+", Error Code = ",GetLastError());
      return(false);
     }
//--- successful execution
   return(true);
  }


  • CHART_COLOR_FOREGROUND color of axes, scale and OHLC line.

//+------------------------------------------------------------------+
//| Gets the color of axes, scale and OHLC line                      |
//+------------------------------------------------------------------+
color ChartForeColorGet(const long chart_ID=0)
  {
//--- prepare the variable to receive the color
   long result=clrNONE;
//--- reset the error value
   ResetLastError();
//--- receive the color of axes, scale and OHLC line
   if(!ChartGetInteger(chart_ID,CHART_COLOR_FOREGROUND,0,result))
     {
      //--- display the error message in Experts journal
      Print(__FUNCTION__+", Error Code = ",GetLastError());
     }
//--- return the value of the chart property
   return((color)result);
  }
//+------------------------------------------------------------------+
//| Sets the color of axes, scale and OHLC line                      |
//+------------------------------------------------------------------+
bool ChartForeColorSet(const color clr,const long chart_ID=0)
  {
//--- reset the error value
   ResetLastError();
//--- set the color of axes, scale and OHLC line
   if(!ChartSetInteger(chart_ID,CHART_COLOR_FOREGROUND,clr))
     {
      //--- display the error message in Experts journal
      Print(__FUNCTION__+", Error Code = ",GetLastError());
      return(false);
     }
//--- successful execution
   return(true);
  }


  • CHART_COLOR_GRID chart grid color.

//+------------------------------------------------------------------+
//| Gets the color of chart grid                                     |
//+------------------------------------------------------------------+
color ChartGridColorGet(const long chart_ID=0)
  {
//--- prepare the variable to receive the color
   long result=clrNONE;
//--- reset the error value
   ResetLastError();
//--- receive chart grid color
   if(!ChartGetInteger(chart_ID,CHART_COLOR_GRID,0,result))
     {
      //--- display the error message in Experts journal
      Print(__FUNCTION__+", Error Code = ",GetLastError());
     }
//--- return the value of the chart property
   return((color)result);
  }
//+------------------------------------------------------------------+
//| Sets the color of chart grid                                     |
//+------------------------------------------------------------------+
bool ChartGridColorSet(const color clr,const long chart_ID=0)
  {
//--- reset the error value
   ResetLastError();
//--- set chart grid color
   if(!ChartSetInteger(chart_ID,CHART_COLOR_GRID,clr))
     {
      //--- display the error message in Experts journal
      Print(__FUNCTION__+", Error Code = ",GetLastError());
      return(false);
     }
//--- successful execution
   return(true);
  }


  • CHART_COLOR_VOLUME - color of volumes and position opening levels.

//+------------------------------------------------------------------+
//| Gets the color of volumes and market entry levels                |
//+------------------------------------------------------------------+
color ChartVolumeColorGet(const long chart_ID=0)
  {
//--- prepare the variable to receive the color
   long result=clrNONE;
//--- reset the error value
   ResetLastError();
//--- receive color of volumes and market entry levels
   if(!ChartGetInteger(chart_ID,CHART_COLOR_VOLUME,0,result))
     {
      //--- display the error message in Experts journal
      Print(__FUNCTION__+", Error Code = ",GetLastError());
     }
//--- return the value of the chart property
   return((color)result);
  }
//+------------------------------------------------------------------+
//| Sets the color of volumes and market entry levels                |
//+------------------------------------------------------------------+
bool ChartVolumeColorSet(const color clr,const long chart_ID=0)
  {
//--- reset the error value
   ResetLastError();
//--- set color of volumes and market entry levels
   if(!ChartSetInteger(chart_ID,CHART_COLOR_VOLUME,clr))
     {
      //--- display the error message in Experts journal
      Print(__FUNCTION__+", Error Code = ",GetLastError());
      return(false);
     }
//--- successful execution
   return(true);
  }


  • CHART_COLOR_CHART_UP color of up bar, its shadow and border of a bullish candlestick's body.

//+-----------------------------------------------------------------------------+
//| Gets the color of up bar, shadow and border of a bullish candlestick's body |
//+-----------------------------------------------------------------------------+
color ChartUpColorGet(const long chart_ID=0)
  {
//--- prepare the variable to receive the color
   long result=clrNONE;
//--- reset the error value
   ResetLastError();
//--- receive the color of up bar, its shadow and border of bullish candlestick's body
   if(!ChartGetInteger(chart_ID,CHART_COLOR_CHART_UP,0,result))
     {
      //--- display the error message in Experts journal
      Print(__FUNCTION__+", Error Code = ",GetLastError());
     }
//--- return the value of the chart property
   return((color)result);
  }
//+------------------------------------------------------------------+
//| Sets the color of up bar, shadow and border of a bullish candlestick's body |
//+------------------------------------------------------------------+
bool ChartUpColorSet(const color clr,const long chart_ID=0)
  {
//--- reset the error value
   ResetLastError();
//--- set the color of up bar, its shadow and border of body of a bullish candlestick
   if(!ChartSetInteger(chart_ID,CHART_COLOR_CHART_UP,clr))
     {
      //--- display the error message in Experts journal
      Print(__FUNCTION__+", Error Code = ",GetLastError());
      return(false);
     }
//--- successful execution
   return(true);
  }


  • CHART_COLOR_CHART_DOWN color of down bar, its shadow and border of bearish candlestick's body.

//+-------------------------------------------------------------------------------+
//| Gets the color of down bar, shadow and border of a bearish candlestick's body |
//+-------------------------------------------------------------------------------+
color ChartDownColorGet(const long chart_ID=0)
  {
//--- prepare the variable to receive the color
   long result=clrNONE;
//--- reset the error value
   ResetLastError();
//--- receive the color of down bar, its shadow and border of bearish candlestick's body
   if(!ChartGetInteger(chart_ID,CHART_COLOR_CHART_DOWN,0,result))
     {
      //--- display the error message in Experts journal
      Print(__FUNCTION__+", Error Code = ",GetLastError());
     }
//--- return the value of the chart property
   return((color)result);
  }
//+-------------------------------------------------------------------------------+
//| Sets the color of down bar, shadow and border of a bearish candlestick's body |
//+-------------------------------------------------------------------------------+
bool ChartDownColorSet(const color clr,const long chart_ID=0)
  {
//--- reset the error value
   ResetLastError();
//--- set the color of down bar, its shadow and border of bearish candlestick's body
   if(!ChartSetInteger(chart_ID,CHART_COLOR_CHART_DOWN,clr))
     {
      //--- display the error message in Experts journal
      Print(__FUNCTION__+", Error Code = ",GetLastError());
      return(false);
     }
//--- successful execution
   return(true);
  }


  • CHART_COLOR_CHART_LINE color of the chart line and Doji candlesticks.

//+------------------------------------------------------------------+
//| Gets the color of chart line and Doji candlesticks               |
//+------------------------------------------------------------------+
color ChartLineColorGet(const long chart_ID=0)
  {
//--- prepare the variable to receive the color
   long result=clrNONE;
//--- reset the error value
   ResetLastError();
//--- receive color of the chart line and Doji candlesticks
   if(!ChartGetInteger(chart_ID,CHART_COLOR_CHART_LINE,0,result))
     {
      //--- display the error message in Experts journal
      Print(__FUNCTION__+", Error Code = ",GetLastError());
     }
//--- return the value of the chart property
   return((color)result);
  }
//+------------------------------------------------------------------+
//| Sets the color of chart line and Doji candlesticks               |
//+------------------------------------------------------------------+
bool ChartLineColorSet(const color clr,const long chart_ID=0)
  {
//--- reset the error value
   ResetLastError();
//--- set color of the chart line and Doji candlesticks
   if(!ChartSetInteger(chart_ID,CHART_COLOR_CHART_LINE,clr))
     {
      //--- display the error message in Experts journal
      Print(__FUNCTION__+", Error Code = ",GetLastError());
      return(false);
     }
//--- successful execution
   return(true);
  }


  • CHART_COLOR_CANDLE_BULL color of bullish candlestick's body.

//+------------------------------------------------------------------+
//| Gets the color of bullish candlestick's body                     |
//+------------------------------------------------------------------+
color ChartBullColorGet(const long chart_ID=0)
  {
//--- prepare the variable to receive the color
   long result=clrNONE;
//--- reset the error value
   ResetLastError();
//--- receive the color of bullish candlestick's body
   if(!ChartGetInteger(chart_ID,CHART_COLOR_CANDLE_BULL,0,result))
     {
      //--- display the error message in Experts journal
      Print(__FUNCTION__+", Error Code = ",GetLastError());
     }
//--- return the value of the chart property
   return((color)result);
  }
//+------------------------------------------------------------------+
//| Sets the color of bullish candlestick's body                     |
//+------------------------------------------------------------------+
bool ChartBullColorSet(const color clr,const long chart_ID=0)
  {
//--- reset the error value
   ResetLastError();
//--- set the color of bullish candlestick's body
   if(!ChartSetInteger(chart_ID,CHART_COLOR_CANDLE_BULL,clr))
     {
      //--- display the error message in Experts journal
      Print(__FUNCTION__+", Error Code = ",GetLastError());
      return(false);
     }
//--- successful execution
   return(true);
  }


  • CHART_COLOR_CANDLE_BEAR color of bearish candlestick's body.

//+------------------------------------------------------------------+
//| Gets the color of bearish candlestick's body                     |
//+------------------------------------------------------------------+
color ChartBearColorGet(const long chart_ID=0)
  {
//--- prepare the variable to receive the color
   long result=clrNONE;
//--- reset the error value
   ResetLastError();
//--- receive the color of bearish candlestick's body
   if(!ChartGetInteger(chart_ID,CHART_COLOR_CANDLE_BEAR,0,result))
     {
      //--- display the error message in Experts journal
      Print(__FUNCTION__+", Error Code = ",GetLastError());
     }
//--- return the value of the chart property
   return((color)result);
  }
//+------------------------------------------------------------------+
//| Sets the color of bearish candlestick's body                     |
//+------------------------------------------------------------------+
bool ChartBearColorSet(const color clr,const long chart_ID=0)
  {
//--- reset the error value
   ResetLastError();
//--- set the color of bearish candlestick's body
   if(!ChartSetInteger(chart_ID,CHART_COLOR_CANDLE_BEAR,clr))
     {
      //--- display the error message in Experts journal
      Print(__FUNCTION__+", Error Code = ",GetLastError());
      return(false);
     }
//--- successful execution
   return(true);
  }


  • CHART_COLOR_BID Bid price line color.

//+------------------------------------------------------------------+
//| Gets the color of Bid line                                       |
//+------------------------------------------------------------------+
color ChartBidColorGet(const long chart_ID=0)
  {
//--- prepare the variable to receive the color
   long result=clrNONE;
//--- reset the error value
   ResetLastError();
//--- receive the color of Bid price line
   if(!ChartGetInteger(chart_ID,CHART_COLOR_BID,0,result))
     {
      //--- display the error message in Experts journal
      Print(__FUNCTION__+", Error Code = ",GetLastError());
     }
//--- return the value of the chart property
   return((color)result);
  }
//+------------------------------------------------------------------+
//| Sets the color of Bid line                                       |
//+------------------------------------------------------------------+
bool ChartBidColorSet(const color clr,const long chart_ID=0)
  {
//--- reset the error value
   ResetLastError();
//--- set the color of Bid price line
   if(!ChartSetInteger(chart_ID,CHART_COLOR_BID,clr))
     {
      //--- display the error message in Experts journal
      Print(__FUNCTION__+", Error Code = ",GetLastError());
      return(false);
     }
//--- successful execution
   return(true);
  }


  • CHART_COLOR_ASK Ask price line color.

//+------------------------------------------------------------------+
//| Gets the color of Ask line                                       |
//+------------------------------------------------------------------+
color ChartAskColorGet(const long chart_ID=0)
  {
//--- prepare the variable to receive the color
   long result=clrNONE;
//--- reset the error value
   ResetLastError();
//--- receive the color of Ask price line
   if(!ChartGetInteger(chart_ID,CHART_COLOR_ASK,0,result))
     {
      //--- display the error message in Experts journal
      Print(__FUNCTION__+", Error Code = ",GetLastError());
     }
//--- return the value of the chart property
   return((color)result);
  }
//+------------------------------------------------------------------+
//| Sets the color of Ask line                                       |
//+------------------------------------------------------------------+
bool ChartAskColorSet(const color clr,const long chart_ID=0)
  {
//--- reset the error value
   ResetLastError();
//--- set the color of Ask price line
   if(!ChartSetInteger(chart_ID,CHART_COLOR_ASK,clr))
     {
      //--- display the error message in Experts journal
      Print(__FUNCTION__+", Error Code = ",GetLastError());
      return(false);
     }
//--- successful execution
   return(true);
  }


  • CHART_COLOR_LAST color of the last performed deal's price line (Last).

//+------------------------------------------------------------------+
//| Gets the color of the last performed deal's price line           |
//+------------------------------------------------------------------+
color ChartLastColorGet(const long chart_ID=0)
  {
//--- prepare the variable to receive the color
   long result=clrNONE;
//--- reset the error value
   ResetLastError();
//--- receive color of the last performed deal's price line (Last)
   if(!ChartGetInteger(chart_ID,CHART_COLOR_LAST,0,result))
     {
      //--- display the error message in Experts journal
      Print(__FUNCTION__+", Error Code = ",GetLastError());
     }
//--- return the value of the chart property
   return((color)result);
  }
//+------------------------------------------------------------------+
//| Sets the color of the last performed deal's price line           |
//+------------------------------------------------------------------+
bool ChartLastColorSet(const color clr,const long chart_ID=0)
  {
//--- reset the error value
   ResetLastError();
//--- set color of the last performed deal's price line (Last)
   if(!ChartSetInteger(chart_ID,CHART_COLOR_LAST,clr))
     {
      //--- display the error message in Experts journal
      Print(__FUNCTION__+", Error Code = ",GetLastError());
      return(false);
     }
//--- successful execution
   return(true);
  }


  • CHART_COLOR_STOP_LEVEL stop order level color (Stop Loss and Take Profit).

//+------------------------------------------------------------------+
//| Gets the color of Stop Loss and Take Profit levels               |
//+------------------------------------------------------------------+
color ChartStopLevelColorGet(const long chart_ID=0)
  {
//--- prepare the variable to receive the color
   long result=clrNONE;
//--- reset the error value
   ResetLastError();
//--- receive the color of stop order levels (Stop Loss and Take Profit)
   if(!ChartGetInteger(chart_ID,CHART_COLOR_STOP_LEVEL,0,result))
     {
      //--- display the error message in Experts journal
      Print(__FUNCTION__+", Error Code = ",GetLastError());
     }
//--- return the value of the chart property
   return((color)result);
  }
//+------------------------------------------------------------------+
//| Sets the color of Stop Loss and Take Profit levels               |
//+------------------------------------------------------------------+
bool ChartStopLevelColorSet(const color clr,const long chart_ID=0)
  {
//--- reset the error value
   ResetLastError();
//--- set the color of stop order levels (Stop Loss and Take Profit)
   if(!ChartSetInteger(chart_ID,CHART_COLOR_STOP_LEVEL,clr))
     {
      //--- display the error message in Experts journal
      Print(__FUNCTION__+", Error Code = ",GetLastError());
      return(false);
     }
//--- successful execution
   return(true);
  }


  • CHART_SHOW_TRADE_LEVELS property of displaying trade levels on the chart (levels of open positions, Stop Loss, Take Profit and pending orders).

//+------------------------------------------------------------------+
//| Checks if trading levels are displayed on chart                  |
//+------------------------------------------------------------------+
bool ChartShowTradeLevelsGet(bool &result,const long chart_ID=0)
  {
//--- prepare the variable to get the property value
   long value;
//--- reset the error value
   ResetLastError();
//--- receive the property value
   if(!ChartGetInteger(chart_ID,CHART_SHOW_TRADE_LEVELS,0,value))
     {
      //--- display the error message in Experts journal
      Print(__FUNCTION__+", Error Code = ",GetLastError());
      return(false);
     }
//--- store the value of the chart property in memory
   result=value;
//--- successful execution
   return(true);
  }
//+------------------------------------------------------------------+
//| Enables/disables displaying of trading levels                    |
//+------------------------------------------------------------------+
bool ChartShowTradeLevelsSet(const bool value,const long chart_ID=0)
  {
//--- reset the error value
   ResetLastError();
//--- set property value
   if(!ChartSetInteger(chart_ID,CHART_SHOW_TRADE_LEVELS,0,value))
     {
      //--- display the error message in Experts journal
      Print(__FUNCTION__+", Error Code = ",GetLastError());
      return(false);
     }
//--- successful execution
   return(true);
  }


  • CHART_DRAG_TRADE_LEVELS property of enabling the ability to drag trading levels on a chart using mouse.

//+----------------------------------------------------------------------+
//| Checks if dragging of trading levels on chart using mouse is allowed |
//+----------------------------------------------------------------------+
bool ChartDragTradeLevelsGet(bool &result,const long chart_ID=0)
  {
//--- prepare the variable to get the property value
   long value;
//--- reset the error value
   ResetLastError();
//--- receive the property value
   if(!ChartGetInteger(chart_ID,CHART_DRAG_TRADE_LEVELS,0,value))
     {
      //--- display the error message in Experts journal
      Print(__FUNCTION__+", Error Code = ",GetLastError());
      return(false);
     }
//--- store the value of the chart property in memory
   result=value;
//--- successful execution
   return(true);
  }
//+------------------------------------------------------------------+
//| Enables/disables dragging of trading levels on chart using mouse |
//+------------------------------------------------------------------+
bool ChartDragTradeLevelsSet(const bool value,const long chart_ID=0)
  {
//--- reset the error value
   ResetLastError();
//--- set property value
   if(!ChartSetInteger(chart_ID,CHART_DRAG_TRADE_LEVELS,0,value))
     {
      //--- display the error message in Experts journal
      Print(__FUNCTION__+", Error Code = ",GetLastError());
      return(false);
     }
//--- successful execution
   return(true);
  }


  • CHART_SHOW_DATE_SCALE property of displaying the time scale on a chart.

//+------------------------------------------------------------------+
//| Checks if the time scale is displayed on chart                   |
//+------------------------------------------------------------------+
bool ChartShowDateScaleGet(bool &result,const long chart_ID=0)
  {
//--- prepare the variable to get the property value
   long value;
//--- reset the error value
   ResetLastError();
//--- receive the property value
   if(!ChartGetInteger(chart_ID,CHART_SHOW_DATE_SCALE,0,value))
     {
      //--- display the error message in Experts journal
      Print(__FUNCTION__+", Error Code = ",GetLastError());
      return(false);
     }
//--- store the value of the chart property in memory
   result=value;
//--- successful execution
   return(true);
  }
//+------------------------------------------------------------------+
//| Enables/disables displaying of the time scale on chart           |
//+------------------------------------------------------------------+
bool ChartShowDateScaleSet(const bool value,const long chart_ID=0)
  {
//--- reset the error value
   ResetLastError();
//--- set property value
   if(!ChartSetInteger(chart_ID,CHART_SHOW_DATE_SCALE,0,value))
     {
      //--- display the error message in Experts journal
      Print(__FUNCTION__+", Error Code = ",GetLastError());
      return(false);
     }
//--- successful execution
   return(true);
  }


  • CHART_SHOW_PRICE_SCALE property of displaying the price scale on a chart.

//+------------------------------------------------------------------+
//| Checks if the price scale is displayed on chart                  |
//+------------------------------------------------------------------+
bool ChartShowPriceScaleGet(bool &result,const long chart_ID=0)
  {
//--- prepare the variable to get the property value
   long value;
//--- reset the error value
   ResetLastError();
//--- receive the property value
   if(!ChartGetInteger(chart_ID,CHART_SHOW_PRICE_SCALE,0,value))
     {
      //--- display the error message in Experts journal
      Print(__FUNCTION__+", Error Code = ",GetLastError());
      return(false);
     }
//--- store the value of the chart property in memory
   result=value;
//--- successful execution
   return(true);
  }
//+------------------------------------------------------------------+
//| Enables/disables displaying of the price scale on chart          |
//+------------------------------------------------------------------+
bool ChartShowPriceScaleSet(const bool value,const long chart_ID=0)
  {
//--- reset the error value
   ResetLastError();
//--- set property value
   if(!ChartSetInteger(chart_ID,CHART_SHOW_PRICE_SCALE,0,value))
     {
      //--- display the error message in Experts journal
      Print(__FUNCTION__+", Error Code = ",GetLastError());
      return(false);
     }
//--- successful execution
   return(true);
  }


  • CHART_SHOW_ONE_CLICK property of displaying the "One click trading" panel on a chart.

//+------------------------------------------------------------------+
//| Checks if the "One click trading" panel is displayed on chart    |
//+------------------------------------------------------------------+
bool ChartShowOneClickPanelGet(bool &result,const long chart_ID=0)
  {
//--- prepare the variable to get the property value
   long value;
//--- reset the error value
   ResetLastError();
//--- receive the property value
   if(!ChartGetInteger(chart_ID,CHART_SHOW_ONE_CLICK,0,value))
     {
      //--- display the error message in Experts journal
      Print(__FUNCTION__+", Error Code = ",GetLastError());
      return(false);
     }
//--- store the value of the chart property in memory
   result=value;
//--- successful execution
   return(true);
  }
//+------------------------------------------------------------------+
//| Enables/disables displaying of the "One click trading" panel     |
//| on chart                                                         |
//+------------------------------------------------------------------+
bool ChartShowOneClickPanelSet(const bool value,const long chart_ID=0)
  {
//--- reset the error value
   ResetLastError();
//--- set property value
   if(!ChartSetInteger(chart_ID,CHART_SHOW_ONE_CLICK,0,value))
     {
      //--- display the error message in Experts journal
      Print(__FUNCTION__+", Error Code = ",GetLastError());
      return(false);
     }
//--- successful execution
   return(true);
  }


  • CHART_SHIFT_SIZE shift size of the zero bar from the right border in percentage values.

//+-----------------------------------------------------------------+
//| Gets the size of shifting of the zero bar from the right border |
//| of the chart in percentage values (from 10% up to 50%)          |
//+-----------------------------------------------------------------+
double ChartShiftSizeGet(const long chart_ID=0)
  {
//--- prepare the variable to get the result
   double result=EMPTY_VALUE;
//--- reset the error value
   ResetLastError();
//--- receive the property value
   if(!ChartGetDouble(chart_ID,CHART_SHIFT_SIZE,0,result))
     {
      //--- display the error message in Experts journal
      Print(__FUNCTION__+", Error Code = ",GetLastError());
     }
//--- return the value of the chart property
   return(result);
  }
//+-----------------------------------------------------------------------------+
//| Gets the size of shifting of the zero bar from the right border             |
//| of the chart in percentage values (from 10% up to 50%).                     |
//| To enable the shift mode, CHART_SHIFT property value should be set to true. |
//+-----------------------------------------------------------------------------+
bool ChartShiftSizeSet(const double value,const long chart_ID=0)
  {
//--- reset the error value
   ResetLastError();
//--- set property value
   if(!ChartSetDouble(chart_ID,CHART_SHIFT_SIZE,value))
     {
      //--- display the error message in Experts journal
      Print(__FUNCTION__+", Error Code = ",GetLastError());
      return(false);
     }
//--- successful execution
   return(true);
  }


  • CHART_FIXED_POSITION chart fixed position from the left border in percentage value.

//+----------------------------------------------------------------------------------------+
//| Gets the location of chart's fixed position from the left border (in percentage value) |
//+----------------------------------------------------------------------------------------+
double ChartFixedPositionGet(const long chart_ID=0)
  {
//--- prepare the variable to get the result
   double result=EMPTY_VALUE;
//--- reset the error value
   ResetLastError();
//--- receive the property value
   if(!ChartGetDouble(chart_ID,CHART_FIXED_POSITION,0,result))
     {
      //--- display the error message in Experts journal
      Print(__FUNCTION__+", Error Code = ",GetLastError());
     }
//--- return the value of the chart property
   return(result);
  }
//+-----------------------------------------------------------------------------------------+
//| Gets the location of chart's fixed position from the left border (in percentage value). |
//| To view the location of chart's fixed position, the value of CHART_AUTOSCROLL property  |
//| should be set to false.                                                                 |
//+-----------------------------------------------------------------------------------------+
bool ChartFixedPositionSet(const double value,const long chart_ID=0)
  {
//--- reset the error value
   ResetLastError();
//--- set property value
   if(!ChartSetDouble(chart_ID,CHART_FIXED_POSITION,value))
     {
      //--- display the error message in Experts journal
      Print(__FUNCTION__+", Error Code = ",GetLastError());
      return(false);
     }
//--- successful execution
   return(true);
  }


  • CHART_FIXED_MAX property of the chart's fixed maximum.

//+------------------------------------------------------------------+
//| Gets the value of chart's fixed maximum                          |
//+------------------------------------------------------------------+
double ChartFixedMaxGet(const long chart_ID=0)
  {
//--- prepare the variable to get the result
   double result=EMPTY_VALUE;
//--- reset the error value
   ResetLastError();
//--- receive the property value
   if(!ChartGetDouble(chart_ID,CHART_FIXED_MAX,0,result))
     {
      //--- display the error message in Experts journal
      Print(__FUNCTION__+", Error Code = ",GetLastError());
     }
//--- return the value of the chart property
   return(result);
  }
//+------------------------------------------------------------------+
//| Sets the value of chart's fixed maximum.                         |
//| To change the value of the property, CHART_SCALEFIX property     |
//| value should be preliminarily set to true.                       |
//+------------------------------------------------------------------+
bool ChartFixedMaxSet(const double value,const long chart_ID=0)
  {
//--- reset the error value
   ResetLastError();
//--- set property value
   if(!ChartSetDouble(chart_ID,CHART_FIXED_MAX,value))
     {
      //--- display the error message in Experts journal
      Print(__FUNCTION__+", Error Code = ",GetLastError());
      return(false);
     }
//--- successful execution
   return(true);
  }


  • CHART_FIXED_MIN property of the chart's fixed minimum.

//+------------------------------------------------------------------+
//| Gets the value of chart's fixed minimum                          |
//+------------------------------------------------------------------+
double ChartFixedMinGet(const long chart_ID=0)
  {
//--- prepare the variable to get the result
   double result=EMPTY_VALUE;
//--- reset the error value
   ResetLastError();
//--- receive the property value
   if(!ChartGetDouble(chart_ID,CHART_FIXED_MIN,0,result))
     {
      //--- display the error message in Experts journal
      Print(__FUNCTION__+", Error Code = ",GetLastError());
     }
//--- return the value of the chart property
   return(result);
  }
//+------------------------------------------------------------------+
//| Sets the value of chart's fixed minimum.                         |
//| To change the value of the property, CHART_SCALEFIX property     |
//| value should be preliminarily set to true.                       |
//+------------------------------------------------------------------+
bool ChartFixedMinSet(const double value,const long chart_ID=0)
  {
//--- reset the error value
   ResetLastError();
//--- set property value
   if(!ChartSetDouble(chart_ID,CHART_FIXED_MIN,value))
     {
      //--- display the error message in Experts journal
      Print(__FUNCTION__+", Error Code = ",GetLastError());
      return(false);
     }
//--- successful execution
   return(true);
  }


  • CHART_POINTS_PER_BAR value of scale in points per bar.

//+------------------------------------------------------------------+
//| Gets the value of chart scale in points per bar                  |
//+------------------------------------------------------------------+
double ChartPointsPerBarGet(const long chart_ID=0)
  {
//--- prepare the variable to get the result
   double result=EMPTY_VALUE;
//--- reset the error value
   ResetLastError();
//--- receive the property value
   if(!ChartGetDouble(chart_ID,CHART_POINTS_PER_BAR,0,result))
     {
      //--- display the error message in Experts journal
      Print(__FUNCTION__+", Error Code = ",GetLastError());
     }
//--- return the value of the chart property
   return(result);
  }
//+----------------------------------------------------------------------+
//| Sets the value of chart scale in points per bar.                     |
//| To view the result of this property's value change, the value of     |
//| CHART_SCALE_PT_PER_BAR property should be preliminarily set to true. |
//+----------------------------------------------------------------------+
bool ChartPointsPerBarSet(const double value,const long chart_ID=0)
  {
//--- reset the error value
   ResetLastError();
//--- set property value
   if(!ChartSetDouble(chart_ID,CHART_POINTS_PER_BAR,value))
     {
      //--- display the error message in Experts journal
      Print(__FUNCTION__+", Error Code = ",GetLastError());
      return(false);
     }
//--- successful execution
   return(true);
  }


  • CHART_PRICE_MIN returns the value of the chart minimum.

//+----------------------------------------------------------------------+
//| Gets the value of chart minimum in the main window or in a subwindow |
//+----------------------------------------------------------------------+
double ChartPriceMin(const long chart_ID=0,const int sub_window=0)
  {
//--- prepare the variable to get the result
   double result=EMPTY_VALUE;
//--- reset the error value
   ResetLastError();
//--- receive the property value
   if(!ChartGetDouble(chart_ID,CHART_PRICE_MIN,sub_window,result))
     {
      //--- display the error message in Experts journal
      Print(__FUNCTION__+", Error Code = ",GetLastError());
     }
//--- return the value of the chart property
   return(result);
  }


  • CHART_PRICE_MAX returns the value of the chart maximum.

//+----------------------------------------------------------------------+
//| Gets the value of chart maximum in the main window or in a subwindow |
//+----------------------------------------------------------------------+
double ChartPriceMax(const long chart_ID=0,const int sub_window=0)
  {
//--- prepare the variable to get the result
   double result=EMPTY_VALUE;
//--- reset the error value
   ResetLastError();
//--- receive the property value
   if(!ChartGetDouble(chart_ID,CHART_PRICE_MAX,sub_window,result))
     {
      //--- display the error message in Experts journal
      Print(__FUNCTION__+", Error Code = ",GetLastError());
     }
//--- return the value of the chart property
   return(result);
  }


  • CHART_COMMENT comment on the chart.

//+------------------------------------------------------------------+
//| Gets comment in the upper left corner of chart                   |
//+------------------------------------------------------------------+
bool ChartCommentGet(string &result,const long chart_ID=0)
  {
//--- reset the error value
   ResetLastError();
//--- receive the property value
   if(!ChartGetString(chart_ID,CHART_COMMENT,result))
     {
      //--- display the error message in Experts journal
      Print(__FUNCTION__+", Error Code = ",GetLastError());
      return(false);
     }
//--- successful execution
   return(true);
  }
//+------------------------------------------------------------------+
//| Gets comment in the upper left corner of chart                   |
//+------------------------------------------------------------------+
bool ChartCommentSet(const string str,const long chart_ID=0)
  {
//--- reset the error value
   ResetLastError();
//--- set property value
   if(!ChartSetString(chart_ID,CHART_COMMENT,str))
     {
      //--- display the error message in Experts journal
      Print(__FUNCTION__+", Error Code = ",GetLastError());
      return(false);
     }
//--- successful execution
   return(true);
  }


  • CHART_IS_MAXIMIZED - chart window is maximized.

//+------------------------------------------------------------------+
//| Defines if the current chart window is maximized                 |
//+------------------------------------------------------------------+
bool ChartWindowsIsMaximized(bool &result,const long chart_ID=0)
  {
//--- prepare the variable for receiving the property value
   long value;
//--- reset the error value
   ResetLastError();
//--- receive the property value
   if(!ChartGetInteger(chart_ID,CHART_IS_MAXIMIZED))
     {
      //--- display an error message in the Experts log
      Print(__FUNCTION__+", Error Code = ",GetLastError());
      return(false);
     }
//--- store the chart property value in the variable
   result=value;
//--- successful execution
   return(true);
  }


  • CHART_IS_MINIMIZED chart window is minimized.

//+------------------------------------------------------------------+
//| Defines if the current chart window is minimized                 |
//+------------------------------------------------------------------+
bool ChartWindowsIsMinimized(bool &result,const long chart_ID=0)
  {
//--- prepare the variable for receiving the property value
   long value;
//--- reset the error value
   ResetLastError();
//--- receive the property value
   if(!ChartGetInteger(chart_ID,CHART_IS_MINIMIZED))
     {
      //--- display an error message in the Experts log
      Print(__FUNCTION__+", Error Code = ",GetLastError());
      return(false);
     }
//--- store the chart property value in the variable
   result=value;
//--- successful execution
   return(true);
  }


Panel for chart properties

//--- connect the library of control elements
#include <ChartObjects\ChartObjectsTxtControls.mqh>
//--- predefined constants
#define X_PROPERTY_NAME_1    10  // x coordinate of the property name in the first column
#define X_PROPERTY_VALUE_1   225 // x coordinate of the property value in the first column
#define X_PROPERTY_NAME_2    345 // x coordinate of the property name in the second and third columns
#define X_PROPERTY_VALUE_2   550 // x coordinate of the property value in the second and third columns
#define X_BUTTON_1           285 // x coordinate of the button in the first column
#define X_BUTTON_2           700 // x coordinate of the button in the second column
#define Y_PROPERTY_1         30  // y coordinate of the beginning of the first and second column
#define Y_PROPERTY_2         286 // y coordinate of the beginning of the third column
#define Y_DISTANCE           16  // y axial distance between the lines
#define LAST_PROPERTY_NUMBER 111 // number of the last graphical property
//--- input parameters
input color InpFirstColor=clrDodgerBlue// Color of odd lines
input color InpSecondColor=clrGoldenrod// Color of even lines
//--- variables and arrays
CChartObjectLabel  ExtLabelsName[];  // labels for displaying property names
CChartObjectLabel  ExtLabelsValue[]; // labels for displaying property values
CChartObjectButton ExtButtons[];     // buttons
int                ExtNumbers[];     // property indices
string             ExtNames[];       // property names
uchar              ExtDataTypes[];   // property data types (integer, double, string)
uint               ExtGroupTypes[];  // array that stores the data on belonging of properties to one of the groups
uchar              ExtDrawTypes[];   // array that stores the data on the type of property display
double             ExtMaxValue[];    // maximum property values that are possible when working with the panel
double             ExtMinValue[];    // minimum property values that are possible when working with the panel
double             ExtStep[];        // steps for changing properties
int                ExtCount;         // total number of all properties
color              ExtColors[2];     // array of colors for displaying lines
string             ExtComments[2];   // array of comments (for CHART_COMMENT property)
//+------------------------------------------------------------------+
//| Custom indicator initialization function                         |
//+------------------------------------------------------------------+
int OnInit()
  {
//--- display a comment on the chart
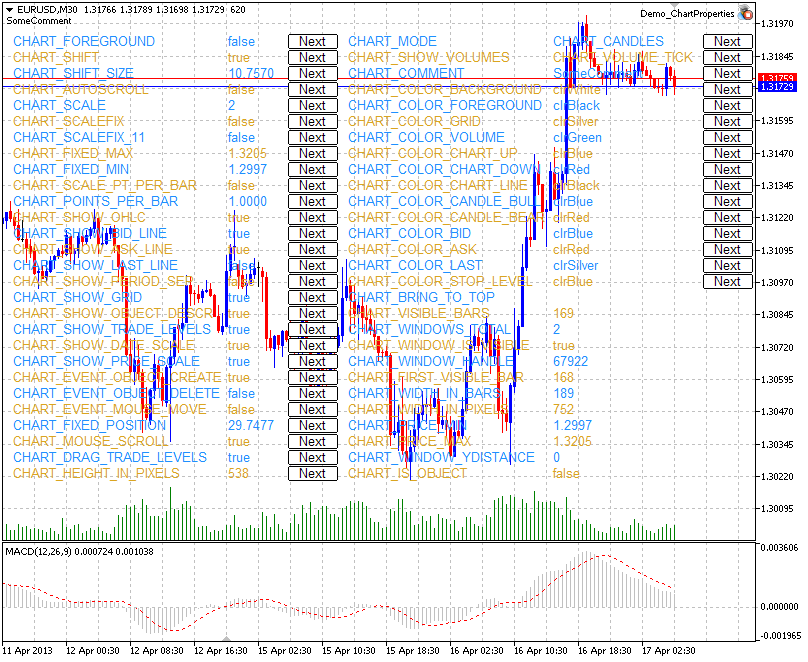
   Comment("SomeComment");
//--- store colors in the array to be able to switch between them later
   ExtColors[0]=InpFirstColor;
   ExtColors[1]=InpSecondColor;
//--- store comments in the array to be able to switch between them later
   ExtComments[0]="FirstComment";
   ExtComments[1]="SecondComment";
//--- prepare and display the control panel for managing chart properties
   if(!PrepareControls())
      return(INIT_FAILED);
//--- successful execution
   return(INIT_SUCCEEDED);
  }
//+------------------------------------------------------------------+
//| Deinitialization function of the expert                          |
//+------------------------------------------------------------------+
void OnDeinit(const int reason)
  {
//--- remove the comment on the chart
   Comment("");
  }
//+------------------------------------------------------------------+
//| Handler of a chart event                                         |
//+------------------------------------------------------------------+
void OnChartEvent(const int id,
                  const long &lparam,
                  const double &dparam,
                  const string &sparam)
  {
//--- check the event of clicking the chart object
   if(id==CHARTEVENT_OBJECT_CLICK)
     {
      //--- divide the object name by separator
      string obj_name[];
      StringSplit(sparam,'_',obj_name);
      //--- check if the object is a button
      if(obj_name[0]=="Button")
        {
         //--- receive button index
         int index=(int)StringToInteger(obj_name[1]);
         //--- unpress the button
         ExtButtons[index].State(false);
         //--- set the new value of the property depending on its type
         if(ExtDataTypes[index]=='I')
            ChangeIntegerProperty(index);
         if(ExtDataTypes[index]=='D')
            ChangeDoubleProperty(index);
         if(ExtDataTypes[index]=='S')
            ChangeStringProperty(index);
        }
     }
//--- re-draw property values
   RedrawProperties();
   ChartRedraw();
  }
//+------------------------------------------------------------------+
//| Changes an integer property of chart                             |
//+------------------------------------------------------------------+
void ChangeIntegerProperty(const int index)
  {
//--- receive the current property value
   long value=ChartGetInteger(0,(ENUM_CHART_PROPERTY_INTEGER)ExtNumbers[index]);
//--- define the following property value
   switch(ExtDrawTypes[index])
     {
      case 'C':
         value=GetNextColor((color)value);
         break;
      default:
         value=(long)GetNextValue((double)value,index);
         break;
     }
//--- set the new property value
   ChartSetInteger(0,(ENUM_CHART_PROPERTY_INTEGER)ExtNumbers[index],0,value);
  }
//+------------------------------------------------------------------+
//| Changes a double property of chart                               |
//+------------------------------------------------------------------+
void ChangeDoubleProperty(const int index)
  {
//--- receive the current property value
   double value=ChartGetDouble(0,(ENUM_CHART_PROPERTY_DOUBLE)ExtNumbers[index]);
//--- define the following property value
   value=GetNextValue(value,index);
//--- set the new property value
   ChartSetDouble(0,(ENUM_CHART_PROPERTY_DOUBLE)ExtNumbers[index],value);
  }
//+------------------------------------------------------------------+
//| Changes a string property of chart                               |
//+------------------------------------------------------------------+
void ChangeStringProperty(const int index)
  {
//--- static variable for switching inside ExtComments array
   static uint comment_index=1;
//--- change index for receiving another comment
   comment_index=1-comment_index;
//--- set the new property value
   ChartSetString(0,(ENUM_CHART_PROPERTY_STRING)ExtNumbers[index],ExtComments[comment_index]);
  }
//+------------------------------------------------------------------+
//| Gets the next property value                                     |
//+------------------------------------------------------------------+
double GetNextValue(const double value,const int index)
  {
   if(value+ExtStep[index]<=ExtMaxValue[index])
      return(value+ExtStep[index]);
   else
      return(ExtMinValue[index]);
  }
//+------------------------------------------------------------------+
//| Gets the next color for color type property                      |
//+------------------------------------------------------------------+
color GetNextColor(const color clr)
  {
//--- return the following color value
   switch(clr)
     {
      case clrWhitereturn(clrRed);
      case clrRed:   return(clrGreen);
      case clrGreenreturn(clrBlue);
      case clrBlue:  return(clrBlack);
      default:       return(clrWhite);
     }
  }
//+------------------------------------------------------------------+
//| Re-draws property values                                         |
//+------------------------------------------------------------------+
void RedrawProperties(void)
  {
//--- property value text
   string text;
   long   value;
//--- loop of the number of properties
   for(int i=0;i<ExtCount;i++)
     {
      text="";
      switch(ExtDataTypes[i])
        {
         case 'I':
            //--- receive the current property value
            if(!ChartGetInteger(0,(ENUM_CHART_PROPERTY_INTEGER)ExtNumbers[i],0,value))
            break;
            //--- integer property text
            switch(ExtDrawTypes[i])
              {
               //--- color property
               case 'C':
                  text=(string)((color)value);
                  break;
                  //--- boolean property
               case 'B':
                  text=(string)((bool)value);
                  break;
                  //--- ENUM_CHART_MODE enumeration property
               case 'M':
                  text=EnumToString((ENUM_CHART_MODE)value);
                  break;
                  //--- ENUM_CHART_VOLUME_MODE enumeration property
               case 'V':
                  text=EnumToString((ENUM_CHART_VOLUME_MODE)value);
                  break;
                  //--- int type number
               default:
                  text=IntegerToString(value);
                  break;
              }
            break;
         case 'D':
            //--- double property text
            text=DoubleToString(ChartGetDouble(0,(ENUM_CHART_PROPERTY_DOUBLE)ExtNumbers[i]),4);
            break;
         case 'S':
            //--- string property text
            text=ChartGetString(0,(ENUM_CHART_PROPERTY_STRING)ExtNumbers[i]);
            break;
        }
      //--- display property value
      ExtLabelsValue[i].Description(text);
     }
  }
//+------------------------------------------------------------------+
//| Creates panel for managing chart properties                      |
//+------------------------------------------------------------------+
bool PrepareControls(void)
  {
//--- allocate memory for arrays with a reserve
   MemoryAllocation(LAST_PROPERTY_NUMBER+1);
//--- variables
   int i=0;     // loop variable
   int col_1=0; // number of properties in the first column
   int col_2=0; // number of properties in the second column
   int col_3=0; // number of properties in the third column
//--- current number of properties - 0
   ExtCount=0;
//--- looking for properties in the loop
   while(i<=LAST_PROPERTY_NUMBER)
     {
      //--- store the current number of the property
      ExtNumbers[ExtCount]=i;
      //--- increase the value of the loop variable
      i++;
      //--- check if there is a property with such a number
      if(CheckNumber(ExtNumbers[ExtCount],ExtNames[ExtCount],ExtDataTypes[ExtCount],ExtGroupTypes[ExtCount],ExtDrawTypes[ExtCount]))
        {
         //--- create control elements for the property
         switch(ExtGroupTypes[ExtCount])
           {
            case 1:
               //--- create labels and a button for the property
               if(!ShowProperty(ExtCount,0,X_PROPERTY_NAME_1,X_PROPERTY_VALUE_1,X_BUTTON_1,Y_PROPERTY_1+col_1*Y_DISTANCE,true))
               return(false);
               //--- number of the elements in the first column has increased
               col_1++;
               break;
            case 2:
               //--- create labels and a button for the property
               if(!ShowProperty(ExtCount,1,X_PROPERTY_NAME_2,X_PROPERTY_VALUE_2,X_BUTTON_2,Y_PROPERTY_1+col_2*Y_DISTANCE,true))
               return(false);
               //--- number of the elements in the second column has increased
               col_2++;
               break;
            case 3:
               //--- create only labels for the property
               if(!ShowProperty(ExtCount,2,X_PROPERTY_NAME_2,X_PROPERTY_VALUE_2,0,Y_PROPERTY_2+col_3*Y_DISTANCE,false))
               return(false);
               //--- number of the elements in the third column has increased
               col_3++;
               break;
           }
         //--- define maximum and minimum property value and step
         GetMaxMinStep(ExtNumbers[ExtCount],ExtMaxValue[ExtCount],ExtMinValue[ExtCount],ExtStep[ExtCount]);
         //--- increase the number of properties
         ExtCount++;
        }
     }
//--- free the memory not used by arrays
   MemoryAllocation(ExtCount);
//--- re-draw property values
   RedrawProperties();
   ChartRedraw();
//--- successful execution
   return(true);
  }
//+------------------------------------------------------------------+
//| Allocates memory for arrays                                      |
//+------------------------------------------------------------------+
void MemoryAllocation(const int size)
  {
   ArrayResize(ExtLabelsName,size);
   ArrayResize(ExtLabelsValue,size);
   ArrayResize(ExtButtons,size);
   ArrayResize(ExtNumbers,size);
   ArrayResize(ExtNames,size);
   ArrayResize(ExtDataTypes,size);
   ArrayResize(ExtGroupTypes,size);
   ArrayResize(ExtDrawTypes,size);
   ArrayResize(ExtMaxValue,size);
   ArrayResize(ExtMinValue,size);
   ArrayResize(ExtStep,size);
  }
//+------------------------------------------------------------------+
//| Checks if the property index belongs to the one of               |
//| ENUM_CHART_PROPERTIES enumerations                               |
//+------------------------------------------------------------------+
bool CheckNumber(const int ind,string &name,uchar &data_type,uint &group_type,uchar &draw_type)
  {
//--- check if the property is of integer type
   ResetLastError();
   name=EnumToString((ENUM_CHART_PROPERTY_INTEGER)ind);
   if(_LastError==0)
     {
      data_type='I';                      // property from ENUM_CHART_PROPERTY_INTEGER enumeration
      GetTypes(ind,group_type,draw_type); // define property display parameters
      return(true);
     }
//--- check if the property is of double type
   ResetLastError();
   name=EnumToString((ENUM_CHART_PROPERTY_DOUBLE)ind);
   if(_LastError==0)
     {
      data_type='D';                      // property from ENUM_CHART_PROPERTY_DOUBLE enumeration
      GetTypes(ind,group_type,draw_type); // define property display parameters
      return(true);
     }
//--- check if the property is of string type
   ResetLastError();
   name=EnumToString((ENUM_CHART_PROPERTY_STRING)ind);
   if(_LastError==0)
     {
      data_type='S';                      // property from ENUM_CHART_PROPERTY_STRING enumeration
      GetTypes(ind,group_type,draw_type); // define property display parameters
      return(true);
     }
//--- property does not belong to any enumeration
   return(false);
  }
//+------------------------------------------------------------------+
//| Defines the group in which property should be stored,            |
//| as well as its display type                                      |
//+------------------------------------------------------------------+
void GetTypes(const int property_number,uint &group_type,uchar &draw_type)
  {
//--- check if the property belongs to the third group
//--- third group properties are displayed in the second column starting from CHART_BRING_TO_TOP
   if(CheckThirdGroup(property_number,group_type,draw_type))
      return;
//--- check if the property belongs to the second group
//--- second group properties are displayed at the beginning of the second column
   if(CheckSecondGroup(property_number,group_type,draw_type))
      return;
//--- if you find yourself here, the property belongs to the first group (first column)
   CheckFirstGroup(property_number,group_type,draw_type);
  }
//+----------------------------------------------------------------------+
//| Checks if property belongs to the third group and                    |
//| defines its display type in case of a positive answer                |
//+----------------------------------------------------------------------+
bool CheckThirdGroup(const int property_number,uint &group_type,uchar &draw_type)
  {
//--- check if the property belongs to the third group
   switch(property_number)
     {
      //--- boolean properties
      case CHART_IS_OBJECT:
      case CHART_WINDOW_IS_VISIBLE:
         draw_type='B';
         break;
         //--- integer properties
      case CHART_VISIBLE_BARS:
      case CHART_WINDOWS_TOTAL:
      case CHART_WINDOW_HANDLE:
      case CHART_WINDOW_YDISTANCE:
      case CHART_FIRST_VISIBLE_BAR:
      case CHART_WIDTH_IN_BARS:
      case CHART_WIDTH_IN_PIXELS:
         draw_type='I';
         break;
         //--- double properties
      case CHART_PRICE_MIN:
      case CHART_PRICE_MAX:
         draw_type='D';
         break;
         //--- in fact, this property is a command of displaying the chart on top of all the others
         //--- there is no need to apply this panel, as the window will always be
         //--- on top of other ones before we use it
      case CHART_BRING_TO_TOP:
         draw_type=' ';
         break;
         //--- property does not belong to the third group
      default:
         return(false);
     }
//--- property belongs to the third group
   group_type=3;
   return(true);
  }
//+----------------------------------------------------------------------+
//| Checks if property belongs to the second group and                   |
//| defines its display type in case of a positive answer                |
//+----------------------------------------------------------------------+
bool CheckSecondGroup(const int property_number,uint &group_type,uchar &draw_type)
  {
//--- check if the property belongs to the second group
   switch(property_number)
     {
      //--- ENUM_CHART_MODE type property
      case CHART_MODE:
         draw_type='M';
         break;
         //--- ENUM_CHART_VOLUME_MODE type property
      case CHART_SHOW_VOLUMES:
         draw_type='V';
         break;
         //--- string property
      case CHART_COMMENT:
         draw_type='S';
         break;
         //--- color property
      case CHART_COLOR_BACKGROUND:
      case CHART_COLOR_FOREGROUND:
      case CHART_COLOR_GRID:
      case CHART_COLOR_VOLUME:
      case CHART_COLOR_CHART_UP:
      case CHART_COLOR_CHART_DOWN:
      case CHART_COLOR_CHART_LINE:
      case CHART_COLOR_CANDLE_BULL:
      case CHART_COLOR_CANDLE_BEAR:
      case CHART_COLOR_BID:
      case CHART_COLOR_ASK:
      case CHART_COLOR_LAST:
      case CHART_COLOR_STOP_LEVEL:
         draw_type='C';
         break;
         //--- property does not belong to the second group
      default:
         return(false);
     }
//--- property belongs to the second group
   group_type=2;
   return(true);
  }
//+-----------------------------------------------------------------------+
//| Called only if it is already known that property does not belong      |
//| to the second and third property groups                               |
//+-----------------------------------------------------------------------+
void CheckFirstGroup(const int property_number,uint &group_type,uchar &draw_type)
  {
//--- the property belongs to the first group
   group_type=1;
//--- define property display type
   switch(property_number)
     {
      //--- integer properties
      case CHART_SCALE:
      case CHART_HEIGHT_IN_PIXELS:
         draw_type='I';
         return;
         //--- double properties
      case CHART_SHIFT_SIZE:
      case CHART_FIXED_POSITION:
      case CHART_FIXED_MAX:
      case CHART_FIXED_MIN:
      case CHART_POINTS_PER_BAR:
         draw_type='D';
         return;
         //--- only boolean properties have remained
      default:
         draw_type='B';
         return;
     }
  }
//+------------------------------------------------------------------+
//| Creates label and button for property                            |
//+------------------------------------------------------------------+
bool ShowProperty(const int ind,const int type,const int x1,const int x2,
                  const int xb,const int y,const bool btn)
  {
//--- static array for switching inside ExtColors color array
   static uint color_index[3]={1,1,1};
//--- change index for receiving another color
   color_index[type]=1-color_index[type];
//--- display labels and a button (if btn=true) for the property
   if(!LabelCreate(ExtLabelsName[ind],"name_"+(string)ind,ExtNames[ind],ExtColors[color_index[type]],x1,y))
      return(false);
   if(!LabelCreate(ExtLabelsValue[ind],"value_"+(string)ind,"",ExtColors[color_index[type]],x2,y))
      return(false);
   if(btn && !ButtonCreate(ExtButtons[ind],(string)ind,xb,y+1))
      return(false);
//--- successful execution
   return(true);
  }
//+------------------------------------------------------------------+
//| Creates label                                                    |
//+------------------------------------------------------------------+
bool LabelCreate(CChartObjectLabel &lbl,const string name,const string text,
                 const color clr,const int x,const int y)
  {
   if(!lbl.Create(0,"Label_"+name,0,x,y)) return(false);
   if(!lbl.Description(text))             return(false);
   if(!lbl.FontSize(10))                  return(false);
   if(!lbl.Color(clr))                    return(false);
//--- successful execution
   return(true);
  }
//+------------------------------------------------------------------+
//| Creates button                                                   |
//+------------------------------------------------------------------+
bool ButtonCreate(CChartObjectButton &btn,const string name,
                  const int x,const int y)
  {
   if(!btn.Create(0,"Button_"+name,0,x,y,50,15)) return(false);
   if(!btn.Description("Next"))                  return(false);
   if(!btn.FontSize(10))                         return(false);
   if(!btn.Color(clrBlack))                      return(false);
   if(!btn.BackColor(clrWhite))                  return(false);
   if(!btn.BorderColor(clrBlack))                return(false);
//--- successful execution
   return(true);
  }
//+------------------------------------------------------------------+
//| Defines maximum and minimum property value and step              |
//+------------------------------------------------------------------+
void GetMaxMinStep(const int property_number,double &max,double &min,double &step)
  {
   double value;
//--- set values depending on the property type
   switch(property_number)
     {
      case CHART_SCALE:
         max=5;
         min=0;
         step=1;
         break;
      case CHART_MODE:
      case CHART_SHOW_VOLUMES:
         max=2;
         min=0;
         step=1;
         break;
      case CHART_SHIFT_SIZE:
         max=50;
         min=10;
         step=2.5;
         break;
      case CHART_FIXED_POSITION:
         max=90;
         min=0;
         step=15;
         break;
      case CHART_POINTS_PER_BAR:
         max=19;
         min=1;
         step=3;
         break;
      case CHART_FIXED_MAX:
         value=ChartGetDouble(0,CHART_FIXED_MAX);
         max=value*1.25;
         min=value;
         step=value/32;
         break;
      case CHART_FIXED_MIN:
         value=ChartGetDouble(0,CHART_FIXED_MIN);
         max=value;
         min=value*0.75;
         step=value/32;
         break;
      case CHART_HEIGHT_IN_PIXELS:
         max=700;
         min=520;
         step=30;
         break;
         //--- default values
      default:
         max=1;
         min=0;
         step=1;
     }
  }