

Generating a Per-Symbol Trade Analytics PDF Report from MQL5
 698
698
 0
0

Introduction
When reviewing a symbol's historical performance, a trader is usually limited to what the terminal's History tab shows on screen or to a spreadsheet assembled manually after the fact. Neither produces a portable, shareable document. A PDF report solves this directly: it is a single self-contained file that opens identically on any computer, can be attached to an email, archived alongside a trading journal, or shared with a reviewer without requiring MetaTrader 5 to be installed at all.
The obstacle is that MQL5 provides no built-in PDF library. Generating a PDF via an external converter or a third-party DLL adds a dependency that may be unavailable on some machines. In many terminal configurations, DLL imports are also disabled by policy. This article takes a different approach: a simple single-page PDF with text and vector graphics can be built from a plain-text object structure defined by a public specification. It can be assembled directly from MQL5 string concatenation and the standard file API, with no external library, no DLL, and no dependency beyond the terminal itself.
The result is a script that reads a symbol's closed-trade history, computes a standard set of performance statistics, and writes a one-page PDF report containing a labeled statistics table and an equity curve chart with a colored line and a grey background for visual clarity. The implementation separates the statistics computation, the low-level PDF construction, and the page layout into three independently testable modules.
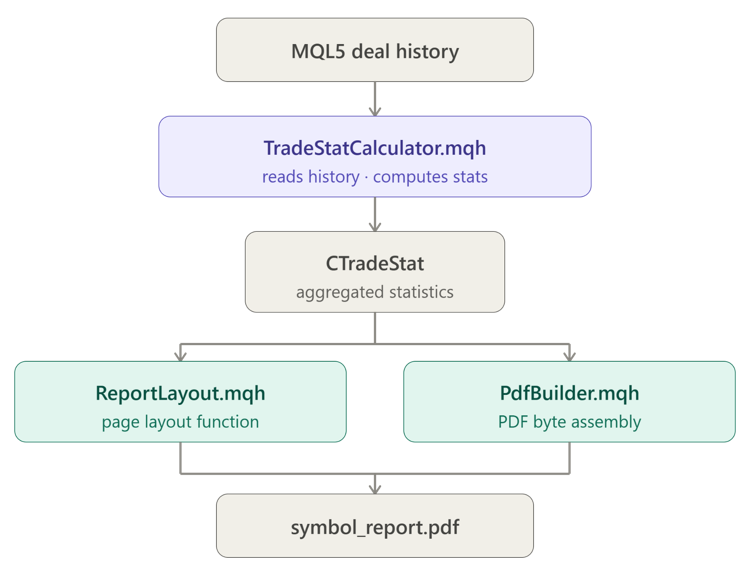
Figure 1: The PDF report generation pipeline.
Why Build the PDF Format Directly
A hand-built PDF removes the two dependencies that alternative approaches share. Calling an external converter through ShellExecute(), whether a headless HTML-to-PDF tool or a scripting-language library, requires that tool to be pre-installed on the machine running the terminal and requires shell execution to be permitted. Using a DLL import requires DLL imports to be enabled in the terminal's settings. Neither can be guaranteed on every machine.
Writing the PDF bytes directly has one real constraint: PDF's cross-reference table records the exact byte offset of every object in the file. If any of those offsets are wrong by even a single byte, most PDF readers will refuse to open the file or silently ignore parts of its content. This constraint is manageable for a single-page document built from text and simple line graphics, which is the scope this article covers.
The Minimal PDF Object Structure
A PDF file is a sequence of numbered objects, each between an N 0 obj marker and an endobj marker, followed by a cross-reference table and a trailer. A minimal single-page document requires exactly five objects.
Object 1 is the Catalog, the document root, which points to the Pages object. Object 2 is the Pages object, which lists the pages in the document. Object 3 is the Page, which specifies the page dimensions through its MediaBox array. This implementation uses [0 0 612 792], the dimensions of a US Letter page in points, where one point equals 1/72 inch. Object 4 declares the font — the built-in Helvetica, which every PDF reader supports without an embedded font file. Object 5 is the Contents stream, which holds the actual drawing instructions, wrapped between stream and endstream keywords, preceded by a /Length value giving the exact byte count of the stream content.
PDF's coordinate system places the origin at the bottom-left corner of the page, with the y-axis increasing upward. Every coordinate in this implementation follows that convention.
The Cross-Reference Table and Byte-Exact Offsets
After the five objects, a PDF file contains a cross-reference table introduced by the xref keyword, listing the exact byte offset from the start of the file to the beginning of each object. Every entry in this table has a fixed width of exactly 20 bytes: a 10-digit zero-padded offset, a space, a 5-digit generation number, a space, the letter n for an in-use object or f for a free entry, a trailing space, and a newline. The very first entry for object zero is always the fixed free-list header 0000000000 65535 f.
After the cross-reference table, a trailer section identifies the total number of objects and the root object. It records the byte offset of the xref keyword in a startxref line, and the file ends with %%EOF.
Computing these offsets requires knowing the exact byte length of every object's text before anything is written to disk. Since all strings here are plain ASCII, StringLen() gives an accurate byte count. The critical requirement is that the file must be opened in binary mode, FILE_BIN, not text mode. MQL5's text mode can silently rewrite \n to \r\n, changing the byte lengths of strings whose offsets were already calculated from their \n form. One extra byte anywhere invalidates the entire cross-reference table.
PDF Content Stream Operators
The content stream uses a compact set of drawing operators. Text is drawn between BT (begin text) and ET (end text) markers. Inside that block, /F1 12 Tf selects the font at 12 points, 1 0 0 1 x y Tm sets an absolute text position using a text matrix, and (some text) Tj draws the string. The characters backslash, opening parenthesis, and closing parenthesis are significant inside PDF string delimiters and must be escaped with a preceding backslash or they corrupt the surrounding syntax.
Vector graphics use path operators. x y m moves the current point. x y l draws a line to that point. S strokes the path. x y w h re describes a rectangle, followed by S to stroke its outline or f to fill it. width w sets the stroke line width. Color is set with r g b RG for stroke color and r g b rg for fill color, where each channel is a decimal in the range 0.0 to 1.0. A multi-point polyline uses one m for the first point, one l per subsequent point, and a single S at the end — drawing the entire equity curve as one connected path in a single stroke operation.
Implementation — TradeStat.mqh
CTradeStat is a plain data struct holding every statistic the report displays, plus the equity curve array. It carries no methods; the computation logic belongs to CTradeStatCalculator, keeping this struct a pure data container that both the calculator and the layout function can read directly.
//+------------------------------------------------------------------+
//|                                                    TradeStat.mqh |
//+------------------------------------------------------------------+
#ifndef TRADESTAT_MQH
#define TRADESTAT_MQH
//+------------------------------------------------------------------+
//| Aggregated trade statistics for one symbol over one date range.  |
//| Populated by CTradeStatCalculator and consumed by the report     |
//| layout function that draws it into a PDF page.                   |
//+------------------------------------------------------------------+
struct CTradeStat
  {
   string            symbol;          // instrument the statistics cover
   datetime          from;            // start of the analyzed date range
   datetime          to;              // end of the analyzed date range
   int               total_trades;    // count of closed trades in range
   int               win_trades;      // count of trades with positive net profit
   int               loss_trades;     // count of trades with negative net profit
   double            win_rate;        // win_trades / total_trades, as a percentage
   double            gross_profit;    // sum of all positive trade net profits
   double            gross_loss;      // sum of all negative trade net profits, as a positive magnitude
   double            net_profit;      // gross_profit - gross_loss
   double            profit_factor;   // gross_profit / gross_loss; -1 means undefined (no losses)
   double            average_win;     // gross_profit / win_trades
   double            average_loss;    // gross_loss / loss_trades, as a positive magnitude
   double            expectancy;      // net_profit / total_trades
   double            max_drawdown;    // largest peak-to-trough decline in the equity curve
   double            equity_curve[];  // cumulative net profit after each closed trade, chronological
  };

#endif // TRADESTAT_MQH
//+------------------------------------------------------------------+
gross_loss and average_loss are stored as positive magnitudes because the label text on the report already conveys that these values represent losses. profit_factor uses a -1.0 sentinel when gross loss is zero and gross profit is positive; otherwise it is set to 0.0. The layout function converts that sentinel to the display text N/A.
Implementation — TradeStatCalculator.mqh
CTradeStatCalculator has two responsibilities kept deliberately separate. Calculate() reads the terminal's deal history and produces a plain array of per-trade net profit values. ComputeFromProfits() takes that array and performs every statistical computation with no dependency on live history at all. This separation means the arithmetic can be verified directly against known synthetic values without needing any closed trades on the account.
Class Declaration
//+------------------------------------------------------------------+
//|                                          TradeStatCalculator.mqh |
//+------------------------------------------------------------------+
#ifndef TRADESTATCALCULATOR_MQH
#define TRADESTATCALCULATOR_MQH

#include "TradeStat.mqh"
//+------------------------------------------------------------------+
//| Reads closed-trade history for one symbol and computes summary   |
//| statistics. Separates history reading (Calculate) from the pure  |
//| numeric computation (ComputeFromProfits) so the math can be      |
//| tested directly with synthetic data, without any live history.   |
//+------------------------------------------------------------------+
class CTradeStatCalculator
  {
private:
   string            m_symbol;  // symbol filter
   long              m_magic;   // magic filter; 0 = all magic numbers

   double            GetTradeNetProfit(ulong exit_ticket) const;

public:
                     CTradeStatCalculator(void);
                    ~CTradeStatCalculator(void);

   void              Init(const string &symbol, long magic);
   bool              Calculate(datetime from, datetime to, CTradeStat &stat);
   bool              ComputeFromProfits(const double &profits[], int count,
                                     CTradeStat &stat) const;
  };
m_symbol and m_magic are stored as private members and set through Init() before Calculate() is called. GetTradeNetProfit() is private because it is only ever called from within Calculate() during the deal iteration loop.
Constructor and Destructor
//+------------------------------------------------------------------+
//| Constructor — initializes filter fields to neutral values.       |
//+------------------------------------------------------------------+
CTradeStatCalculator::CTradeStatCalculator(void)
  {
   m_symbol = "";
   m_magic  = 0;
  }
//+------------------------------------------------------------------+
//| Destructor — no heap resources to release.                       |
//+------------------------------------------------------------------+
CTradeStatCalculator::~CTradeStatCalculator(void)
  {
//--- CTradeStatCalculator owns no dynamically allocated objects
  }
Both filter fields default to their accept-all values — an empty symbol string and a zero magic number — so calling Calculate() without first calling Init() does not produce undefined behavior, though it would also produce no useful results. The destructor has no work to do because the class holds only primitive members that MQL5 manages automatically.
Init()
//+------------------------------------------------------------------+
//| Stores the symbol and magic filter used by Calculate().          |
//+------------------------------------------------------------------+
void CTradeStatCalculator::Init(const string &symbol, long magic)
  {
   m_symbol = symbol;
   m_magic  = magic;
  }
Init() accepts a symbol string and a magic number and stores both as member variables. The magic number filter allows a trader to restrict the statistics to trades opened by a specific EA; setting it to zero disables the filter and includes all trades on that symbol regardless of which EA or manual operation opened them.
GetTradeNetProfit()
//+------------------------------------------------------------------+
//| Returns the net profit for one closed trade's exit deal, summing |
//| profit, swap, and commission recorded on that deal. Commission   |
//| attribution varies by broker; this implementation reads whatever |
//| is recorded on the exit deal itself, which is the common case.   |
//+------------------------------------------------------------------+
double CTradeStatCalculator::GetTradeNetProfit(ulong exit_ticket) const
  {
   double profit     = ::HistoryDealGetDouble(exit_ticket, DEAL_PROFIT);
   double swap       = ::HistoryDealGetDouble(exit_ticket, DEAL_SWAP);
   double commission = ::HistoryDealGetDouble(exit_ticket, DEAL_COMMISSION);
   return(profit + swap + commission);
  }
HistoryDealGetDouble() retrieves a floating-point property from a deal record that has already been selected into history. DEAL_PROFIT is the raw price-movement profit or loss for the trade. DEAL_SWAP is the overnight financing cost or credit accumulated while the position was open. DEAL_COMMISSION is the broker's trading fee. All three are summed because a trade's true economic result includes all three components; reporting only DEAL_PROFIT would misstate the net result on accounts where swap or commission is non-trivial.
Calculate()
//+------------------------------------------------------------------+
//| Selects history and gathers one net-profit value per closed      |
//| trade, in chronological order, then delegates to                 |
//| ComputeFromProfits() for the actual statistics.                  |
//+------------------------------------------------------------------+
bool CTradeStatCalculator::Calculate(datetime from, datetime to, CTradeStat &stat)
  {
   if(!::HistorySelect(from, to))
     {
      ::Print("CTradeStatCalculator::Calculate: HistorySelect failed");
      return(false);
     }

   int total_deals = (int)::HistoryDealsTotal();
   double profits[];
   int    count = 0;
   ::ArrayResize(profits, total_deals);

//--- deals are returned in chronological order, so profits[] naturally
//--- preserves the correct order for the equity curve without sorting
   for(int i = 0; i < total_deals; i++)
     {
      ulong ticket = ::HistoryDealGetTicket(i);
      if(ticket == 0)
         continue;

      if(::HistoryDealGetString(ticket, DEAL_SYMBOL) != m_symbol)
         continue; // does not match the requested symbol

      if(m_magic != 0 &&
         ::HistoryDealGetInteger(ticket, DEAL_MAGIC) != m_magic)
         continue; // does not match the configured magic filter

      ENUM_DEAL_ENTRY entry =
         (ENUM_DEAL_ENTRY)::HistoryDealGetInteger(ticket, DEAL_ENTRY);

      if(entry != DEAL_ENTRY_OUT && entry != DEAL_ENTRY_INOUT)
         continue; // only exit deals represent a completed trade

      profits[count] = GetTradeNetProfit(ticket);
      count++;
     }

   ::ArrayResize(profits, count);

   stat.symbol = m_symbol;
   stat.from   = from;
   stat.to     = to;

   return(ComputeFromProfits(profits, count, stat));
  }
HistorySelect() loads deal records for the requested date range into the terminal's history buffer, making them accessible through subsequent HistoryDeal* calls. HistoryDealsTotal() returns the count of deals now in that buffer. HistoryDealGetTicket() retrieves the ticket number for a deal by its sequential index. HistoryDealGetString() with DEAL_SYMBOL retrieves the symbol the deal was executed on. HistoryDealGetInteger() with DEAL_MAGIC retrieves the magic number, and with DEAL_ENTRY retrieves the deal's entry type.
The DEAL_ENTRY check is the most important filter. Every position generates at least two deals: an entry deal (DEAL_ENTRY_IN) when the position opens, and an exit deal (DEAL_ENTRY_OUT) when it closes. Counting entry deals as trades would double the trade count and assign profit where there is none. DEAL_ENTRY_INOUT covers the special case where a position closes and immediately reverses direction in a single deal; that deal still represents a completed trade from the perspective of the position that just closed.
The terminal returns deals in chronological order by time, so iterating them from index 0 to total_deals - 1 naturally produces a profits array in the correct time sequence for building the equity curve without any explicit sorting step.
ComputeFromProfits()
//+------------------------------------------------------------------+
//| Computes every summary statistic from a plain array of per-trade |
//| net profit values. Pure computation with no file or history      |
//| access, which makes it directly testable with synthetic data.    |
//+------------------------------------------------------------------+
bool CTradeStatCalculator::ComputeFromProfits(const double &profits[], int count,
      CTradeStat &stat) const
  {
   stat.total_trades = count;
   stat.win_trades    = 0;
   stat.loss_trades   = 0;
   stat.gross_profit  = 0.0;
   stat.gross_loss    = 0.0;

   ::ArrayResize(stat.equity_curve, count);
   double running = 0.0;

   for(int i = 0; i < count; i++)
     {
      double p = profits[i];
      running += p;
      stat.equity_curve[i] = running;

      if(p > 0.0)
        {
         stat.win_trades++;
         stat.gross_profit += p;
        }
      else
         if(p < 0.0)
           {
            stat.loss_trades++;
            stat.gross_loss += -p; // stored as a positive magnitude
           }
     }

   stat.net_profit = stat.gross_profit - stat.gross_loss;

//--- profit factor is undefined when there are no losing trades;
//--- -1 is used as a sentinel the report layout renders as "N/A"
   if(stat.gross_loss > 0.0)
      stat.profit_factor = stat.gross_profit / stat.gross_loss;
   else
      if(stat.gross_profit > 0.0)
         stat.profit_factor = -1.0;
      else
         stat.profit_factor = 0.0;

   stat.win_rate     = (count > 0) ? (100.0 * stat.win_trades / count) : 0.0;
   stat.average_win  = (stat.win_trades  > 0) ? (stat.gross_profit / stat.win_trades)  : 0.0;
   stat.average_loss = (stat.loss_trades > 0) ? (stat.gross_loss   / stat.loss_trades) : 0.0;
   stat.expectancy   = (count > 0) ? (stat.net_profit / count) : 0.0;

//--- scan the equity curve for the largest peak-to-trough decline
   double peak = 0.0;
   double max_dd = 0.0;
   for(int i = 0; i < count; i++)
     {
      if(stat.equity_curve[i] > peak)
         peak = stat.equity_curve[i];
      double drawdown = peak - stat.equity_curve[i];
      if(drawdown > max_dd)
         max_dd = drawdown;
     }
   stat.max_drawdown = max_dd;

   return(true);
  }
The single loop through profits[] serves three purposes at once: it builds the running equity curve by accumulating each profit into running, it classifies each trade as a win or a loss, and it accumulates gross_profit and gross_loss simultaneously. This means one pass through the data computes everything needed for the equity curve array and the gross figures from which all ratio statistics are derived.
gross_loss is accumulated as a positive magnitude by negating each losing trade's negative value (-p). This keeps subsequent ratio computations simple since profit factor, average loss, and expectancy can all be expressed as straightforward divisions without sign adjustments. Every ratio-based statistic uses a conditional expression to guard against division by zero in the case where there are no wins, no losses, or no trades at all.
Profit factor is undefined when gross_loss is zero, because dividing by zero produces no economically meaningful number. Rather than returning infinity or a very large number, the implementation stores the sentinel value -1.0 and delegates the display decision to the layout function, which renders it as the string "N/A". If both gross_profit and gross_loss are zero — a history of only breakeven trades — profit factor is stored as 0.0 since there is genuinely no trading edge to express.
The maximum drawdown scan makes a second pass through the equity curve. It tracks a running peak (the highest equity value seen so far) and at each point computes the current decline from that peak. The largest such decline across the entire history becomes max_drawdown. Because the peak starts at 0.0, representing the account's starting point before any trades, a history where every trade was profitable still correctly reports a drawdown of zero.
Implementation — PdfBuilder.mqh
CPdfBuilder accumulates content-stream operators in a private string. It assembles a complete, valid PDF file in Save(). It exposes drawing methods and color setters, none of which involve file I/O — all file writing happens exactly once inside Save(). This design means the content can be built incrementally by the layout function and the final file assembly is one controlled, atomic operation.
Class Declaration
//+------------------------------------------------------------------+
//|                                                    PdfBuilder.mqh|
//+------------------------------------------------------------------+
#ifndef PDFBUILDER_MQH
#define PDFBUILDER_MQH
//+------------------------------------------------------------------+
//| Builds a single-page PDF file from scratch using only string     |
//| concatenation and MQL5's file API. No external library or DLL is |
//| required; the PDF format for a simple text-and-vector-graphics   |
//| page is a well-documented, plain-text object structure that can  |
//| be assembled directly. Coordinates use the PDF convention: the   |
//| origin is the bottom-left corner of the page, with y increasing  |
//| upward. The default page size is US Letter, 612 x 792 points.    |
//+------------------------------------------------------------------+
class CPdfBuilder
  {
private:
   string            m_content;      // accumulated content-stream operators for the page

   string            EscapePdfString(const string &s) const;
   string            Pad10(long value) const;

public:
                     CPdfBuilder(void);
                    ~CPdfBuilder(void);

   void              Clear(void);
   void              SetLineWidth(double width);
   void              SetStrokeColor(double r, double g, double b);
   void              SetFillColor(double r, double g, double b);
   void              DrawText(double x, double y, int font_size, const string text);
   void              DrawLine(double x1, double y1, double x2, double y2);
   void              DrawRect(double x, double y, double width, double height, bool filled);
   void              DrawPolyline(const double &xs[], const double &ys[], int count);
   bool              Save(const string &filename);
  };
m_content is the single private string that accumulates every drawing operator. All public drawing methods append to it; the final PDF is assembled only in Save(). All string parameters are declared as const string (pass by value) rather than const string & (pass by reference). MQL5's const string & reference parameter can only bind to a named variable in memory; it cannot bind to a temporary string produced by an expression such as "Symbol: " + stat.symbol. Passing by value accepts both named variables and temporary expressions at the call site without any restriction or intermediate variable.
Constructor and Destructor
//+------------------------------------------------------------------+
//| Constructor — starts with an empty content stream.               |
//+------------------------------------------------------------------+
CPdfBuilder::CPdfBuilder(void)
  {
   m_content = "";
  }
//+------------------------------------------------------------------+
//| Destructor — no heap resources to release.                       |
//+------------------------------------------------------------------+
CPdfBuilder::~CPdfBuilder(void)
  {
//--- m_content is an MQL5-managed string; released automatically
  }
The constructor sets m_content to an empty string so the builder starts in a clean state. MQL5 manages string memory automatically, so the destructor has nothing to release.
Clear()
//+------------------------------------------------------------------+
//| Resets the content stream so the same builder can start a new    |
//| page from a clean state.                                         |
//+------------------------------------------------------------------+
void CPdfBuilder::Clear(void)
  {
   m_content = "";
  }
Clear() empties the accumulated content stream. It exists so a single CPdfBuilder instance can be reused across multiple Save() calls — for example, in a loop generating one report per symbol — without the overhead of constructing and destroying a new object each time.
EscapePdfString() and Pad10()
//+------------------------------------------------------------------+
//| Escapes the three characters that are significant inside a PDF   |
//| literal string: backslash, opening parenthesis, closing          |
//| parenthesis. Without this, a symbol comment or label containing  |
//| one of these characters would corrupt the surrounding PDF syntax.|
//+------------------------------------------------------------------+
string CPdfBuilder::EscapePdfString(const string &s) const
  {
   string r = s;
   ::StringReplace(r, "\\", "\\\\"); // backslash must be escaped first
   ::StringReplace(r, "(",  "\\(");
   ::StringReplace(r, ")",  "\\)");
   return(r);
  }
//+------------------------------------------------------------------+
//| Formats a byte offset as a zero-padded 10-digit decimal string,  |
//| the fixed width the PDF cross-reference table requires for every |
//| entry so each xref line is exactly 20 bytes long.                |
//+------------------------------------------------------------------+
string CPdfBuilder::Pad10(long value) const
  {
   return(::StringFormat("%010d", value));
  }
StringReplace() replaces all occurrences of one substring with another within a given string. The backslash replacement must come first: the substitution for parentheses inserts a new backslash character as the escape prefix, and if backslashes were escaped last, those newly inserted backslashes would be double-escaped, corrupting the string. StringFormat() with the %010d format specifier produces a decimal integer zero-padded to exactly 10 digits, which is the fixed width the PDF cross-reference table specification requires for every byte offset entry.
SetLineWidth(), SetStrokeColor(), and SetFillColor()
//+------------------------------------------------------------------+
//| Appends a line-width operator to the content stream.             |
//+------------------------------------------------------------------+
void CPdfBuilder::SetLineWidth(double width)
  {
   m_content += ::DoubleToString(width, 2) + " w\n";
  }
//+------------------------------------------------------------------+
//| Sets the stroke (outline) color using the PDF RG operator.       |
//| All three channels are in the 0.0-1.0 range (not 0-255).         |
//+------------------------------------------------------------------+
void CPdfBuilder::SetStrokeColor(double r, double g, double b)
  {
   m_content += ::DoubleToString(r, 3) + " " + ::DoubleToString(g, 3) + " "
                + ::DoubleToString(b, 3) + " RG\n";
  }
//+------------------------------------------------------------------+
//| Sets the fill color using the PDF rg operator.                   |
//| All three channels are in the 0.0-1.0 range (not 0-255).         |
//+------------------------------------------------------------------+
void CPdfBuilder::SetFillColor(double r, double g, double b)
  {
   m_content += ::DoubleToString(r, 3) + " " + ::DoubleToString(g, 3) + " "
                + ::DoubleToString(b, 3) + " rg\n";
  }
DoubleToString() converts a floating-point value to a string with a specified number of decimal places. All three methods simply format their operands and append the corresponding PDF operator to m_content. The operators themselves are single ASCII letters: w for line width, RG (uppercase) for stroke color, and rg (lowercase) for fill color. PDF treats the stroke and fill color as two separate components of the graphics state, so a call to SetStrokeColor() does not affect the fill color and vice versa.
DrawText()
//+------------------------------------------------------------------+
//| Appends a text-drawing block using the page's Helvetica font.    |
//| Uses an absolute text matrix (Tm) rather than relative movement  |
//| (Td) so each call positions independently of any previous call.  |
//+------------------------------------------------------------------+
void CPdfBuilder::DrawText(double x, double y, int font_size, const string text)
  {
   string escaped = EscapePdfString(text);
   m_content += "BT\n";
   m_content += "/F1 " + ::IntegerToString(font_size) + " Tf\n";
   m_content += "1 0 0 1 " + ::DoubleToString(x, 2) + " " + ::DoubleToString(y, 2) + " Tm\n";
   m_content += "(" + escaped + ") Tj\n";
   m_content += "ET\n";
  }
IntegerToString() converts an integer to its decimal string representation. The text block opens with BT and closes with ET. Inside, /F1 references the font declared in PDF object 4, and Tf selects it at the given point size. The text matrix 1 0 0 1 x y Tm is the identity scale and rotation with a translation to the desired position — it sets the text drawing origin to (x, y) in page coordinates without any scaling or rotation applied. Tj then draws the escaped string at that position. The BT/ET wrappers are required by the PDF specification; text operators are only valid inside a text object.
DrawLine()
//+------------------------------------------------------------------+
//| Appends a single stroked line segment.                           |
//+------------------------------------------------------------------+
void CPdfBuilder::DrawLine(double x1, double y1, double x2, double y2)
  {
   m_content += ::DoubleToString(x1, 2) + " " + ::DoubleToString(y1, 2) + " m\n";
   m_content += ::DoubleToString(x2, 2) + " " + ::DoubleToString(y2, 2) + " l\n";
   m_content += "S\n";
  }
The m operator moves the current point to (x1, y1) and begins a new path. The l operator extends that path with a straight line to (x2, y2). The S operator strokes the path, drawing it as a visible line using the current stroke color and line width. This three-operator sequence is the minimal way to draw a single straight segment in a PDF content stream.
DrawRect()
//+------------------------------------------------------------------+
//| Appends a rectangle, either stroked as an outline or filled.     |
//+------------------------------------------------------------------+
void CPdfBuilder::DrawRect(double x, double y, double width, double height, bool filled)
  {
   m_content += ::DoubleToString(x, 2) + " " + ::DoubleToString(y, 2) + " "
                + ::DoubleToString(width, 2) + " " + ::DoubleToString(height, 2) + " re\n";
   m_content += filled ? "f\n" : "S\n";
  }
The re operator describes a complete rectangle path in a single step, taking the bottom-left corner coordinates followed by width and height. Following it with f fills the rectangle's interior with the current fill color, while S strokes only its outline with the current stroke color and line width. The filled parameter lets the same method serve both purposes: stroked rectangles draw borders, and filled rectangles draw backgrounds.
DrawPolyline()
//+------------------------------------------------------------------+
//| Appends a connected multi-segment line through every point in    |
//| xs[]/ys[] as a single path, drawn with one moveto followed by a  |
//| lineto per remaining point and a single stroke operator. Used to |
//| render the equity curve as one continuous line.                  |
//+------------------------------------------------------------------+
void CPdfBuilder::DrawPolyline(const double &xs[], const double &ys[], int count)
  {
   if(count < 2)
      return; // need at least two points to draw a line

   m_content += ::DoubleToString(xs[0], 2) + " " + ::DoubleToString(ys[0], 2) + " m\n";
   for(int i = 1; i < count; i++)
      m_content += ::DoubleToString(xs[i], 2) + " " + ::DoubleToString(ys[i], 2) + " l\n";
   m_content += "S\n";
  }
The first point is introduced with m (moveto) to start the path. Every subsequent point is added with l (lineto), extending the path by one straight segment. A single S at the end strokes the entire accumulated path as one continuous line. Because the equity curve can have many dozens or hundreds of points, generating the entire path before stroking it is both more efficient and more correct than stroking each segment separately, which would produce a sequence of disconnected sub-paths rather than a smooth connected line.
Save()
//+------------------------------------------------------------------+
//| Assembles the complete PDF file from the accumulated content     |
//| stream and writes it to disk. Builds five fixed objects (Catalog,|
//| Pages, Page, Font, Contents), tracks each object's exact byte    |
//| offset as it is assembled, then writes a cross-reference table   |
//| and trailer that reference those offsets precisely. The file is  |
//| written in FILE_BIN mode specifically so no newline translation  |
//| occurs; any translation would silently invalidate every offset   |
//| computed here, since MQL5 text mode can rewrite \n to \r\n.      |
//+------------------------------------------------------------------+
bool CPdfBuilder::Save(const string &filename)
  {
   string header = "%PDF-1.4\n";

   string obj1 = "1 0 obj\n<< /Type /Catalog /Pages 2 0 R >>\nendobj\n";
   string obj2 = "2 0 obj\n<< /Type /Pages /Kids [3 0 R] /Count 1 >>\nendobj\n";
   string obj3 = "3 0 obj\n<< /Type /Page /Parent 2 0 R /MediaBox [0 0 612 792] "
                 "/Resources << /Font << /F1 4 0 R >> >> /Contents 5 0 R >>\nendobj\n";
   string obj4 = "4 0 obj\n<< /Type /Font /Subtype /Type1 /BaseFont /Helvetica >>\nendobj\n";
   string obj5 = "5 0 obj\n<< /Length " + ::IntegerToString(::StringLen(m_content))
                 + " >>\nstream\n" + m_content + "\nendstream\nendobj\n";

//--- track the byte offset of each object as it would appear in the
//--- final assembled file, starting immediately after the header
   long offset1 = ::StringLen(header);
   long offset2 = offset1 + ::StringLen(obj1);
   long offset3 = offset2 + ::StringLen(obj2);
   long offset4 = offset3 + ::StringLen(obj3);
   long offset5 = offset4 + ::StringLen(obj4);
   long xref_offset = offset5 + ::StringLen(obj5);

//--- the cross-reference table: one free entry for object 0, then one
//--- entry per real object; every line must be exactly 20 bytes
   string xref = "xref\n0 6\n";
   xref += "0000000000 65535 f \n";
   xref += Pad10(offset1) + " 00000 n \n";
   xref += Pad10(offset2) + " 00000 n \n";
   xref += Pad10(offset3) + " 00000 n \n";
   xref += Pad10(offset4) + " 00000 n \n";
   xref += Pad10(offset5) + " 00000 n \n";

   string trailer = "trailer\n<< /Size 6 /Root 1 0 R >>\nstartxref\n"
                    + ::IntegerToString(xref_offset) + "\n%%EOF";

   string full_file = header + obj1 + obj2 + obj3 + obj4 + obj5 + xref + trailer;

   int handle = ::FileOpen(filename, FILE_WRITE | FILE_BIN | FILE_ANSI);
   if(handle == INVALID_HANDLE)
     {
      ::PrintFormat("CPdfBuilder::Save: cannot open '%s', error %d",
                    filename, ::GetLastError());
      return(false);
     }

   ::FileWriteString(handle, full_file);
   ::FileClose(handle);

   ::PrintFormat("CPdfBuilder::Save: wrote %d bytes to %s",
                 ::StringLen(full_file), filename);
   return(true);
  }
Save() first builds each of the five fixed PDF object strings. Object 5 embeds m_content as the page's content stream, preceded by /Length set to StringLen(m_content). This length value must be computed from m_content before it is embedded into the object string, because once embedded, the object string is longer than m_content alone.
The byte offsets are computed by running StringLen() on each already-assembled object string and accumulating a running total. offset1 is where object 1 begins — immediately after the header. offset2 is where object 2 begins — after the header plus the length of object 1. And so on. xref_offset is where the cross-reference table begins — after all five objects. These calculations are done before anything is written to disk, so every offset in the cross-reference table is exact when the table is built.
FileOpen() opens the output file. FILE_WRITE | FILE_BIN | FILE_ANSI creates or overwrites the file in binary mode, which guarantees that FileWriteString() writes exactly the bytes present in full_file with no newline translation. FileClose() flushes the write buffer and releases the file handle.
Implementation — ReportLayout.mqh
ReportLayout.mqh contains one free function, BuildReportContent(), that lays out the complete report page using CPdfBuilder's drawing primitives and the values in a CTradeStat. It is shared between the production script and the verification script, so any change to the layout is automatically exercised by the test without requiring a separate code path for test mode.
Two layout decisions are worth explaining in detail before the code.
The first is the position of the statistics border rectangle. The "Summary Statistics" heading is drawn as a section label sitting visibly above the bordered box, not inside it. To achieve this, stats_top is captured from the current y coordinate before drawing the heading, not after. The border rect's top edge therefore sits above the heading's baseline, leaving the heading entirely outside the box. Capturing stats_top after the heading — as would happen if the lines were written in the natural top-to-bottom order — places the rect's top edge only a few points above the heading baseline. With a 13-point font, the cap-height of letters such as S, T, and U extends above the baseline by roughly the font size, so the border line would visually cut through the top of the letters, making the heading appear clipped. Capturing stats_top first avoids this.
The second is the chart background. PDF's default drawing color is black for all operations, and the page background is white by convention with no explicit fill. Without a fill, the chart area is indistinguishable from the surrounding white space and the equity curve is just another black line on the page. Setting an explicit light grey fill for the chart box before drawing the curve gives the chart area a visible boundary and makes the colored equity curve stand out clearly against it.
//+------------------------------------------------------------------+
//|                                                 ReportLayout.mqh |
//+------------------------------------------------------------------+
#ifndef REPORTLAYOUT_MQH
#define REPORTLAYOUT_MQH

#include "TradeStat.mqh"
#include "PdfBuilder.mqh"
//+------------------------------------------------------------------+
//| Formats a value that may be undefined (sentinel -1.0) as "N/A",  |
//| used for profit factor when there have been no losing trades.    |
//+------------------------------------------------------------------+
string FormatMaybeUndefined(double value, int digits)
  {
   if(value < 0.0)
      return("N/A");
   return(::DoubleToString(value, digits));
  }
//+------------------------------------------------------------------+
//| Draws the complete report page into PDF using the values in      |
//| stat. This function is shared between SymbolTradeReport.mq5,     |
//| which supplies statistics computed from live history, and        |
//| TestPdfReport.mq5, which supplies hand-built synthetic values,   |
//| guaranteeing both produce structurally identical PDF layouts.    |
//+------------------------------------------------------------------+
void BuildReportContent(CPdfBuilder &pdf, const CTradeStat &stat,
                        const string generated_at)
  {
   double left   = 72.0;  // 1 inch left margin
   double top    = 750.0; // near the top of a 792-point-tall page
   double line_h = 16.0;  // vertical spacing between text lines
   double y      = top;

//--- title and metadata block
   pdf.DrawText(left, y, 18, "Trade Analytics Report");
   y -= line_h * 1.5;

   string period = "Period: " +
                   ::TimeToString(stat.from, TIME_DATE) + " - " +
                   ::TimeToString(stat.to,   TIME_DATE);
   pdf.DrawText(left, y, 11, "Symbol: " + stat.symbol);
   pdf.DrawText(left + 220, y, 11, period);
   y -= line_h;
   pdf.DrawText(left, y, 9, "Generated: " + generated_at);
   y -= line_h * 1.5;

//--- "Summary Statistics" heading sits ABOVE the bordered box;
//--- stats_top is captured BEFORE drawing the heading so the border
//--- rect encloses only the data rows, not the section label itself.
//--- Previously stats_top was set after the heading, which placed the
//--- rect's top edge only 8 points above the last heading baseline,
//--- causing the 13-point cap-height to clip against the border line.
   double stats_top = y - line_h * 0.3; // 5 pts of breathing room above first row
   pdf.DrawText(left, y, 13, "Summary Statistics");
   y -= line_h * 1.2; // larger gap between heading and first data row

   double value_x = left + 220;

   pdf.DrawText(left, y, 10, "Total Trades");
   pdf.DrawText(value_x, y, 10, ::IntegerToString(stat.total_trades));
   y -= line_h;

   pdf.DrawText(left, y, 10, "Winning Trades");
   pdf.DrawText(value_x, y, 10, ::IntegerToString(stat.win_trades));
   y -= line_h;

   pdf.DrawText(left, y, 10, "Losing Trades");
   pdf.DrawText(value_x, y, 10, ::IntegerToString(stat.loss_trades));
   y -= line_h;

   pdf.DrawText(left, y, 10, "Win Rate");
   pdf.DrawText(value_x, y, 10, ::DoubleToString(stat.win_rate, 1) + " %");
   y -= line_h;

   pdf.DrawText(left, y, 10, "Gross Profit");
   pdf.DrawText(value_x, y, 10, ::DoubleToString(stat.gross_profit, 2));
   y -= line_h;

   pdf.DrawText(left, y, 10, "Gross Loss");
   pdf.DrawText(value_x, y, 10, ::DoubleToString(stat.gross_loss, 2));
   y -= line_h;

   pdf.DrawText(left, y, 10, "Net Profit");
   pdf.DrawText(value_x, y, 10, ::DoubleToString(stat.net_profit, 2));
   y -= line_h;

   pdf.DrawText(left, y, 10, "Profit Factor");
   pdf.DrawText(value_x, y, 10, FormatMaybeUndefined(stat.profit_factor, 2));
   y -= line_h;

   pdf.DrawText(left, y, 10, "Average Win");
   pdf.DrawText(value_x, y, 10, ::DoubleToString(stat.average_win, 2));
   y -= line_h;

   pdf.DrawText(left, y, 10, "Average Loss");
   pdf.DrawText(value_x, y, 10, ::DoubleToString(stat.average_loss, 2));
   y -= line_h;

   pdf.DrawText(left, y, 10, "Expectancy per Trade");
   pdf.DrawText(value_x, y, 10, ::DoubleToString(stat.expectancy, 2));
   y -= line_h;

   pdf.DrawText(left, y, 10, "Max Drawdown");
   pdf.DrawText(value_x, y, 10, ::DoubleToString(stat.max_drawdown, 2));
   y -= line_h * 0.75;

//--- border rect drawn after the rows so it renders on top of nothing;
//--- the rect now wraps only the data rows, with the section heading
//--- sitting visibly above it as intended
   double stats_bottom = y;
   pdf.SetLineWidth(0.5);
   pdf.DrawRect(left - 8, stats_bottom, 468,
                stats_top - stats_bottom + line_h, false);

   y -= line_h * 2.0;

//--- equity curve section
   pdf.DrawText(left, y, 13, "Equity Curve");
   y -= line_h;

   double chart_x = left;
   double chart_w = 468.0;
   double chart_h = 160.0;
   double chart_y = y - chart_h;

//--- light grey chart background for visual contrast
   pdf.SetFillColor(0.96, 0.96, 0.97);
   pdf.DrawRect(chart_x, chart_y, chart_w, chart_h, true);

//--- chart border in mid-grey
   pdf.SetStrokeColor(0.70, 0.70, 0.72);
   pdf.SetLineWidth(0.5);
   pdf.DrawRect(chart_x, chart_y, chart_w, chart_h, false);

   int n = ::ArraySize(stat.equity_curve);
   if(n >= 2)
     {
      //--- find the value range, always including zero so the zero line
      //--- is meaningful even if every trade was profitable or every
      //--- trade was a loss
      double min_v = 0.0;
      double max_v = 0.0;
      for(int i = 0; i < n; i++)
        {
         if(stat.equity_curve[i] < min_v)
            min_v = stat.equity_curve[i];
         if(stat.equity_curve[i] > max_v)
            max_v = stat.equity_curve[i];
        }
      double range = max_v - min_v;
      if(range <= 0.0)
         range = 1.0; // guard against a flat curve producing a divide by zero

      //--- zero reference line in light grey
      double zero_y = chart_y + ((0.0 - min_v) / range) * chart_h;
      pdf.SetStrokeColor(0.75, 0.75, 0.77);
      pdf.SetLineWidth(0.4);
      pdf.DrawLine(chart_x, zero_y, chart_x + chart_w, zero_y);

      //--- map every equity curve point into the chart's coordinate box
      double xs[];
      double ys[];
      ::ArrayResize(xs, n);
      ::ArrayResize(ys, n);
      for(int i = 0; i < n; i++)
        {
         xs[i] = chart_x + (chart_w * i) / (n - 1);
         ys[i] = chart_y + ((stat.equity_curve[i] - min_v) / range) * chart_h;
        }

      //--- equity curve line in a strong teal blue
      pdf.SetStrokeColor(0.09, 0.53, 0.78);
      pdf.SetLineWidth(1.5);
      pdf.DrawPolyline(xs, ys, n);

      //--- reset stroke to black for anything drawn after
      pdf.SetStrokeColor(0.0, 0.0, 0.0);
      pdf.SetFillColor(0.0, 0.0, 0.0);
     }
  }

#endif // REPORTLAYOUT_MQH
//+------------------------------------------------------------------+
BuildReportContent() lays out the page top-to-bottom, tracking a single y variable that decrements after each element is drawn. Because PDF's coordinate system has y increasing upward from the bottom of the page, "drawing downward" means decreasing y values. The title is placed first at y = 750, well within the 792-point page height. The metadata rows follow, then the statistics block.
Each statistics row places its label at left and its value at value_x = left + 220. The values are formatted with DoubleToString() to two decimal places for currency amounts and one decimal place for win rate, and with IntegerToString() for count fields. Profit factor uses FormatMaybeUndefined() to convert the -1.0 sentinel to the string "N/A".
The chart's coordinate mapping uses linear interpolation. xs[i] distributes the data points evenly across the chart width, and ys[i] maps each equity value from the [min_v, max_v] range proportionally into the [chart_y, chart_y + chart_h] pixel range. The formula (stat.equity_curve[i] - min_v) / range produces a value between 0.0 and 1.0, and multiplying by chart_h converts that fraction into a pixel offset from the chart's bottom edge. ArrayResize() allocates the xs and ys arrays to exactly n elements before the mapping loop fills them.
Implementation — SymbolTradeReport.mq5
The user-facing script ties all four include files together: it resolves its input parameters, calls CTradeStatCalculator to compute the statistics, calls BuildReportContent() to populate the PDF builder, and calls Save() to write the finished file.
//+------------------------------------------------------------------+
//|                                           SymbolTradeReport.mq5  |
//+------------------------------------------------------------------+

#property script_show_inputs

//--- Includes
#include <Pdfreport/TradeStat.mqh>
#include <Pdfreport/TradeStatCalculator.mqh>
#include <Pdfreport/PdfBuilder.mqh>
#include <Pdfreport/ReportLayout.mqh>

//--- Inputs
input string   InpSymbol         = "";   // Symbol (empty = current chart symbol)
input long     InpMagic          = 0;    // Magic filter (0 = all magic numbers)
input datetime InpFrom           = 0;    // Start date (0 = earliest available)
input datetime InpTo             = 0;    // End date (0 = now)
input string   InpOutputFilename = "";   // Output filename (empty = <symbol>_report.pdf)

//+------------------------------------------------------------------+
//| Script entry point: compute statistics and write the PDF report. |
//+------------------------------------------------------------------+
void OnStart()
  {
//--- resolve defaults
   string symbol = (InpSymbol == "") ? _Symbol : InpSymbol;
   datetime from = InpFrom;
   datetime to   = (InpTo == 0) ? ::TimeCurrent() : InpTo;

   if(from >= to)
     {
      ::PrintFormat("SymbolTradeReport: invalid range - from (%s) must be before to (%s).",
                    ::TimeToString(from), ::TimeToString(to));
      return;
     }

   string filename = (InpOutputFilename == "")
                     ? (symbol + "_report.pdf")
                     : InpOutputFilename;

   uint t_start = ::GetTickCount();

//--- compute statistics from live history
   CTradeStatCalculator calc;
   calc.Init(symbol, InpMagic);

   CTradeStat stat;
   if(!calc.Calculate(from, to, stat))
     {
      ::Print("SymbolTradeReport: statistics calculation failed. Check the Experts tab.");
      return;
     }

   if(stat.total_trades == 0)
     {
      ::PrintFormat("SymbolTradeReport: no closed trades found for %s in the given range.",
                    symbol);
      return;
     }

//--- lay out the report page using the shared layout function and
//--- write the finished PDF to disk
   string generated_at = ::TimeToString(::TimeCurrent(),
                                        TIME_DATE | TIME_MINUTES | TIME_SECONDS);

   CPdfBuilder pdf;
   BuildReportContent(pdf, stat, generated_at);

   if(!pdf.Save(filename))
     {
      ::Print("SymbolTradeReport: PDF write failed. Check the Experts tab for details.");
      return;
     }

   uint elapsed = ::GetTickCount() - t_start;
   ::PrintFormat("SymbolTradeReport: %s - %d trades, net %.2f, win rate %.1f%%. "
                 "Report: MQL5/Files/%s (%d ms)",
                 symbol, stat.total_trades, stat.net_profit, stat.win_rate,
                 filename, elapsed);
  }
//+------------------------------------------------------------------+
_Symbol is a built-in MQL5 predefined variable that holds the symbol of the chart the script is attached to. TimeCurrent() returns the current server time as a datetime value. GetTickCount() returns the number of milliseconds elapsed since the system started, used here to measure the total time taken from the start of calculation to the completion of the file write. TimeToString() with TIME_DATE | TIME_MINUTES | TIME_SECONDS produces the timestamp in YYYY.MM.DD HH:MM:SS format, which is embedded in the report as the generated-at timestamp. The final PrintFormat() logs a one-line summary to the Experts tab so the trader can confirm the trade count and net profit match their expectations before opening the PDF.
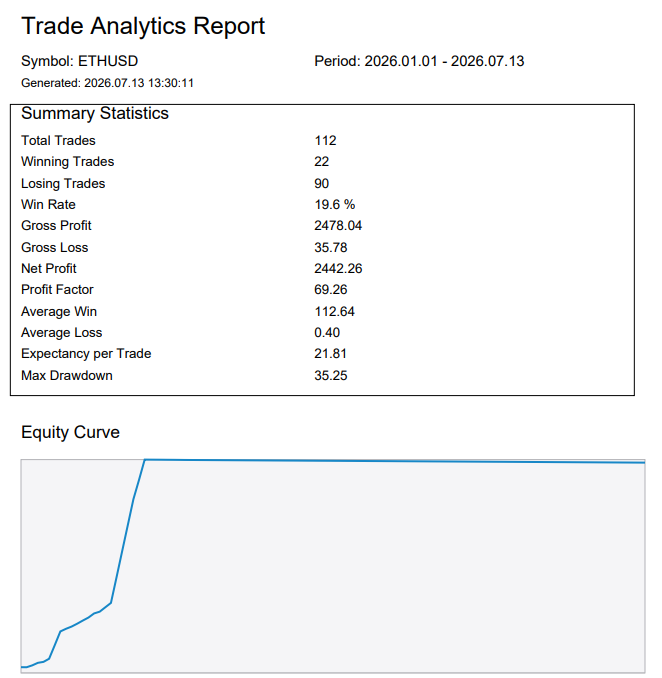
Figure 2: The generated ETHUSD report opened in a PDF reader.
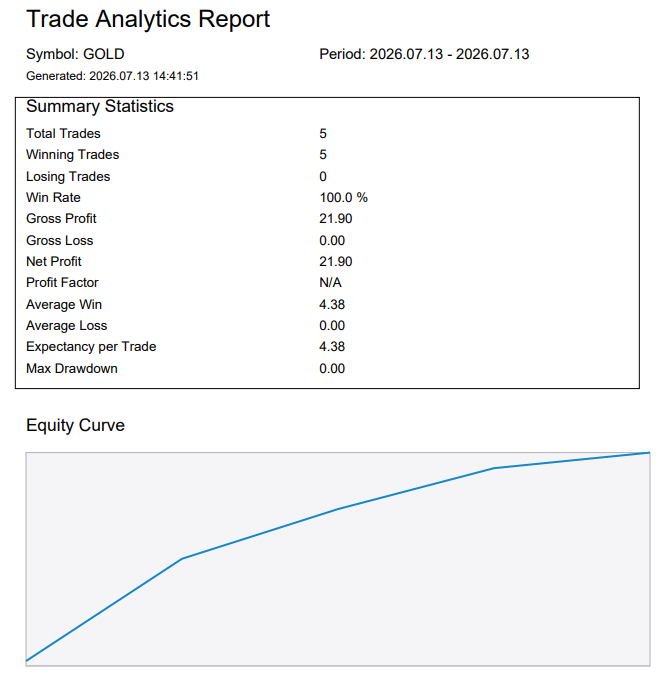
Figure 3: The GOLD report showing "Profit Factor: N/A" correctly for a symbol with a 100% win rate and no losing trades, and an equity curve that rises monotonically from the chart bottom to the top.
Verification — TestPdfReport.mq5
The test script verifies two things:
- the statistics arithmetic on a known synthetic trade sequence and
- the structural validity of the PDF file produced by Save().
It requires neither live trade history nor a visual PDF renderer.
The synthetic sequence is three wins of 100 and two losses of 50, arranged as [100, -50, 100, -50, 100]. Every derived statistic is a clean, hand-verifiable number: gross profit 300, gross loss 100, net profit 200, win rate 60%, profit factor 3.00, average win 100, average loss 50, expectancy 40. The equity curve is [100, 50, 150, 100, 200], and the maximum drawdown is exactly 50 — confirmed by tracing the sequence by hand: peak reaches 100, drops to 50 (drawdown 50), peak reaches 150, drops to 100 (drawdown 50), reaches 200 with no further decline. These values were computed in Python before being written into the test, independently confirming that the expected results are mathematically correct.
The structural checks read the raw file bytes back after writing and confirm: the %PDF-1.4 header starts the file, %%EOF appears near the end, exactly five endobj markers are present matching the five fixed objects, the xref and trailer keywords exist, and the byte count reported by FileSize() matches the string length read back. That last check is particularly important: if FILE_BIN were accidentally replaced with FILE_TXT, MQL5's text mode would rewrite every \n to \r\n, adding one byte per newline to the file on disk. The resulting file size would be larger than the string length computed from the string, and the mismatch would immediately reveal that byte-level corruption had occurred.
//+------------------------------------------------------------------+
//|                                             TestPdfReport.mq5    |
//+------------------------------------------------------------------+

#property script_show_inputs


//--- Includes
#include <Pdfreport/TradeStat.mqh>
#include <Pdfreport/TradeStatCalculator.mqh>
#include <Pdfreport/PdfBuilder.mqh>
#include <Pdfreport/ReportLayout.mqh>

//--- ASSERT: prints PASSED or FAILED with the test description
#define ASSERT(cond, msg) \
   if(!(cond)) { PrintFormat("ASSERT FAILED : %s", msg); } \
   else        { PrintFormat("ASSERT PASSED : %s", msg); }
//+------------------------------------------------------------------+
//| Script entry point: verify the statistics math with synthetic    |
//| data, then verify the PDF file's structural integrity directly.  |
//+------------------------------------------------------------------+
void OnStart()
  {
//--- synthetic trade sequence: 3 wins of 100, 2 losses of 50, in this order
//--- expected: gross_profit=300, gross_loss=100, net=200, win_rate=60%,
//--- profit_factor=3.0, average_win=100, average_loss=50, expectancy=40
   double profits[5];
   profits[0] = 100.0;
   profits[1] = -50.0;
   profits[2] = 100.0;
   profits[3] = -50.0;
   profits[4] = 100.0;

   CTradeStatCalculator calc;
   calc.Init("EURUSD", 0);

   CTradeStat stat;
   stat.symbol = "EURUSD";
   stat.from   = ::StringToTime("2024.01.01");
   stat.to     = ::StringToTime("2024.02.01");

   bool computed = calc.ComputeFromProfits(profits, 5, stat);

//--- Test 1: ComputeFromProfits succeeds
   ASSERT(computed, "ComputeFromProfits() succeeds on synthetic data");

//--- Test 2: total trade count matches
   ASSERT(stat.total_trades == 5, "total_trades equals 5");

//--- Test 3: win/loss counts match
   ASSERT(stat.win_trades == 3 && stat.loss_trades == 2,
          "win_trades=3 and loss_trades=2");

//--- Test 4: gross profit and gross loss match
   ASSERT(::MathAbs(stat.gross_profit - 300.0) < 0.001,
          "gross_profit equals 300.00");
   ASSERT(::MathAbs(stat.gross_loss - 100.0) < 0.001,
          "gross_loss equals 100.00");

//--- Test 5: net profit matches
   ASSERT(::MathAbs(stat.net_profit - 200.0) < 0.001,
          "net_profit equals 200.00");

//--- Test 6: win rate matches
   ASSERT(::MathAbs(stat.win_rate - 60.0) < 0.001,
          "win_rate equals 60.0 percent");

//--- Test 7: profit factor matches
   ASSERT(::MathAbs(stat.profit_factor - 3.0) < 0.001,
          "profit_factor equals 3.00");

//--- Test 8: average win and average loss match
   ASSERT(::MathAbs(stat.average_win - 100.0) < 0.001,
          "average_win equals 100.00");
   ASSERT(::MathAbs(stat.average_loss - 50.0) < 0.001,
          "average_loss equals 50.00");

//--- Test 9: expectancy matches
   ASSERT(::MathAbs(stat.expectancy - 40.0) < 0.001,
          "expectancy equals 40.00");

//--- Test 10: equity curve values match the running cumulative sum
   bool curve_ok = (::ArraySize(stat.equity_curve) == 5) &&
                   (::MathAbs(stat.equity_curve[0] - 100.0) < 0.001) &&
                   (::MathAbs(stat.equity_curve[1] -  50.0) < 0.001) &&
                   (::MathAbs(stat.equity_curve[2] - 150.0) < 0.001) &&
                   (::MathAbs(stat.equity_curve[3] - 100.0) < 0.001) &&
                   (::MathAbs(stat.equity_curve[4] - 200.0) < 0.001);
   ASSERT(curve_ok, "equity_curve matches the expected running cumulative sum");

//--- Test 11: max drawdown matches the known peak-to-trough decline
//--- equity curve is 100,50,150,100,200; peak reaches 100 then drops to
//--- 50 (drawdown 50), peak reaches 150 then drops to 100 (drawdown 50);
//--- the largest drawdown observed is 50
   ASSERT(::MathAbs(stat.max_drawdown - 50.0) < 0.001,
          "max_drawdown equals 50.00");

//--- Test 12: profit factor sentinel when there are no losing trades
   double all_wins[3];
   all_wins[0] = 10.0;
   all_wins[1] = 20.0;
   all_wins[2] = 30.0;
   CTradeStat stat_no_losses;
   calc.ComputeFromProfits(all_wins, 3, stat_no_losses);
   ASSERT(stat_no_losses.profit_factor < 0.0,
          "profit_factor is the -1 sentinel when there are no losing trades");

//--- build a PDF report from the first synthetic stat block and verify
//--- its structural integrity directly, since MQL5 cannot render a PDF
//--- visually to confirm correctness the way it can print a number
   string generated_at = ::TimeToString(::TimeCurrent(),
                                        TIME_DATE | TIME_MINUTES | TIME_SECONDS);
   CPdfBuilder pdf;
   BuildReportContent(pdf, stat, generated_at);

   string filename = "test_trade_report.pdf";
   bool saved = pdf.Save(filename);

//--- Test 13: Save() succeeds
   ASSERT(saved, "CPdfBuilder::Save() writes the file without error");

//--- Test 14: the file exists on disk
   ASSERT(::FileIsExist(filename), "PDF file exists in MQL5/Files/");

//--- read the file back in binary mode to verify its structure byte-for-byte
   int fh = ::FileOpen(filename, FILE_READ | FILE_BIN | FILE_ANSI);
   if(fh == INVALID_HANDLE)
     {
      PrintFormat("TestPdfReport: could not reopen %s for verification, error %d",
                  filename, ::GetLastError());
      return;
     }

   ulong file_size = ::FileSize(fh);
   string full_content = "";
   while(!::FileIsEnding(fh))
      full_content += ::FileReadString(fh);

   ::FileClose(fh);

//--- Test 15: file begins with the required PDF header
   string header_check = ::StringSubstr(full_content, 0, 8);
   ASSERT(header_check == "%PDF-1.4",
          "PDF file begins with the %PDF-1.4 header");

//--- Test 16: file ends with the required %%EOF marker
   int eof_pos = ::StringFind(full_content, "%%EOF");
   ASSERT(eof_pos > 0 && eof_pos > (int)::StringLen(full_content) - 10,
          "PDF file contains %%EOF near the end of the file");

//--- Test 17: file contains exactly 5 "endobj" markers, matching the
//--- fixed 5-object structure (Catalog, Pages, Page, Font, Contents)
   int endobj_count = 0;
   int search_pos = 0;
   while(true)
     {
      int found = ::StringFind(full_content, "endobj", search_pos);
      if(found < 0)
         break;
      endobj_count++;
      search_pos = found + 6;
     }
   ASSERT(endobj_count == 5, "PDF file contains exactly 5 endobj markers");

//--- Test 18: file contains the xref and trailer keywords
   ASSERT(::StringFind(full_content, "xref") >= 0,
          "PDF file contains the xref keyword");
   ASSERT(::StringFind(full_content, "trailer") >= 0,
          "PDF file contains the trailer keyword");

//--- Test 19: file size reported by FileSize matches the string length
//--- read back, confirming no byte-level corruption occurred on write
   ASSERT((int)file_size == ::StringLen(full_content),
          "File size on disk matches the content read back");

   Print("TestPdfReport: all assertions complete.");
  }
//+------------------------------------------------------------------+
MathAbs() returns the absolute value of a double. The floating-point assertions use MathAbs(computed - expected) < 0.001 rather than direct equality because floating-point arithmetic can accumulate tiny rounding errors in multi-step computations. Using a small tolerance rather than strict equality prevents false failures that have nothing to do with the logic being tested.
StringToTime() parses a date string in YYYY.MM.DD format into a datetime value, used to set the synthetic stat's from and to fields. FileIsExist() checks whether a file exists in MQL5/Files/. FileSize() returns the byte count of an open file handle. FileIsEnding() returns true when the file position is at the end of the file. StringSubstr() extracts a substring by position and length. StringFind() searches for a substring within a string and returns the byte position where it was found, or -1 if not found.
Extending the Report
The statistics table currently draws all rows with the same white background inherited from the page. An alternating-row shading effect — alternating every other row between the default white and a very light fill color — would improve readability for long tables. This would require calling SetFillColor() and a filled DrawRect() on each odd row before drawing the label and value text for that row, then resetting the fill to white for even rows.
The equity curve chart currently has no axis labels. Adding them would require computing the minimum and maximum equity values during the same loop that builds the xs and ys arrays, then calling DrawText() on the left edge of the chart box at the appropriate y positions to display those values. The y position for each label is already known from the chart coordinate mapping.
Multiple symbols could be batched by calling SymbolTradeReport.mq5 once per symbol with different InpSymbol values, producing one named PDF file per symbol. A separate summary script could then call HistorySelect() across all symbols and write a cover-page PDF listing every symbol alongside its net profit.
Limitations
GetTradeNetProfit() sums profit, swap, and commission from the exit deal only. Some brokers post the commission on the entry deal rather than the exit deal. When that convention applies, the report's net profit will differ slightly from the terminal's own reported total for that symbol, since the terminal correctly attributes commission from whichever deal it was posted to.
The five-object PDF structure supports exactly one page. Adding a second page would require additional Page and Contents objects, additional offset tracking in Save(), and changes to the Pages object's Kids array. The existing CPdfBuilder class does not support this without structural changes to how objects are assembled and numbered.
The content stream uses only the built-in Helvetica font in plain single-byte ANSI encoding. Non-ASCII characters in a symbol name or in any other text drawn by DrawText() will not render correctly, because the implementation does not implement PDF's Unicode font embedding or multi-byte encoding mechanisms.
There is no time limit on the history iteration. For an account with a very large deal history spanning many years, HistorySelect() and the iteration loop in Calculate() can take several seconds. The script provides no progress indicator during this period.
Conclusion
This article presents a complete, dependency-free pipeline for generating a per-symbol trade analytics PDF report from MQL5. CTradeStat is the plain data carrier holding every statistic and the equity curve. CTradeStatCalculator separates history reading — which requires a live terminal connection — from pure numeric computation, which can be called with any array of profit values and therefore tested with synthetic data independently of any trading account. CPdfBuilder assembles a byte-exact, valid single-page PDF using only string concatenation and the binary file API. It exposes SetStrokeColor() and SetFillColor() to emit the PDF RG and rg color operators, allowing the chart background, chart border, zero-reference line, and equity curve to each carry a distinct color rather than defaulting to the same uniform black. ReportLayout.mqh lays out the page once and is shared between the production script and the test script, guaranteeing the layout code is exercised by the test on every run.
The concrete operational guarantees are these: the generated PDF opens in any standard reader without a repair warning, because its cross-reference table offsets are computed from the same string lengths that are written to disk with no translation. The statistics arithmetic is verifiable against a hand-computed synthetic dataset of five trades. The equity curve chart renders with a light grey background and a teal-blue curve that are visually distinct from the surrounding black text. The zero-reference line is always present regardless of whether the history was profitable, unprofitable, or mixed. The limitations are the exit-deal-only commission attribution, the one-page structural ceiling, the ASCII-only text encoding, and the absence of a progress indicator for large histories.
Programs used in the article:
| # | Name | Type | Description |
|---|---|---|---|
| 1 | TradeStat.mqh | Include File | Plain struct holding every computed statistic and the equity curve array for one symbol over one date range. |
| 2 | TradeStatCalculator.mqh | Include File | Reads deal history into a profit array and delegates all statistics computation to a pure function that is independently testable with synthetic data. |
| 3 | PdfBuilder.mqh | Include File | Accumulates content-stream operators and assembles a byte-exact, valid PDF on Save(), with separate color setters for stroke and fill. |
| 4 | ReportLayout.mqh | Include File | Lays out the title, statistics table with a correctly positioned section border, and a styled equity curve chart; shared between the production and test scripts. |
| 5 | SymbolTradeReport.mq5 | Script | User-facing entry point that resolves inputs, computes statistics from live history, and writes the named PDF file. |
| 6 | TestPdfReport.mq5 | Script | Verifies statistics arithmetic against known synthetic values and PDF structural integrity, without requiring any live trading history. |
| 7 | Pdf_Report_Builder.zip | Zip Archive | Zip archive containing all the attached files and their paths relative to the terminal's root folder. |
Warning: All rights to these materials are reserved by MetaQuotes Ltd. Copying or reprinting of these materials in whole or in part is prohibited.
This article was written by a user of the site and reflects their personal views. MetaQuotes Ltd is not responsible for the accuracy of the information presented, nor for any consequences resulting from the use of the solutions, strategies or recommendations described.

 Neural Networks in Trading: A Cross-Domain Time Series Forecasting Framework (Conclusion)
 Path Signatures for Lead-Lag Detection
 Implementing Anchored VWAP Indicator in MQL5: A Step-by-Step Guide
 Measuring broker execution quality in MQL5: Why your live account doesn't match the backtest

- Free trading apps
- Over 8,000 signals for copying
- Economic news for exploring financial markets
You agree to website policy and terms of use