

Feature Engineering for ML (Part 11): Fractal Features in Python
 1 844
1 844
 0
0

Table of Contents
- Introduction
- Why Fractals Encode Market Structure
- Pipeline Architecture
- Basic and Enhanced Fractals
- Support/Resistance Levels and Breakout Signals
- Trend Features and Whipsaw-Filtered Signals
- The Look-Ahead Leak: Why center=True Needs a Shift
- Three Bugs Found in the Original Module
- Raw vs. Causal: Two Legitimate Uses of the Same Column
- Results: Quantifying the Leak
- Conclusion
- References
Introduction
The preceding articles in this Feature Engineering for ML series derived features from price geometry (Part 1), from the trading calendar (Part 3), from the bid-ask spread and price impact (Parts 5–6), from the information content of the trade-direction sequence (Part 7), and, most recently, from the timing of regime changes themselves (Part 10). This eleventh installment returns to price geometry, but at a coarser structural level: the swing highs and swing lows that define support, resistance, and trend.
The module under review, fractals, implements Bill Williams' fractal pattern from Trading Chaos — a five-bar structure where a high (or low) is flanked by two lower highs (or two higher lows) on each side — and builds a full feature pipeline on top of it: strength measurement, statistical validation, dynamic support/resistance levels, breakout detection, trend features, and whipsaw-filtered entry signals.
Unlike the entropy module, the issue here is not performance drift. It is a correctness bug, and a more dangerous one: an information leak. Several of the module's own functions already contain the fix, applied inconsistently, which makes the bug easy to miss on a casual read and easy to reproduce if you write a similar detector from scratch. This article documents the leak, the two secondary bugs that ride along with it, and the corrected module.
Why Fractals Encode Market Structure
Williams' fractal is a minimal definition of a turning point: a high is a bearish fractal if it exceeds the two highs on each side of it; a low is a bullish fractal if it is exceeded by the two lows on each side of it (Williams, 1998). It requires no parameters beyond the number of confirming bars, n, on each side — the classic setting is n=2, giving a five-bar window. Because the condition is purely structural (a local extremum test), it says nothing about magnitude or duration; a fractal on a 1-minute chart and a fractal on a monthly chart are the same pattern at different scales.
That scale invariance is the link to Mandelbrot's argument that markets are self-similar across timeframes and that price series carry long memory that a random-walk model does not capture (Mandelbrot, 2004). This is also why a fractal detector is attractive for ML feature generation: with the same n, it produces a comparable signal whether it runs on tick bars, minute bars, or daily bars. That consistency matters when features from multiple bar types feed the same model, and it pairs naturally with the alternative bar constructions covered in earlier MQL5 Machine Learning Blueprint articles.
The practical value of a confirmed fractal is as a reference level: the market has already demonstrated that it rejected moves beyond that level once, so a return to the same level is a natural place to look for a repeat rejection (support/resistance) or a break of structure. The fractals module turns that single structural test into eight downstream feature groups: strength, validation, distance to support and resistance, breakout flags, trend strength, trend direction, and a filtered buy/sell signal with a magnitude score.
Pipeline Architecture
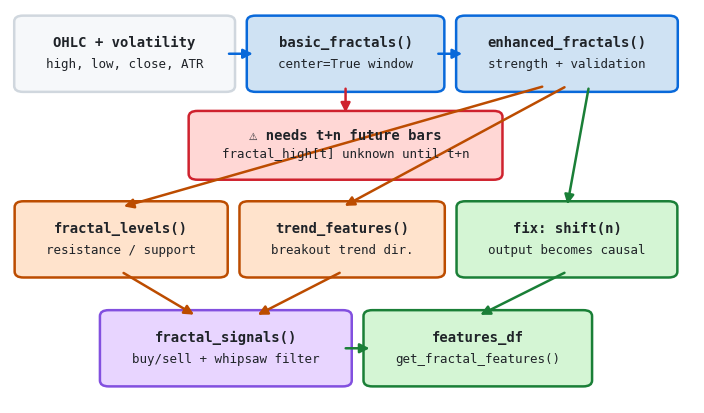
Figure 1. Architecture of the fractal feature pipeline
- OHLC + volatility (grey): the only required inputs — high, low, close, and an external volatility series (typically ATR) used later for signal scaling.
- calculate_basic_fractals() (blue): the five-bar structural test, implemented as a centered rolling max/min comparison. This is the node where the leak originates — flagged in red.
- calculate_enhanced_fractals() (blue): adds strength measurement, a static-threshold validity flag, and breakout detection relative to price n bars prior.
- calculate_fractal_levels() / calculate_fractal_trend_features() (orange): dynamic support/resistance and breakout-driven trend direction, both consuming the enhanced-fractal output.
- generate_fractal_signals() (purple): combines breakout flags with trend direction and fractal strength to produce a whipsaw-filtered buy/sell signal.
- fix: shift(n) (green): the correction this article adds — applied once, at the feature-matrix boundary, rather than scattered across individual functions.
from fractals import get_fractal_features

features_df = get_fractal_features(df, volatility=atr, n=2,
                                   lookback_period=20, ma_period=20)
# df must have .high, .low, .close columns on a DatetimeIndex
# atr: pd.Series of volatility, same index as df
Basic and Enhanced Fractals
The structural test is a one-liner built entirely from a centered rolling window:
def calculate_basic_fractals(high, low, n=2):
    fractal_high = (high == high.rolling(2 * n + 1, center=True).max()).astype(int)
    fractal_low  = (low  == low.rolling(2 * n + 1, center=True).min()).astype(int)
    return {"fractal_high": fractal_high, "fractal_low": fractal_low}
center=True tells pandas to place the window symmetrically around row t rather than ending at row t, which is exactly what the Williams definition requires — comparing the high at t against n bars on both sides. The cost of that symmetry is discussed in full in Section 7; for now, note only that fractal_high[t] is a function of high[t-n:t+n+1], not of high[:t+1].
calculate_enhanced_fractals() layers strength, validation, and breakout detection on top of the basic test:
fractal_high_strength = np.where(
    basic_fractals["fractal_high"] == 1,
    high / high.rolling(2 * n + 1, center=True).mean() - 1,
    0,
)
valid_fractal_high = (basic_fractals["fractal_high"] == 1) & (
    fractal_high_strength > volatility_threshold
)
fractal_breakout_up = (
    (close > high.shift(n)) & (basic_fractals["fractal_low"].shift(n) == 1)
).astype(int)
Strength is the percentage distance of the fractal high above the local mean price — a Williams fractal sitting 3% above its own 5-bar average is a sharper spike than one sitting 0.1% above it. valid_fractal_high filters out the sharper spikes using volatility_threshold, a plain float defaulting to 0.001 (0.1%). Nothing about that threshold is volatility-adaptive: it is a constant, applied identically whether the recent range is a few pips or several dozen. The volatility series that the pipeline collects three functions later, for signal scaling, never touches the validation step at all. Section 8 covers the fix.
fractal_breakout_up is where the module first applies a shift, and applies it correctly: comparing today's close against the high recorded n bars ago, gated on that bar having been a confirmed bullish fractal low. Both operands are shifted by n, so the flag is knowable using only information available up to the current bar. This correct usage, two paragraphs below the leaky one, is precisely what makes the leak easy to miss: the fix is present in the file, just not everywhere it needs to be.
Support/Resistance Levels and Breakout Signals
calculate_fractal_levels() turns validated fractals into a running support/resistance line:
recent_high_fractals = high[valid_fractal_high == 1]
resistance_level = recent_high_fractals.rolling(lookback_period, min_periods=1).max()
resistance_level = resistance_level.reindex(high.index, method="ffill")

distance_to_resistance = (resistance_level - current_close) / current_close
Two things are worth noting about this snippet beyond the leak it inherits from valid_fractal_high. First, recent_high_fractals is a sparse series — it only has entries at bars where a fractal was validated. A count-based rolling(lookback_period) on a sparse series counts fractal events, not bars: lookback_period=20 means "the last 20 validated fractal highs," which on an illiquid symbol with few fractals could span months, and on a noisy one could span a single session. This is not wrong, but it is a different guarantee than the parameter name suggests, and worth a comment in any fork of this code. Second, the reference price for distance calculations is named current_close but is actually the high/low midpoint — a naming choice that costs nothing today but will bite the next person who searches the codebase for "close" expecting the traded price.
The breakout functions built on top of these levels — fractal_breakout_up and fractal_breakout_down, shown in Section 4 — are the one part of the pipeline that is leak-free by construction, because both consume .shift(n) versions of the raw fractal flags. That correctness does not, however, propagate backward into resistance_level and support_level themselves, which are returned unshifted.
Trend Features and Whipsaw-Filtered Signals
calculate_fractal_trend_features() is entirely built from the already-causal breakout flags, so it inherits no new leak — trend strength is breakout density over a moving window, trend direction is the sign of the breakout balance:
fractal_density   = (fractal_breakout_up + fractal_breakout_down).rolling(ma_period).sum()
trend_strength    = fractal_density / ma_period
breakout_balance  = (fractal_breakout_up - fractal_breakout_down).rolling(ma_period).sum()
trend_direction   = np.sign(breakout_balance)
generate_fractal_signals() combines trend direction with fractal strength, scaled by volatility, to produce the final buy/sell signal:
buy_signals  = (fractal_breakout_up == 1) & (trend_direction >= 0)
sell_signals = (fractal_breakout_down == 1) & (trend_direction <= 0)

signal_strength = np.zeros(len(close))
signal_strength[buy_signals] = fractal_low_strength.shift(2)[buy_signals] / (
    volatility[buy_signals] + 1e-8
)
signal_strength[sell_signals] = fractal_high_strength.shift(2)[sell_signals] / (
    volatility[sell_signals] + 1e-8
)
The .shift(2) here is doing the same job as the .shift(n) in fractal_breakout_up — aligning a leaky strength value with the bar at which it actually became knowable. It is correct for the module's default n=2, and silently wrong for any other value, because the function never receives n as an argument. Change n=3 anywhere upstream and this line keeps compiling, keeps returning numbers in range, and keeps being off by one bar.
The Look-Ahead Leak: Why center=True Needs a Shift
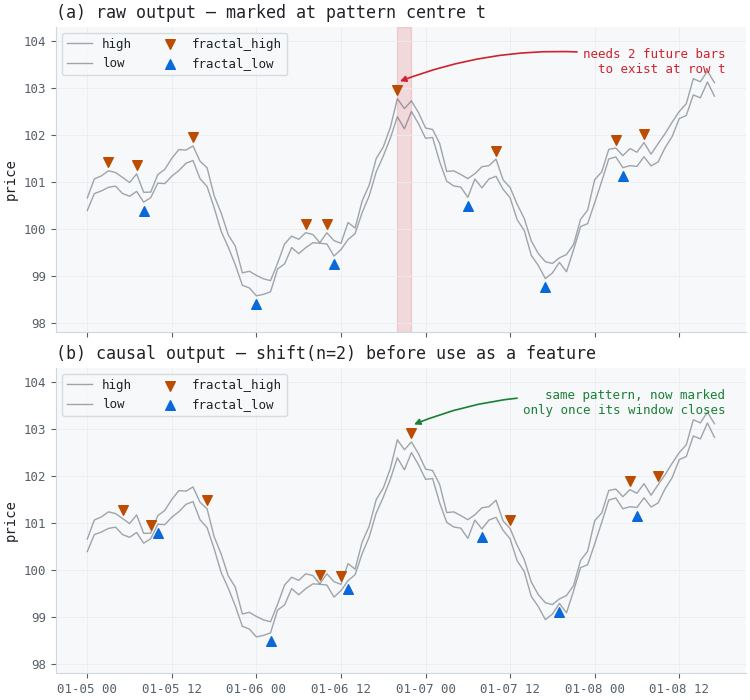
Figure 2. Two-panel illustration of raw versus causal fractal markers on a synthetic price series
- Panel (a) raw output: fractal_high[t] is plotted at the bar it is indexed to — the center of the five-bar window. The shaded region marks the n bars of future price data the flag actually depends on; at the moment that bar closes, this value cannot yet be computed.
- Panel (b) causal output: the same flag, shifted by n bars. It now appears at the first bar where it is genuinely knowable — the window has closed and no future price is involved.
AFML devotes an entire chapter to this problem under the heading of purging and embargo in cross-validation (López de Prado, 2018, Chapter 7). A feature that encodes information not yet available at its own timestamp inflates apparent performance in-sample and in walk-forward testing, because naive out-of-sample tests still let the model see outcomes it is supposed to be predicting. A fractal detector built on rolling(..., center=True) is a textbook case — it is not an edge case of leakage, it is leakage by definition, since "centered" literally means "uses future values."
The fix is one line applied once, not scattered through every downstream function as a series of ad hoc .shift(n) and .shift(2) calls:
_LEAKY_COLUMNS = [
    "fractal_high", "fractal_low",
    "fractal_high_strength", "fractal_low_strength",
    "valid_fractal_high", "valid_fractal_low",
    "resistance_level", "support_level",
    "distance_to_resistance", "distance_to_support",
]

def get_fractal_features(df, volatility, n=2, lookback_period=20, ma_period=20,
                         leak_safe=True):
    features_df = comprehensive_fractal_analysis(...)
    if leak_safe:
        cols = [c for c in _LEAKY_COLUMNS if c in features_df.columns]
        features_df[cols] = features_df[cols].shift(n)
    return features_df
Breakout, trend, and signal columns are excluded from _LEAKY_COLUMNS because they are already causal by construction (Sections 4–6); shifting them a second time would just misalign a correct feature. leak_safe=True is the default; the escape hatch exists only for labeling use, covered next.
Three Bugs Found in the Original Module
The three issues identified in fractals, and the corrections applied:
| Bug | Location | Effect | Fix |
|---|---|---|---|
| 1 | calculate_basic_fractals / calculate_enhanced_fractals / calculate_fractal_levels — rolling(..., center=True) | fractal_high, fractal_low, both strength columns, both validity flags, and both level columns are not knowable until n bars after their own timestamp. Used directly as row-t features, they leak up to n bars of future price information into the model, inflating in-sample and even walk-forward performance. | Shift all ten affected columns by n at the feature-matrix boundary (get_fractal_features(..., leak_safe=True)), leaving the already-causal breakout/trend/signal columns untouched. |
| 2 | generate_fractal_signals — hardcoded .shift(2) | Correct only when n=2 (the module default). For any other n, signal_strength is computed from a strength value aligned to the wrong bar, degrading the signal without raising an error or changing the output's shape or range. | Thread n through to generate_fractal_signals(..., n=2) and replace the literal 2 with n in both .shift() calls. |
| 3 | calculate_enhanced_fractals — static volatility_threshold | The validation step ignores the volatility series entirely, despite volatility_threshold's name suggesting otherwise. The same 0.1% threshold is applied whether ATR is a few pips or several dozen, over-validating fractals in high-volatility regimes and under-validating them in calm ones. | Accept an optional volatility argument and scale the threshold by the ratio of current to local-average volatility: threshold = volatility_threshold * (volatility / volatility.rolling(2n+1).mean()). |
The corrected validation step from Bug 3:
def calculate_enhanced_fractals(high, low, close, n=2, volatility=None,
                                volatility_threshold=0.001):
    ...
    if volatility is not None:
        vol_ref = volatility.rolling(2 * n + 1, min_periods=1).mean()
        threshold = volatility_threshold * (volatility / vol_ref.replace(0, np.nan))
    else:
        threshold = volatility_threshold  # backward-compatible static behavior

    valid_fractal_high = (basic_fractals["fractal_high"] == 1) & (fractal_high_strength > threshold)
    valid_fractal_low  = (basic_fractals["fractal_low"]  == 1) & (fractal_low_strength  > threshold)
Raw vs. Causal: Two Legitimate Uses of the Same Column
The leak-safe shift is not a blanket rule that the unshifted columns are wrong — it is a rule about where they may appear. There are two distinct roles a fractal flag can play in a research pipeline, and only one of them requires causality:
- As an X feature (something the model conditions on to make a prediction at time t): must never depend on information from after t. This is where leak_safe=True belongs, and where Bug 1 does real damage if left unfixed.
- As a labeling input (something used to construct the y target, e.g., defining triple-barrier touch events or marking where a structural swing "actually" occurred for backtesting purposes): the unshifted, fully-confirmed fractal is often the correct choice, because labeling is allowed to use hindsight — that is the entire premise of supervised learning. Setting leak_safe=False exposes the raw columns for exactly this use case.
If get_fractal_features() is called once and the resulting DataFrame is used to build both X and y without the shift, the pipeline leaks. It also risks making the label trivially predictable from the leaked feature, since both are computed from the same future window. This is the fractal-detector version of the min_ret / execution-PT* conflation documented in the transaction-cost article: two different roles for the same underlying quantity, silently merged into one variable name.
Results: Quantifying the Leak
To make the size of the leak concrete rather than theoretical, the figure below tests a deliberately naive hypothesis — that a confirmed fractal high predicts a down-move on the next bar — using 4,000 bars of synthetic random-walk price data (no real structure, no genuine reversal edge) at six values of n.
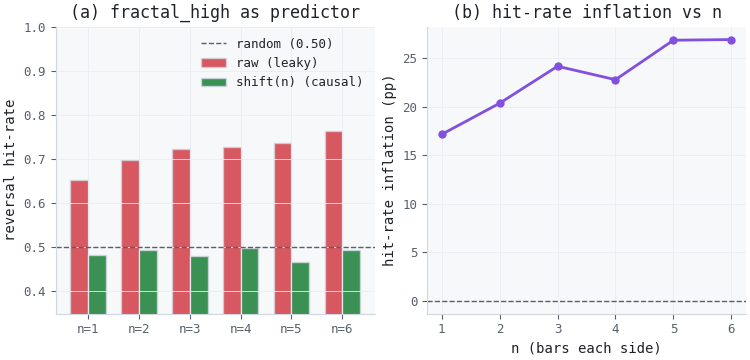
Figure 3. Two-panel illustration of hit-rate inflation caused by the center=True leak
- Panel (a): the raw (leaky) fractal_high shows a reversal hit-rate well above 0.50 at every n, rising as n grows — because a larger centered window makes fractal_high[t] an increasingly strong statement about the shape of price after t. The shifted (causal) version sits at essentially 0.50 across all n, exactly what a structural, non-predictive event flag should show on random-walk data.
- Panel (b): the gap between the two lines, in percentage points. On pure noise, with no real predictive content anywhere in the data-generating process, the leak alone manufactures what would read as a meaningful edge in a backtest — growing roughly with n, since a wider window borrows more future information per flagged bar.
This is the practical danger of Bug 1: it does not merely bias a metric by a rounding error, it is capable of producing an apparently profitable strategy out of data with no exploitable structure at all, purely as an artifact of how the detector is windowed.
Conclusion
This article implemented and corrected the fractal feature suite in fractals, covering Williams' five-bar structural pattern (Williams, 1998) and the strength, validation, level, breakout, trend, and signal layers built on top of it. The module's self-similarity across timeframes traces back to Mandelbrot's fractal-market hypothesis (Mandelbrot, 2004), and its practical value as a support/resistance and trend-confirmation tool is well established in the technical-analysis literature (Murphy, 1999).
One structural bug and two secondary bugs were identified and corrected. The structural bug is that rolling(..., center=True) produces raw fractal, strength, validity, and level columns that require up to n future bars to compute: a genuine look-ahead leak in the AFML Chapter 7 sense (López de Prado, 2018). On synthetic noise alone, it was shown to manufacture a reversal hit-rate several points above random. The two secondary bugs are both silent: a hardcoded .shift(2) that only happens to match the module's default n, and a threshold described as dynamic that never reads the volatility series. Neither raises an exception, changes an output's shape, or produces an obviously wrong number, which is precisely what makes them worth documenting.
The corrected module exposes a single leak_safe flag at the get_fractal_features() boundary rather than scattering shifts through individual functions, and keeps the raw, unshifted columns available under leak_safe=False for the one context where hindsight is legitimate: constructing labels, not features. As with the entropy module in Part 7, the lesson generalizes beyond this specific file — any feature built on a centered window, a centered rolling statistic, or a "confirmed pattern" detector of any kind carries the same risk and deserves the same audit.
The next article in this series will cover the MQL5 port of the fractal indicator, including the buffer-alignment changes needed to reproduce the shifted, leak-safe columns inside an EA's OnCalculate loop.
References
- López de Prado, M. (2018). Advances in Financial Machine Learning. Wiley. Chapter 7.
- Williams, B. (1998). Trading Chaos: Maximize Profits with Proven Technical Techniques. Wiley.
- Mandelbrot, B. (2004). The (Mis)Behavior of Markets: A Fractal View of Financial Turbulence. Basic Books.
- Bailey, D. H., Borwein, J., López de Prado, M., & Zhu, Q. J. (2014). Pseudo-Mathematics and Financial Charlatanism: The Effects of Backtest Overfitting on Out-of-Sample Performance. Notices of the AMS, 61(5), 458–471.
- Murphy, J. J. (1999). Technical Analysis of the Financial Markets. New York Institute of Finance.
- McKinney, W. (2010). Data structures for statistical computing in Python. Proceedings of the 9th Python in Science Conference, 56–61.
Warning: All rights to these materials are reserved by MetaQuotes Ltd. Copying or reprinting of these materials in whole or in part is prohibited.
This article was written by a user of the site and reflects their personal views. MetaQuotes Ltd is not responsible for the accuracy of the information presented, nor for any consequences resulting from the use of the solutions, strategies or recommendations described.

 A Team of AI Agents with Profit-Based Rotation: The Evolution of a Living Trading System in MQL5
 Integrating MQL5 with Data Processing Packages (Part 10): Deploying Python AutoML Pipelines for Strategy Testing
 Neural Networks in Trading: An Intelligent Forecast Pipeline (Time-MoE)
 Implementing Anchored VWAP Indicator in MQL5: A Step-by-Step Guide

- Free trading apps
- Over 8,000 signals for copying
- Economic news for exploring financial markets
You agree to website policy and terms of use