
日足レンジブレイクアウト戦略に基づくMQL5 EAの作成
はじめに
この記事では、日足レンジブレイクアウト(Daily Range Breakout)戦略に基づいて、MetaQuotes Language 5 (MQL5)を使用してエキスパートアドバイザー(EA)を作成する方法を解説します。トレーダーが効果的な自動取引ソリューションを求め続ける中、日足レンジブレイクアウト戦略は、特定のレンジを超えた価格変動を捉える体系的なアプローチを提供します。このため、MetaTrader 5を利用する外国為替トレーダーにとって非常に魅力的な選択肢です。
まず、日足レンジブレイクアウト戦略の基本原則を概説し、自動取引における実装のための堅固な基盤を築きます。次に、ブレイクアウト条件の特定方法およびエントリーポイントとエグジットポイントの設定について詳しく説明します。続いて、MQL5でのコーディングプロセスをガイドし、戦略を推進する重要な機能とロジックに焦点を当てます。また、EAが実際の取引条件下で効果を発揮するよう、バックテストおよび最適化の重要性についても取り上げます。この記事で取り上げるトピックは以下の通りです。
- 日足レンジブレイクアウト戦略を理解する
- EAの設計図
- MQL5で日足レンジブレイクアウトを実装する
- バックテストと最適化
- 結論
この記事を読み終える頃には、日足レンジブレイクアウト戦略を効果的に活用し、取引アプローチを強化するMQL5 EAを開発するための知識が身に付くでしょう。それでは、始めましょう。
日足レンジブレイクアウト戦略を理解する
日足レンジブレイクアウト戦略は、外国為替トレーダーの間で広く知られている取引手法です。この手法を使うことで、市場が日々のレンジを形成した後に発生する大きな価格変動を効率的に活用することができます。この戦略では、市場の価格動向を分析し、重要な支持・抵抗レベルを特定します。これらのレベルを把握したトレーダーは、ブレイクアウトを狙って取引をおこない、市場がこれらのレベルのどちらかを突破した後に起こり得る大きな値動きを捉えようとします。
この戦略の中心となるのは「日次レンジ」で、これは取引日の通貨ペアの最高価格と最低価格の差によって定義されます。ブレイクアウトポイントは、通常、前取引日のレンジを基に推測されます。ブレイクアウトとは、価格が確立された抵抗レベルを上回る、または支持レベルを下回るときに発生する現象です。過去の価格動向を振り返ると、前日の価格は、潜在的なブレイクアウトポイントとして活用できる非常に明確なレベルを形成しているように見えます。たとえば、価格が抵抗レベルを突破した場合、ロングポジションを取ります。一方、価格が支持レベルを割り込んだ場合、ショートポジションを取ります。以下の図は、この概念を視覚的に示したものです。
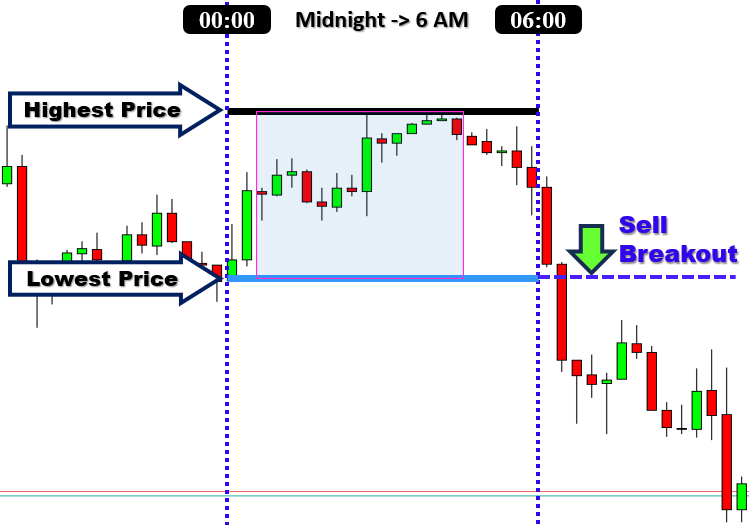
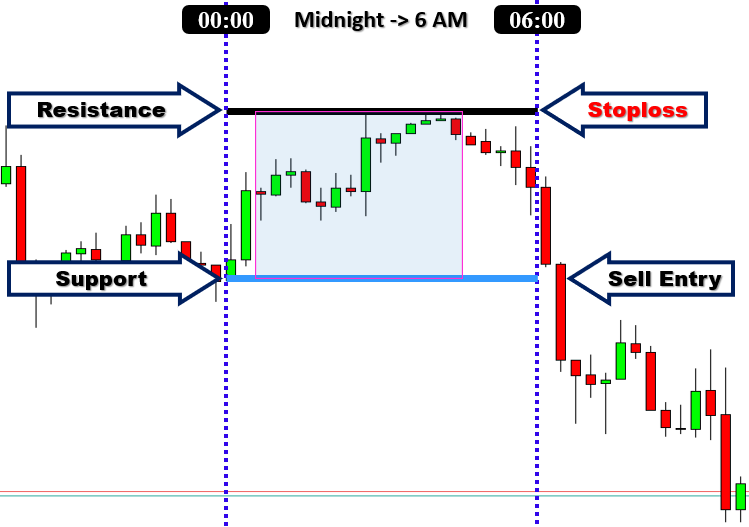
この戦略は、1時間チャートまたは4時間チャートのいずれかで使用することで、最大限の効果を発揮します。トレーダーがこれらの時間枠でこのテンプレートを適用すると、より大きく、より重要な価格変動を捉えることが可能になることが多いです。その理由は、この戦略が低時間枠でよく見られるノイズの影響をほとんど受けないためです。通常、ブレイクアウト戦略では、ロンドンおよびニューヨークのセッション中に取引を実行する前に、アジアセッションでの価格動向を活用して日次レンジを決定します。しかし、ブレイクアウト戦略には一般的に誤ったシグナルを発するという課題があり、日足レンジブレイクアウト戦略も例外ではありません。そのため、他の取引戦略と同様に、この戦略を使用する際にはリスク管理が不可欠です。リスクを適切に管理するために、ロングポジションの場合は直近のスイングローのすぐ下に、ショートポジションの場合は直近のスイングハイのすぐ上にストップロス注文を設定します。これが私たちのリスク管理の基盤となる戦略です。具体的には、状況に応じて直近のスイングハイまたはスイングローを基準にストップロスを配置することでリスクを抑えます。以下に、ストップロスロジックを説明する図をもう一度示します。
日足レンジブレイクアウト戦略は、いくつかの点で有益です。まず、そのシンプルさが特徴であり、初心者から経験豊富なトレーダーまで幅広い層に適した選択肢となっています。次に、明確に定義されたレベルを活用するため、トレーダーが過度に裁量的な決定を下すことを防ぎます。この戦略の取引方法は、市場を細分化することで、各取引セッションの前後における状況を明確に把握できる点でも優れています。具体的には、午前中の市場の取引活動は特定の「レンジ」として区分されます。そして、午前のセッションが終了した後、このレンジの上限または下限を「突破」する動きが、翌日における取引エントリーのシグナルとなる可能性があります。次のセクションでは、すべての具体的な詳細を盛り込んだ明確な取引パラメータの設計図を提示し、この戦略の適用方法をさらに詳しく解説します。
EAの設計図
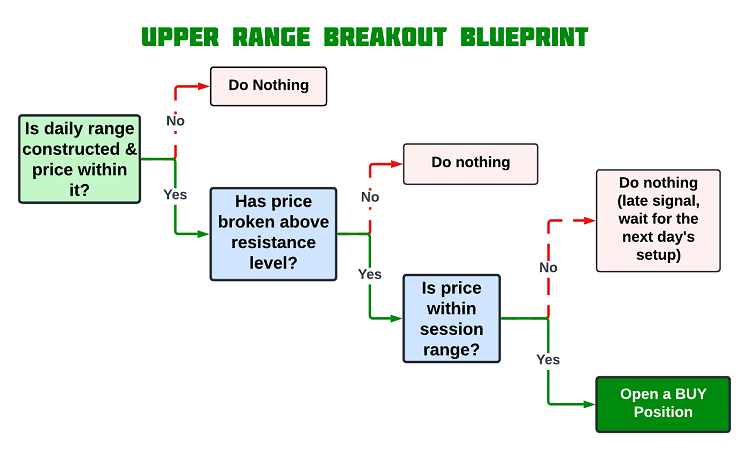
上限レンジブレイクアウト:買いの条件
価格が前日の確立された上限レンジを上回ると、それは強気のブレイクアウトを示し、市場がさらに上昇する可能性を示唆します。このブレイクアウトは、強い買い意欲とさらなる上昇トレンドの発生を意味します。現在のバーの終値が上限レンジレベルを超えた時点で買いポジションを開き、このブレイクアウトに続く勢いを活用して利益を狙います。
下限レンジブレイクアウト:売りの条件
一方で、価格が前日に確立された下限レンジを下回る場合、それは弱気のブレイクアウトを示し、市場がさらに下落する可能性を示唆します。このブレイクアウトは、強い売り圧力とさらなる下落トレンドの発生を意味します。現在のバーの終値が下限レンジレベルを下回った時点で、売りポジションを開き、このブレイクアウト後の価格の弱含みによる利益を狙います。
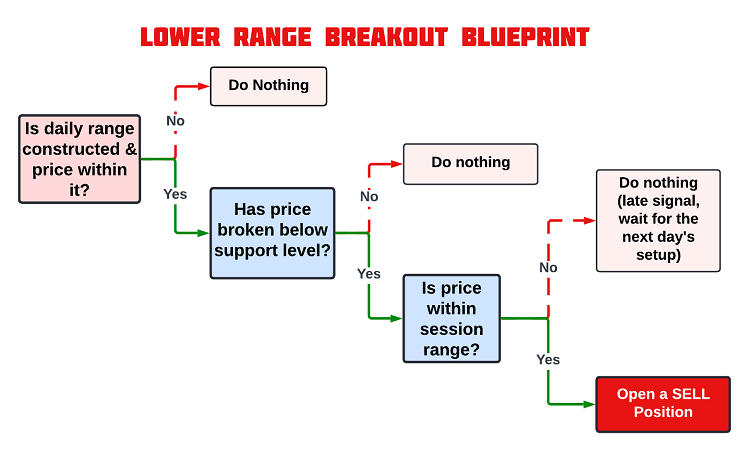
このような戦略設計図の視覚的表現は、MQL5で取引条件を実装する際に役立ち、正確なエントリールールとエグジットルールをコーディングする際の参考となります。
MQL5で日足レンジブレイクアウトを実装する
日足レンジブレイクアウト取引戦略に関するすべての理論を学んだ後は、その理論を自動化し、MetaQuotes Language 5 (MQL5)でMetaTrader 5用のEAを作成しましょう。
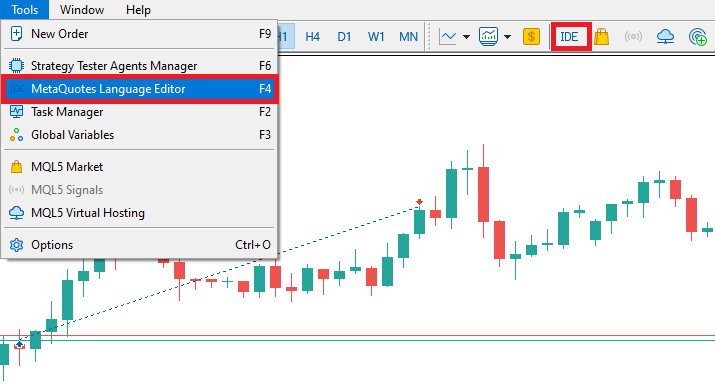
EAを作成するには、MetaTrader 5端末で[ツール]タブをクリックし、[MetaQuotes言語エディタ]を選択するか、キーボードのF4を押します。または、ツールバーのIDE(統合開発環境)アイコンをクリックすることもできます。これにより、MetaQuotes言語エディタ環境が開き、取引ロボット、テクニカルインジケーター、スクリプト、関数のライブラリを作成できるようになります。
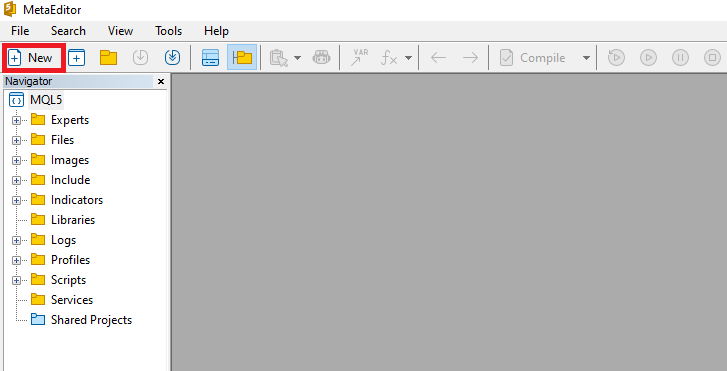
MetaEditorを開いたら、ツールバーの[ファイル]タブで[新しいファイル]を選択するか、CTRL + Nキーを押して新規ドキュメントを開きます。または、[ツール]タブの新規アイコンをクリックすることもできます。MQLウィザードのポップアップが表示されます。
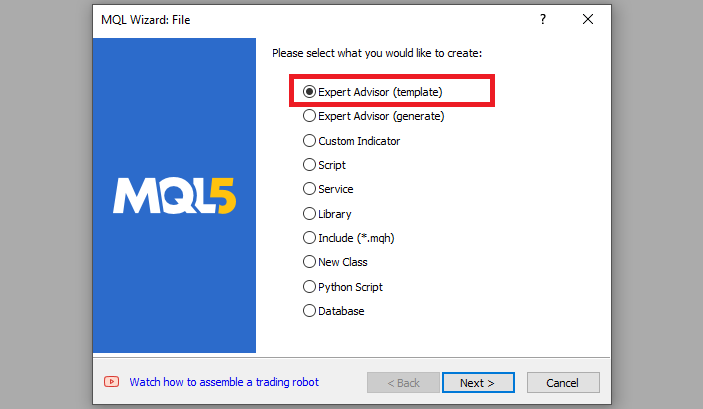
ウィザードが表示されたら、[EA(テンプレート)]を選択し、[次へ]をクリックします。
EAの一般プロパティで、[名前]フィールドにEAのファイル名を入力します。フォルダが存在しない場合にフォルダを指定または作成するには、EA名の前にバックスラッシュを使用することに注意してください。例えば、ここではデフォルトで「Experts\」となっています。つまり、私たちのEAはExpertsフォルダに作成され、そこで見つけることができます。他のフィールドはごく簡単ですが、ウィザードの一番下にあるリンクから、正確な手順を知ることができます。
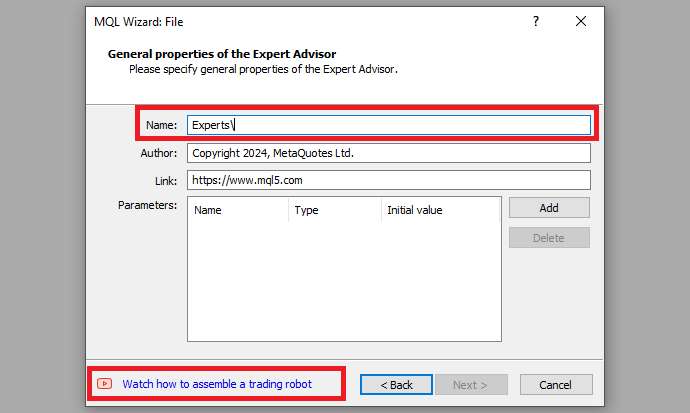
希望するEAファイル名を入力した後、[次へ]をクリックし、[完了]をクリックします。ここまでくれば、あとはコードを書いて戦略をプログラムするだけです。
まず、EAに関するメタデータを定義することから始めます。これには、EA名、著作権情報、MetaQuotes Webサイトへのリンクが含まれます。EAのバージョンも指定し、1.00とします。
//+------------------------------------------------------------------+
//|                          Daily Range Breakout Expert Advisor.mq5 |
//|      Copyright 2024, ALLAN MUNENE MUTIIRIA. #@Forex Algo-Trader. |
//|                                     https://forexalg0-trader.com |
//+------------------------------------------------------------------+
#property copyright "Copyright 2024, ALLAN MUNENE MUTIIRIA. #@Forex Algo-Trader"
#property link      "https://forexalg0-trader.com"
#property description "Daily Range Breakout Expert Advisor"
#property version   "1.00"
プログラムをロードすると、下図のような情報が表示されます。

まず、ソースコードの先頭で#includeを使用して、取引インスタンスをインクルードします。これにより、CTradeクラスにアクセスできるようになります。これを使用して、取引オブジェクトを作成します。これは取引を開始するために必要なので、非常に重要です。
#include <Trade/Trade.mqh>
CTrade obj_Trade;
プリプロセッサは「#include<Trade/Trade.mqh>」という行をTrade.mqhというファイルの内容に置き換えます。角括弧は、Trade.mqhファイルが標準ディレクトリ(通常、terminal_installation_directory\MQL5\Include)から取得されることを示します。カレントディレクトリは検索に含まれません。この行はプログラム中のどこにでも配置できますが、通常は、より良いコード構造と参照を容易にするために、すべてのインクルージョンはソースコードの先頭に置かれます。CTradeクラスのobj_Tradeオブジェクトを宣言すると、MQL5開発者のおかげで、そのクラスに含まれるメソッドに簡単にアクセスできるようになります。
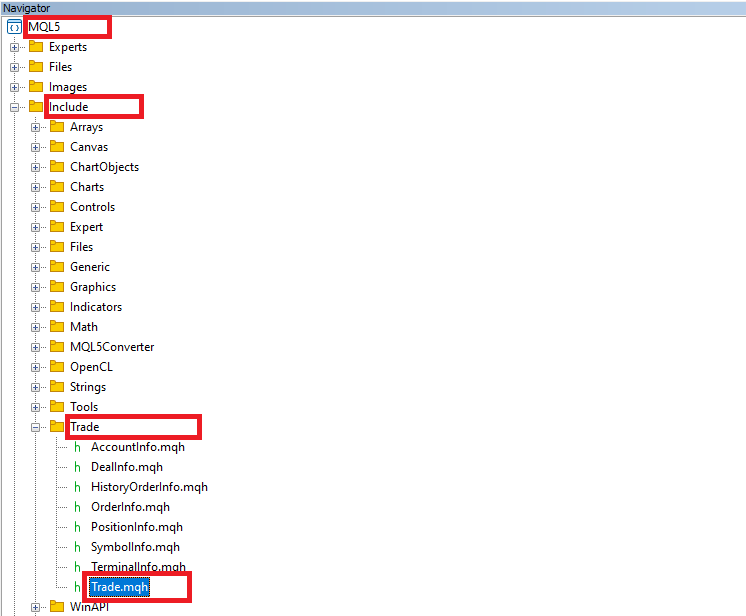
その後、レンジブレイクアウトデータを保存および追跡するためのいくつかの重要な変数を宣言する必要があります。
double maximum_price = -DBL_MAX;      //--- Initialize the maximum price with the smallest possible value
double minimum_price = DBL_MAX;       //--- Initialize the minimum price with the largest possible value
datetime maximum_time, minimum_time;  //--- Declare variables to store the time of the highest and lowest prices
bool isHaveDailyRange_Prices = false; //--- Boolean flag to check if daily range prices are extracted
bool isHaveRangeBreak = false;        //--- Boolean flag to check if a range breakout has occurred
ここでは、主要な価格データを追跡し、取引ロジックでレンジブレイクアウトを処理するために、いくつかの重要な変数を宣言します。まず、特定の期間に見つかった最高価格と最低価格を格納する2つのdouble変数maximum_priceとminimum_priceを初期化します。maximum_priceは、-DBL_MAX(可能な最小のdouble値)に設定され、遭遇する価格がそれよりも高くなり、この初期値が置き換えられることが保証されます。同様に、minimum_priceをDBL_MAX(可能な最大のdouble値)に設定し、それより低い価格が最小値として置き換えられるようにします。
また、最高価格と最低価格が発生した正確な時刻を保存するために、maximum_timeとminimum_timeという2つのdatetime型変数を宣言します。これらは、後でこれらの価格レベルに達した特定の瞬間を参照する必要がある場合に役立ちます。
さらに、価格レンジとブレイクアウトに関連するロジックを処理するために2つのブール変数が宣言されています。1番目のisHaveDailyRange_Pricesはfalseに初期化され、日次レンジ価格(つまり、最大値と最小値)が正常に決定されたかどうかを示すフラグとして機能します。2番目のisHaveRangeBreakもfalseに初期化され、ブレイクアウトが発生したかどうか、つまり価格が日次レンジ外に移動したかどうかを示すフラグとして機能します。さらに、チャートにレンジを視覚的に表示するため、レンジの名前が必要になりますが、ここで宣言できます。
#define RECTANGLE_PREFIX "RANGE RECTANGLE " //--- Prefix for naming range rectangles
#define UPPER_LINE_PREFIX "UPPER LINE "     //--- Prefix for naming upper range line
#define LOWER_LINE_PREFIX "LOWER LINE "     //--- Prefix for naming lower range line
ここでは、取引レンジに関連付けられたさまざまなグラフィカルオブジェクトに名前を付けるためのプレフィックスを作成する3つのプリプロセッサディレクティブを定義します。ディレクティブ「#define RECTANGLE_PREFIX "RANGE RECTANGLE"」を使用することで、取引レンジを表す矩形に対する一貫した命名規則を確立し、これによりチャート上でそれらのオブジェクトを識別および管理しやすくなります。同様に、「#define UPPER_LINE_PREFIX "UPPER LINE"」はレンジの上限境界線専用のプレフィックスを作成し、「#define LOWER_LINE_PREFIX "LOWER LINE "」は下限境界線に対して同様の目的を果たします。これらのプレフィックスを活用することで、レンジに関連するすべてのグラフィカルオブジェクトに体系的で分かりやすい名前を付けることが可能になります。このアプローチは、特にチャート上に複数のオブジェクトが存在する場合、コードの明確性と構成の維持に役立ちます。
この基盤をもとに、実際のコード処理ロジックに進むことができます。ロジックはティックごとのプロセスに基づいて実行されるため、チャート上で処理される各ティックごとに呼び出されるOnTickイベントハンドラに直接移行します。
//+------------------------------------------------------------------+
//| Expert tick function                                             |
//+------------------------------------------------------------------+
void OnTick(){
//---

}
これは、制御ロジックのベースとして使用するデフォルトのティックイベントハンドラです。次に、時間レンジロジックを保持するためのいくつかの変数を宣言する必要があります。
   static datetime midnight = iTime(_Symbol,PERIOD_D1,0);  //--- Get the time of midnight (start of the day) for daily chart
   static datetime sixAM = midnight + 6 * 3600;            //--- Calculate 6 AM based on midnight time
   static datetime scanBarTime = sixAM + 1 * PeriodSeconds(_Period); //--- Set scan time for the next bar after 6 AM
時間関連の関数を管理するために、3つのstatic変数を宣言します。最初の変数であるmidnightには、iTime関数によって返される値が割り当てられます。この関数は、現在の銘柄(_Symbol)の日足チャートにおける深夜の時刻を取得します。この際、期間は PERIOD_D1に設定されており、日足を扱うことを示しています。また、0は現在のバーを指します。これにより、日次計算の基準となる参照ポイントが確立されます。
次に、sixAMの時刻を計算します。これは、midnight変数に6時間(6 * 3600秒、ここで3600秒は1時間=60分×60秒で算出)を加えることで求められます。この計算によって、市場が開いた後に価格動向の分析を開始するための時刻を指定でき、取引日の早朝からの分析が可能になります。
最後に、午前6時以降の次のバーのスキャン時間を示す変数scanBarTimeを設定します。これを実現するために、現在の午前6時のスキャン時間に動的に1バー分を追加します。この「1」はスキャンを進めるバーの数を表しており、PeriodSeconds関数が現在のチャートの時間枠を秒に変換します。たとえば、1時間足チャートの場合、1時間は3600秒に相当します。これを1バー分として午前6時に加えると、午前7時のバーを指します。このようにして、これらのstatic変数は取引戦略内で時間ベースのロジックを実装する上で重要な役割を果たします。
さらに、有効なブレイクアウト時間範囲を定義する変数を宣言することも可能です。たとえば、ブレイクアウトが午前7時以降や午後1時など特定の時間を過ぎて発生した場合、シグナルは無効と見なし、次の日のセットアップを待つようにします。
   static datetime validBreakTime_start = scanBarTime;     //--- Set the start of valid breakout time
   static datetime validBreakTime_end = midnight + (6+5) * 3600; //--- Set the end of valid breakout time to 11 AM
ここでは、取引戦略内で有効なブレイクアウト条件の時間ウィンドウを定義するために、2つの追加のstatic変数を宣言します。最初の変数validBreakTime_startは、前に設定したscanBarTimeの値で初期化されます。これにより、有効なブレイクアウト時間の開始が設定され、午前6時以降の次のバーから始まる価格変動に集中することが可能になります。
2番目の変数であるvalidBreakTime_endは、midnight変数に (6 + 5) * 3600を加算することで計算されます。この式は、有効なブレイクアウト期間の終了を示しており、午前11時に対応します。この時間枠を設定することで、ブレイクアウト条件を評価する明確な範囲が定義され、取引の意思決定がこの指定された範囲内で発生する価格動向に基づいて行われるようになります。これらの準備が整ったら、ロジックの実装を開始できます。最初に考慮すべきなのは、セットアップを毎日確認する必要があるという点です。そのため、新しい日を識別するロジックが必要になります。
   if (isNewDay()){
        //---

   }
if文を使用して新しい日があるかどうかを確認し、新しい日が存在する場合はその中に記述されたコードスニペットを実行します。新しい日を確認するために、カスタムブール関数であるisNewDayを使用します。そのロジックは次の通りです。
bool isNewDay() {
   //--- Flag to indicate if a new day has started
   bool newDay = false;

   //--- Structure to hold the current date and time
   MqlDateTime Str_DateTime;

   //--- Convert the current time to a structured format
   TimeToStruct(TimeCurrent(), Str_DateTime);

   //--- Static variable to store the previous day
   static int prevDay = 0;

   //--- Get the current day from the structured time
   int currDay = Str_DateTime.day;

   //--- If the previous day is the same as the current day, we're still on the same day
   if (prevDay == currDay) {
      newDay = false;
   }
   //--- If the current day differs from the previous one, we have a new day
   else if (prevDay != currDay) {
      //--- Print a message indicating the new day
      Print("WE HAVE A NEW DAY WITH DATE ", currDay);

      //--- Update the previous day to the current day
      prevDay = currDay;

      //--- Set the flag to true, indicating a new day has started
      newDay = true;
   }

   //--- Return whether a new day has started
   return (newDay);
}
ここでは、取引戦略において新しい日が始まったかどうかを判断するためのブール関数isNewDayを定義します。この関数内では、まずブール変数 newDay を false に初期化します。この変数は、新しい日が始まったことを示すフラグとして機能します。現在の日付と時刻を追跡するために、Str_DateTimeという名前のMqlDateTime型構造体を作成します。そして、TimeToStruct関数を使用して現在時刻を構造化形式に変換し、Str_DateTime構造体に日付や時刻に関する情報を格納します。
次に、最後に記録された日付を格納するためのstaticな整数型変数prevDayを宣言し、初期値として 0 を設定します。その後、Str_DateTime構造体から現在の日付を取得し、整数型変数currDayに代入します。
prevDayとcurrDayを比較します。等しい場合は、まだ同じ日であることを意味し、newDayをfalseに設定します。逆に、prevDayがcurrDayと異なる場合は、新しい日が始まったと判断します。この場合、Print関数を用いて新しい日が始まったことを示すメッセージを出力し、prevDay を currDay の値で更新します。その後、newDayフラグをtrueに設定し、新しい日が始まったことを確定します。最後に、この関数はnewDayフラグの値を返します。この値を取引ロジックで活用することで、新しい日が始まった際に実行すべきアクションが必要かどうかを判断できます。
この関数内では、新しい日が始まった場合、その日の計算や制御ロジックのマッピングを以下のようにリセットすることができます。
      //--- Reset values for the new day
      midnight = iTime(_Symbol,PERIOD_D1,0);    //--- Get the new midnight time
      sixAM = midnight + 6 * 3600;              //--- Recalculate 6 AM
      scanBarTime = sixAM + 1 * PeriodSeconds(_Period); //--- Recalculate the scan bar time

      validBreakTime_start = scanBarTime;       //--- Update valid breakout start time
      validBreakTime_end = midnight + (6+5) * 3600; //--- Update valid breakout end time to 11 AM

      maximum_price = -DBL_MAX;                 //--- Reset the maximum price for the new day
      minimum_price = DBL_MAX;                  //--- Reset the minimum price for the new day

      isHaveDailyRange_Prices = false;          //--- Reset the daily range flag for the new day
      isHaveRangeBreak = false;                 //--- Reset the breakout flag for the new day
この関数では、新しい取引日の開始時にさまざまな変数とパラメータをリセットして、新しい計算とデータ追跡の準備をします。まず、現在の日次バーの開始のタイムスタンプを提供する関数iTimeを使用して、現在の日の新しい深夜の時刻を取得します。次に、変数midnightをこの新しい値で更新します。次に、変数midnightをこの新しい値で更新します。
次に、更新された midnight 変数に「6 * 3600」(6時間を秒で表現)を加算して、午前6時の時刻を再計算します。これにより、午前中の取引セッションの開始基準時刻が得られます。その後、PeriodSeconds関数を使用して取得した1期間の秒数を加算し、scanBarTimeを午前6時以降の1バーに設定します。これにより、計算が現在のチャート期間に正確に一致するようになります。
次に、有効なブレイクアウト時間ウィンドウを更新します。validBreakTime_startを再計算された scanBarTimeに設定することで、取引日中のブレイクアウトを検討する開始時刻を示します。また、validBreakTime_endを「midnight + (6 + 5) * 3600」と計算し、午前11時をエンドポイントとして設定します。これにより、ブレイクアウト評価の終了時刻が明確になります。さらに、新しい日の価格変動を追跡するために、maximum_priceとminimum_priceの値をリセットし、maximum_priceを-DBL_MAX(可能な最低値)に、minimum_priceをDBL_MAX(可能な最高値)に初期化します。このリセットにより、その日の最高価格と最低価格を正確に記録することが可能となります。
最後に、ブールフラグisHaveDailyRange_PricesとisHaveRangeBreakをfalseにに設定します。これにより、日次レンジがまだ確立されていないこと、また新しい日の範囲ブレイクアウトがまだ特定されていないことを示します。この完全なリセットにより、システムは新しい計算に向けて準備が整い、一日の進行に合わせて価格動向を正確に監視することが可能になります。これで、バースキャンロジックに進む準備が整いました。ティックごとにスキャンを行う必要はなく、新しいバーが生成された場合にのみスキャンを実行します。そのため、新しいバーの生成を検出するための別の制御ロジックを実装する必要があります。
   if (isNewBar()){
        //---

   }
ここでも、新しいバー生成ロジックを実行するために、if文をisNewBar関数と組み合わせて使用します。適応された関数コードを以下のコードスニペットに示します。
bool isNewBar() {
   //--- Static variable to hold the previous number of bars
   static int prevBars = 0;

   //--- Get the current number of bars on the chart
   int currBars = iBars(_Symbol, _Period);

   //--- If the number of bars hasn't changed, return false
   if (prevBars == currBars) return (false);

   //--- Update the previous bar count with the current one
   prevBars = currBars;

   //--- Return true if a new bar has been formed
   return (true);
}
まず、prevBarsというstatic変数を宣言します。この変数には、チャートに表示されたバーの以前の数が格納されます。staticキーワードにより、関数呼び出し間で変数の値が保持され、バーカウントの変化を効果的に追跡できるようになります。次に、関数iBarsを使用してチャート上の現在のバーの数を取得します。ここで、_Symbolは取引商品を表し、_Periodはチャートの時間枠を表します。この関数は、指定された銘柄と期間で現在利用可能なバーの合計数を返します。
次に、変数currBarsに格納されている現在のバーの数を、前のバーの数prevBarsと比較します。これら2つの値が等しい場合は、前回の確認以降に新しいバーが形成されていないことを示しているため、まだ同じバーにあることを示すためにfalseを返します。カウントが異なる場合は、新しいバーが作成されたことを意味するため、prevBarsをcurrBarsの値で更新するように求められます。最後に、新しいバーが実際に形成されたことを示すためにtrueを返します。次に、関数内で、新しいバーが形成されたときにデータを処理する必要があります。特に、価格データを抽出するための特定の時間条件に焦点を当てます。
      //--- If a new bar has been formed, process the data
      datetime currentBarTime = iTime(_Symbol,_Period,0); //--- Get the time of the current bar

      if (currentBarTime == scanBarTime && !isHaveDailyRange_Prices){
         //--- If it's time to scan and the daily range is not yet extracted
         Print("WE HAVE ENOUGH BARS DATA FOR DOCUMENTATION. MAKE THE EXTRACTION"); //--- Log the extraction process
         int total_bars = int((sixAM - midnight)/PeriodSeconds(_Period)) + 1; //--- Calculate total bars between midnight and 6 AM
         Print("Total Bars for scan = ",total_bars); //--- Log the total number of bars for scanning
         int highest_price_bar_index = -1;   //--- Variable to store the bar index of the highest price
         int lowest_price_bar_index = -1;    //--- Variable to store the bar index of the lowest price

         //---

      }
まず、チャート上の現在のバーの時間を取得するiTime関数を使用して、変数currentBarTimeを宣言します。これにより、特定の価格データを処理する必要がある日中の特定の時点であるかどうかを判断するのに役立ちます。次に、if文で2つの条件を確認します。まず、現在のバーの時間がスキャンバーの時間(分析する予定の指定時間(この場合は午前6時))と一致するかどうかを確認します。次に、フラグisHaveDailyRange_Pricesがfalseであることを確認し、日次レンジの価格がまだ抽出されていないかどうかを確認します。両方の条件が真である場合は、適切なタイミングであり、価格帯データを抽出する必要があることを意味します。
次に、Print関数を使用してメッセージをログに記録し、十分なバーデータが利用可能であり、抽出プロセスが開始されることを示します。これは、実行中にプロセスがいつ、なぜトリガーされたかを追跡するのに役立ちます。次に、深夜から午前6時までの間のバーの合計数を計算します。これは、その期間の価格レンジを決定するために重要です。PeriodSeconds関数は各バーの時間の長さを示し、この長さでsixAMとmidnightの時間差を割ってバーの合計数を計算します。このレンジ内のすべてのバーが含まれるように1を追加します。
最後に、またPrint関数を使用してスキャンするバーの合計数を出力し、highest_price_bar_indexとlowest_price_bar_indexの2つの変数を宣言します。これらの変数を-1に初期化し、観測レンジ内でそれぞれ最高価格と最低価格を含むバーのインデックスを格納するために使用します。この設定により、これらの特定のバーから価格データを抽出できるようになります。プログラムを実行すると、次の結果が得られます。
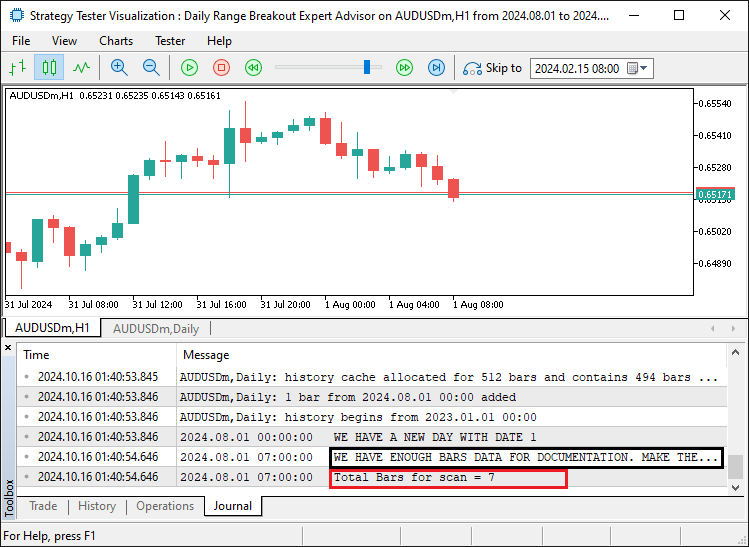
レンジ考慮に必要なバーの数が確定すると、完了ステータスと考慮レンジ内のバーの数を通知することがわかります。この時点で、特定された日次レンジからデータを抽出し、レンジの境界を確立することができます。
         for (int i=1; i<=total_bars ; i++){ //--- Loop through all bars within the defined time range
            double open_i = open(i);         //--- Get the opening price of the i-th bar
            double close_i = close(i);       //--- Get the closing price of the i-th bar

            double highest_price_i = (open_i > close_i) ? open_i : close_i; //--- Determine the highest price between open and close
            double lowest_price_i = (open_i < close_i) ? open_i : close_i;  //--- Determine the lowest price between open and close

            if (highest_price_i > maximum_price){
               //--- If the current highest price is greater than the recorded maximum price
               maximum_price = highest_price_i; //--- Update the maximum price
               highest_price_bar_index = i;     //--- Update the index of the highest price bar
               maximum_time = time(i);          //--- Update the time of the highest price
            }
            if (lowest_price_i < minimum_price){
               //--- If the current lowest price is lower than the recorded minimum price
               minimum_price = lowest_price_i;  //--- Update the minimum price
               lowest_price_bar_index = i;      //--- Update the index of the lowest price bar
               minimum_time = time(i);          //--- Update the time of the lowest price
            }
         }
データ抽出をおこなうには、特定の時間レンジ(深夜から午前6時まで)内のすべてのバーをループして、最高価格と最低価格を決定します。目標は、このレンジ内で発生した最高価格と最低価格を見つけ、発生した時刻を記録することです。まず、「for (int i=1; i<=total_bars; i++)」という文でforループを設定します。この文は、ループが最初のバー(インデックス1)から、午前0時から午前6時までのバーの数を表すために以前に計算されたtotal_barsまで、各バーを実行することを意味します。変数「i」はループ内の各バーのインデックスを表します。
ループ内では、カスタム関数openとcloseをそれぞれ使用して、各バーの始値と終値を取得します。これら2つの変数(始値を表すopen_iと終値を表すclose_i)は、各バーの価格変動を分析するのに役立ちます。先に進む前に、これらのカスタム関数は、グローバルスコープ内の他の場所で定義して直接使用するユーティリティ関数であり、そのコードスニペットは次のとおりです。
//--- Utility functions to retrieve price and time data for a given bar index
double open(int index){return (iOpen(_Symbol,_Period,index));}   //--- Get the opening price
double high(int index){return (iHigh(_Symbol,_Period,index));}   //--- Get the highest price
double low(int index){return (iLow(_Symbol,_Period,index));}     //--- Get the lowest price
double close(int index){return (iClose(_Symbol,_Period,index));} //--- Get the closing price
datetime time(int index){return (iTime(_Symbol,_Period,index));} //--- Get the time of the bar
次に、三項演算を使用して、各バーの最高価格と最低価格を決定します。文「double fastest_price_i = (open_i > close_i) ? open_i : close_i;」は、始値が終値より大きいかどうかを確認します。始値が終値より大きい場合、始値はそのバーの最高価格として設定されます。それ以外の場合は終値が最高値になります。同様に、「double lowest_price_i = (open_i < close_i) ? open_i : close_i;」は始値と終値を比較してバーの最低価格を決定します。
現在のバーの最高価格と最低価格を計算した後、それらをこの時点までの期間全体の最高価格と最低価格と比較します。
- 選択したバーの最高価格が記録された最大価格よりも高い場合、最大価格をこの新しい値に更新します。また、このバーのインデックスをhighest_price_bar_indexに保存し、time関数を使用してこのバーの時間を記録します。この関数は、i番目のバーに関連付けられた時間を取得します。これにより、最高価格がいつ発生したかを追跡できます。
- lowest_price_iが記録されたminimum_priceよりも低い場合は、minimum_priceをこの新しい値に更新します。また、このバーのインデックスをlowest_price_bar_indexに保存し、time関数を使用してこのバーの時間をminimum_timeに記録します。
このプロセスにより、ループの終了までに、深夜から午前6時までの時間レンジ内での最高価格と最低価格、およびそれらの発生時刻が特定されます。これらの値は、後でブレイクアウト分析の主要な価格レベルを設定するために使用します。価格レベルを確実に取得するには、確認のためにログに記録することができます。
         //--- Log the maximum and minimum prices, along with their respective bar indices and times
         Print("Maximum Price = ",maximum_price,", Bar index = ",highest_price_bar_index,", Time = ",maximum_time);
         Print("Minimum Price = ",minimum_price,", Bar index = ",lowest_price_bar_index,", Time = ",minimum_time);
ここでは、確認のために、特定された最高価格と最低価格を、バーインデックスと時間とともに印刷するだけです。プログラムを実行すると、次のデータが得られます。
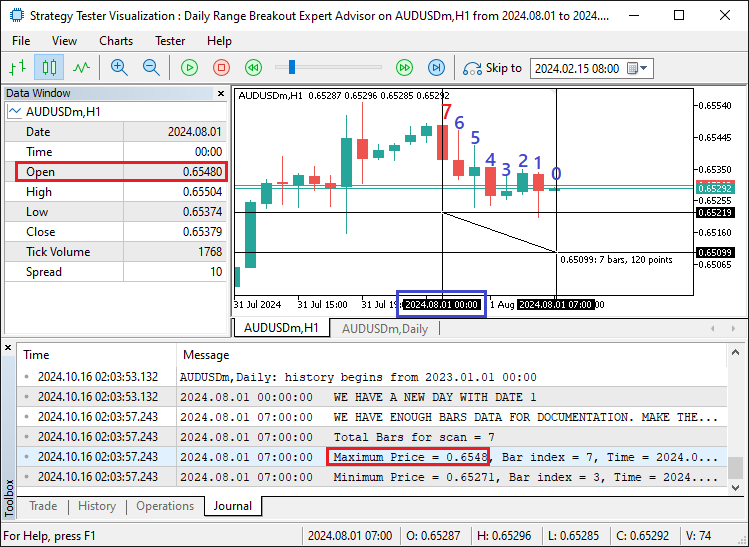
画像から、最大価格は7番目のバーにあり、ログのデータは0.6548で、データウィンドウの始値と一致していることがわかります。時刻は、X軸の十字線の時間と日付のスケールに示されているように、真夜中になります。したがって、毎日の価格が確実に把握でき、それをさらなる分析に使用できます。ただし、必要なデータはすでに取得されているため、日中に分析をおこなう必要はありません。したがって、価格追跡変数のブールフラグをtrueに設定し、翌日まで価格を再度取得するのを待つことができます。
isHaveDailyRange_Prices = true; //--- Set the flag indicating daily range prices have been extracted
フラグを設定したら、すべて完了です。ただし、チャート上のレンジ設定は視覚的に確認できません。したがって、チャート上にレンジをプロットするために使用できる何らかのメカニズムを開発できます。これを実現するには、再利用できる関数を作成する必要があります。最初の関数は、矩形の作成を処理する関数です。
//+------------------------------------------------------------------+
//|       FUNCTION TO CREATE A RECTANGLE                             |
//+------------------------------------------------------------------+
void create_Rectangle(string objName, datetime time1, double price1, datetime time2, double price2, color clr) {
   //--- Check if the object already exists by finding it on the chart
   if (ObjectFind(0, objName) < 0) {
      //--- Create a rectangle object using the defined parameters: name, type, and coordinates
      ObjectCreate(0, objName, OBJ_RECTANGLE, 0, time1, price1, time2, price2);

      //--- Set the time for the first point of the rectangle (start point)
      ObjectSetInteger(0, objName, OBJPROP_TIME, 0, time1);

      //--- Set the price for the first point of the rectangle (start point)
      ObjectSetDouble(0, objName, OBJPROP_PRICE, 0, price1);

      //--- Set the time for the second point of the rectangle (end point)
      ObjectSetInteger(0, objName, OBJPROP_TIME, 1, time2);

      //--- Set the price for the second point of the rectangle (end point)
      ObjectSetDouble(0, objName, OBJPROP_PRICE, 1, price2);

      //--- Enable the fill property for the rectangle, making it filled
      ObjectSetInteger(0, objName, OBJPROP_FILL, true);

      //--- Set the color for the rectangle
      ObjectSetInteger(0, objName, OBJPROP_COLOR, clr);

      //--- Set the rectangle to not appear behind other objects
      ObjectSetInteger(0, objName, OBJPROP_BACK, false);

      //--- Redraw the chart to reflect the new changes
      ChartRedraw(0);
   }
}
ここでは、MetaTraderのチャート上に矩形オブジェクトの作成を処理するvoid関数create_Rectangleを作成します。この関数は、objName(オブジェクトの名前)、time1とprice1(矩形の最初の角の座標)、time2とprice2(反対側の角の座標)、clr(矩形の色)の6つのパラメータを取ります。この関数では、まずObjectFind関数を使用して、指定された名前のオブジェクトがチャート上に既に存在するかどうかを確認します。オブジェクトが見つからない場合(つまり、0未満の値を返す場合)、矩形の作成に進みます。
次に、ObjectCreate関数を呼び出して、チャートID(現在のチャートの場合は0に設定)、オブジェクト名、オブジェクトタイプ(OBJ_RECTANGLE)、および座標(「time1、price1」と「time2、price2」で定義)という必要なパラメータを指定して、矩形オブジェクトを作成します。
次に、ObjectSetInteger関数とObjectSetDouble関数を使用して、矩形の個々のプロパティを設定します。
- 「ObjectSetInteger(0, objName, OBJPROP_TIME, 0, time1)」は、矩形の最初のコーナー(始点)の時間を設定します。
- 「ObjectSetDouble(0, objName, OBJPROP_PRICE, 0, price1)」は、矩形の最初の角(始点)の価格を設定します。
- 「ObjectSetInteger(0, objName, OBJPROP_TIME, 1, time2)」は、矩形の2番目のコーナー(終点)の時間を設定します。
- 「ObjectSetDouble(0, objName, OBJPROP_PRICE, 1, price2)」は、矩形の2番目の角(終点)の価格を設定します。
また、OBJPROP_FILLメソッドを使用して矩形の塗りつぶしプロパティを有効にします。これにより、矩形が単なるアウトラインではなく、チャート上で視覚的に塗りつぶされるようになります。この後、関数に渡された指定された色(clr)を適用して、OBJPROP_COLORメソッドを使用して矩形の色を設定します。さらに、OBJPROP_BACKプロパティを無効にすると、矩形が他のオブジェクトの前面に表示されるように構成されます。最後に、ChartRedraw関数を呼び出してチャートを更新し、新しく作成された矩形がチャートにすぐに表示されるようにします。次に定義する必要がある関数は、開始時間と終了時間のレンジを表示するために使用する線をチャート上に作成するための関数です。
//+------------------------------------------------------------------+
//|      FUNCTION TO CREATE A TREND LINE                             |
//+------------------------------------------------------------------+
void create_Line(string objName, datetime time1, double price1, datetime time2, double price2, int width, color clr, string text) {
   //--- Check if the line object already exists by its name
   if (ObjectFind(0, objName) < 0) {
      //--- Create a trendline object with the specified parameters
      ObjectCreate(0, objName, OBJ_TREND, 0, time1, price1, time2, price2);

      //--- Set the time for the first point of the trendline
      ObjectSetInteger(0, objName, OBJPROP_TIME, 0, time1);

      //--- Set the price for the first point of the trendline
      ObjectSetDouble(0, objName, OBJPROP_PRICE, 0, price1);

      //--- Set the time for the second point of the trendline
      ObjectSetInteger(0, objName, OBJPROP_TIME, 1, time2);

      //--- Set the price for the second point of the trendline
      ObjectSetDouble(0, objName, OBJPROP_PRICE, 1, price2);

      //--- Set the width for the line
      ObjectSetInteger(0, objName, OBJPROP_WIDTH, width);

      //--- Set the color of the trendline
      ObjectSetInteger(0, objName, OBJPROP_COLOR, clr);

      //--- Set the trendline to not be behind other objects
      ObjectSetInteger(0, objName, OBJPROP_BACK, false);

      //--- Retrieve the current chart scale
      long scale = 0;
      if(!ChartGetInteger(0, CHART_SCALE, 0, scale)) {
         //--- Print an error message if unable to retrieve the chart scale
         Print("UNABLE TO GET THE CHART SCALE. DEFAULT OF ", scale, " IS CONSIDERED");
      }
      //--- Set a default font size based on the chart scale
      int fontsize = 11;
      if (scale == 0) { fontsize = 5; }
      else if (scale == 1) { fontsize = 6; }
      else if (scale == 2) { fontsize = 7; }
      else if (scale == 3) { fontsize = 9; }
      else if (scale == 4) { fontsize = 11; }
      else if (scale == 5) { fontsize = 13; }

      //--- Define the description text to appear near the right price
      string txt = " Right Price";
      string objNameDescr = objName + txt;

      //--- Create a text object next to the line to display the description
      ObjectCreate(0, objNameDescr, OBJ_TEXT, 0, time2, price2);

      //--- Set the color for the text
      ObjectSetInteger(0, objNameDescr, OBJPROP_COLOR, clr);

      //--- Set the font size for the text
      ObjectSetInteger(0, objNameDescr, OBJPROP_FONTSIZE, fontsize);

      //--- Anchor the text to the left of the line
      ObjectSetInteger(0, objNameDescr, OBJPROP_ANCHOR, ANCHOR_LEFT);

      //--- Set the text content to display the specified string
      ObjectSetString(0, objNameDescr, OBJPROP_TEXT, " " + text);

      //--- Set the font of the text to "Calibri"
      ObjectSetString(0, objNameDescr, OBJPROP_FONT, "Calibri");

      //--- Redraw the chart to reflect the changes
      ChartRedraw(0);
   }
}
ここで、別のvoid関数create_Lineを作成し、必要なパラメータも渡します。この関数は、objName(線オブジェクトの名前)、time1とprice1(開始点の座標)、time2とprice2(終了点の座標)、width(線の太さ)、clr(線の色)、text(トレンドラインの横に表示される説明)の8つのパラメータを取ります。まず、ObjectFindを使用して、チャート上にトレンドラインがすでに存在するかどうかを確認します。指定された名前のトレンドラインオブジェクトが存在しない場合(0未満を返す)、線の作成を続行します。
トレンドラインを作成するには、ObjectCreate関数を使用します。この関数は、オブジェクトタイプをOBJ_TRENDとして定義し、トレンドラインの開始座標(time1, price1)と終了座標(time2, price2)を割り当てます。
次に、ObjectSetIntegerとObjectSetDoubleを使用して、線の開始点と終了点の両方にプロパティを割り当てます。
- 「ObjectSetInteger(0, objName, OBJPROP_TIME, 0, time1)」は最初のポイントの時間を設定します。
- 「ObjectSetDouble(0, objName, OBJPROP_PRICE, 0, price1)」は最初のポイントの価格を設定します。
- 「ObjectSetInteger(0, objName, OBJPROP_TIME, 1, time2)」は、2番目のポイントの時間を設定します。
- 「ObjectSetDouble(0, objName, OBJPROP_PRICE, 1, price2)」は、2番目のポイントの価格を設定します。
まず、線の太さを制御するOBJPROP_WIDTHプロパティを使用して線の幅を設定し、次に線の色を設定します。次に、OBJPROP_BACKプロパティをfalseに設定して、トレンドラインが他のオブジェクトの前面に表示されるようにします。つまり、トレンドラインは他のチャート要素の背後には表示されません。
トレンドラインの表示を強化するために、ChartGetIntegerを使用して現在のチャートのスケールを取得します。スケールを取得できたら、それを使用して、線の横に表示される説明テキストのフォントサイズを設定します。グラフのスケールに基づいてフォントサイズを調整します。デフォルトは11です。次に、トレンドラインの横に配置する説明ラべル「Right Price」を定義し、元のオブジェクト名に「txt」を追加してobjNameDescrを形成し、このラベルのオブジェクト名を生成します。
次に、ObjectCreate関数を使用してテキストオブジェクトを作成し、それを行の末尾(time2, price2)に配置して、さまざまなプロパティを設定します。
- ObjectSetInteger(0, objNameDescr, OBJPROP_COLOR, clr):トレンドラインの色に合わせてテキストの色を設定
- ObjectSetInteger(0, objNameDescr, OBJPROP_FONTSIZE, fontsize):以前に計算された値に基づいてフォントサイズを設定
- ObjectSetInteger(0, objNameDescr, OBJPROP_ANCHOR, ANCHOR_LEFT):テキストを行の左側に固定
- ObjectSetString(0, objNameDescr, OBJPROP_TEXT, ' ' + text):関数に渡されたtextパラメータに実際のテキストコンテンツを設定
- ObjectSetString(0, objNameDescr, OBJPROP_FONT, 'Calibri'):読みやすくするためにテキストのフォントをCalibriに設定
最後に、ChartRedrawを呼び出してチャートを更新し、新しく作成されたトレンドラインと付随するテキストがチャートに適切に表示されるようにします。次に、これらの関数を呼び出して、レンジの詳細をマップするために使用できます。
         //--- Create visual elements to represent the daily range
         create_Rectangle(RECTANGLE_PREFIX+TimeToString(maximum_time),maximum_time,maximum_price,minimum_time,minimum_price,clrBlue); //--- Create a rectangle for the daily range
         create_Line(UPPER_LINE_PREFIX+TimeToString(midnight),midnight,maximum_price,sixAM,maximum_price,3,clrBlack,DoubleToString(maximum_price,_Digits)); //--- Draw upper range line
         create_Line(LOWER_LINE_PREFIX+TimeToString(midnight),midnight,minimum_price,sixAM,minimum_price,3,clrRed,DoubleToString(minimum_price,_Digits));   //--- Draw lower range line
コードをコンパイルしてプログラムを実行すると、次の詳細が得られます。
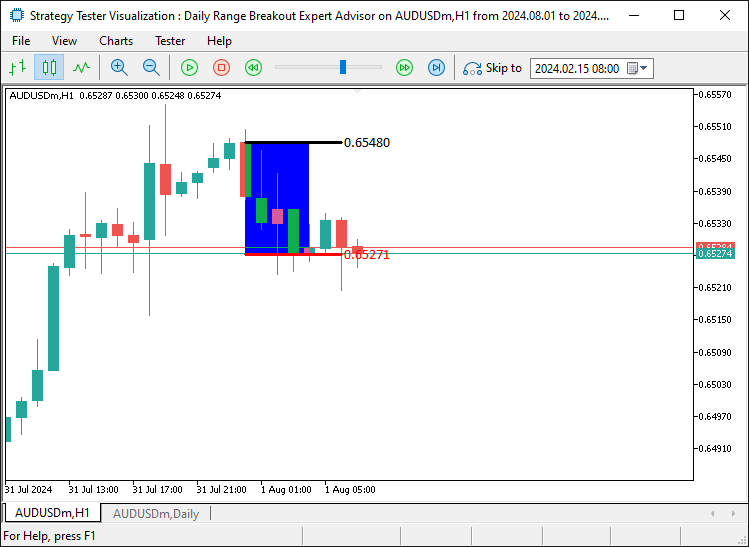
レンジの詳細を視覚的にマッピングしてチャート上にプロットすると、より魅力的になり、価格を参照および確認しやすくなります。さて、次におこなう必要があるのは、ブレイクアウトを確認することです。ここで、レベルブレイクを決定するためにティックごとに確認を実行し、条件が満たされた場合はそれぞれの取引ロジックを開始する必要があります。上位レベルのブレイクアウトについては、次のロジックがあります。
   //--- Get the close price and time of the previous bar
   double barClose = close(1);
   datetime barTime = time(1);

   //--- Check for upper range breakout condition
   if (barClose > maximum_price && isHaveDailyRange_Prices && !isHaveRangeBreak
       && barTime >= validBreakTime_start && barTime <= validBreakTime_end){
      Print("CLOSE Price broke the HIGH range. ",barClose," > ",maximum_price); //--- Log the breakout event
      isHaveRangeBreak = true; //--- Set the flag indicating a breakout occurred
      drawBreakPoint(TimeToString(barTime),barTime,barClose,234,clrBlack,-1); //--- Draw a point to mark the breakout
   }
ここでは、前のバーの終値がその日の最高価格を超えているかどうか、つまり上限のブレイクアウトの兆候があるかどうかを確認します。まず、closeおよびtimeカスタム関数を使用して前のバーの終値と時刻を取得し、これらの値をそれぞれbarCloseおよびbarTimeに保存します。これにより、分析しているバーの終値と時間を参照できるようになります。
次に、ブレイクアウトが発生したかどうかを確認するための一連の確認を実行します。barCloseがmaximum_priceより大きいかどうかを確認し、終値がその日の最高値を超えていることを確認します。また、isHaveDailyRange_Pricesフラグを使用して日次レンジの価格が抽出されていることを確認し、「!isHaveRangeBreak」フラグを使用して以前にブレイクアウトが検出されていないことを確認します。さらに、barTimeがvalidBreakTime_startとvalidBreakTime_endの間にあるかどうかを確認することで、ブレイクアウトが有効なブレイクアウトウィンドウ内で発生することを確認します。
すべての条件が満たされた場合、終値が上限レンジを突破したというメッセージを出力してブレイクアウトイベントを記録します。次に、isHaveRangeBreakをtrueに設定し、ブレイクアウトが検出されたことをマークします。最後に、drawBreakPoint関数を呼び出して、チャート上でこのブレイクアウトを視覚的にマークします。この関数は、バーの時間、終値、マーカーのサイズ、色、優先度を使用して、ブレイクアウトの視覚的な表現を表示します。以下は、前の関数と似た関数のロジックです。
//+------------------------------------------------------------------+
//|       FUNCTION TO CREATE AN ARROW                                |
//+------------------------------------------------------------------+
void drawBreakPoint(string objName, datetime time, double price, int arrCode, color clr, int direction) {
   //--- Check if the arrow object already exists on the chart
   if (ObjectFind(0, objName) < 0) {
      //--- Create an arrow object with the specified time, price, and arrow code
      ObjectCreate(0, objName, OBJ_ARROW, 0, time, price);

      //--- Set the arrow's code (symbol)
      ObjectSetInteger(0, objName, OBJPROP_ARROWCODE, arrCode);

      //--- Set the color for the arrow
      ObjectSetInteger(0, objName, OBJPROP_COLOR, clr);

      //--- Set the font size for the arrow
      ObjectSetInteger(0, objName, OBJPROP_FONTSIZE, 12);

      //--- Set the anchor position for the arrow based on the direction
      if (direction > 0) ObjectSetInteger(0, objName, OBJPROP_ANCHOR, ANCHOR_TOP);
      if (direction < 0) ObjectSetInteger(0, objName, OBJPROP_ANCHOR, ANCHOR_BOTTOM);

      //--- Define a text label for the break point
      string txt = " Break";
      string objNameDescr = objName + txt;

      //--- Create a text object for the break point description
      ObjectCreate(0, objNameDescr, OBJ_TEXT, 0, time, price);

      //--- Set the color for the text description
      ObjectSetInteger(0, objNameDescr, OBJPROP_COLOR, clr);

      //--- Set the font size for the text
      ObjectSetInteger(0, objNameDescr, OBJPROP_FONTSIZE, 12);

      //--- Adjust the text anchor based on the direction of the arrow
      if (direction > 0) {
         ObjectSetInteger(0, objNameDescr, OBJPROP_ANCHOR, ANCHOR_LEFT_UPPER);
         ObjectSetString(0, objNameDescr, OBJPROP_TEXT, " " + txt);
      }
      if (direction < 0) {
         ObjectSetInteger(0, objNameDescr, OBJPROP_ANCHOR, ANCHOR_LEFT_LOWER);
         ObjectSetString(0, objNameDescr, OBJPROP_TEXT, " " + txt);
      }
   }
   //--- Redraw the chart to reflect the new objects
   ChartRedraw(0);
}
下位レンジのブレイクアウトを確認するには、上位レベルのブレイクアウトを探すときと同じロジックを使用します。
   //--- Check for lower range breakout condition
   else if (barClose < minimum_price && isHaveDailyRange_Prices && !isHaveRangeBreak
            && barTime >= validBreakTime_start && barTime <= validBreakTime_end){
      Print("CLOSE Price broke the LOW range. ",barClose," < ",minimum_price); //--- Log the breakout event
      isHaveRangeBreak = true; //--- Set the flag indicating a breakout occurred
      drawBreakPoint(TimeToString(barTime),barTime,barClose,233,clrBlue,1); //--- Draw a point to mark the breakout
   }
コンパイルすると、次の結果が得られます。
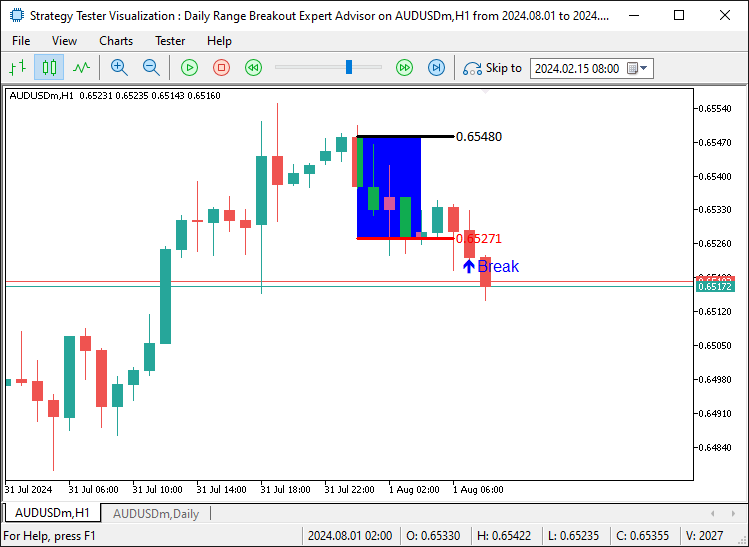
うまくいきました。下限レベルをブレイクアウトすると、チャート上にブレイクポイント矢印が表示され、ブレイクが発生したローソク足が視覚的に特定されます。プログラムを実行して、反対のブレイクアウトも見てみましょう。
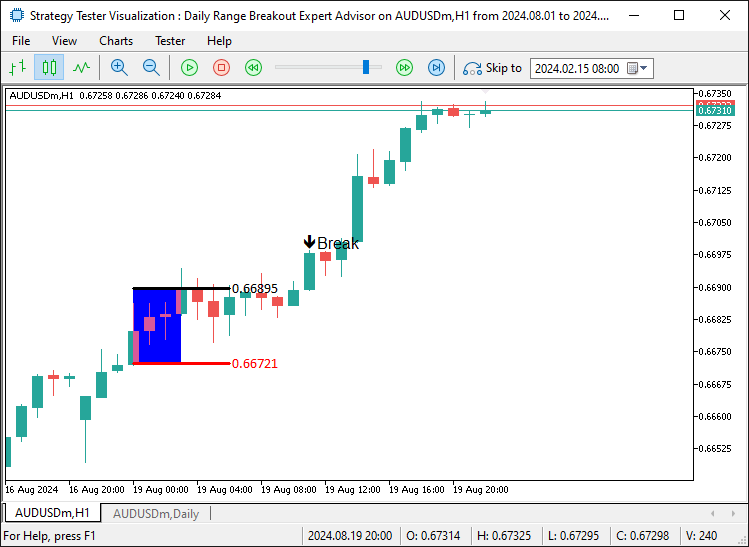
うまくいきました。また、予想通り、上位レベルでブレイクアウトが発生していることもわかります。次に必要なのは、これらのブレイクアウトが発生したらポジションを建てることだけです。
   double Ask = NormalizeDouble(SymbolInfoDouble(_Symbol,SYMBOL_ASK),_Digits);
   double Bid = NormalizeDouble(SymbolInfoDouble(_Symbol,SYMBOL_BID),_Digits);

   //--- Check for upper range breakout condition
   if (barClose > maximum_price && isHaveDailyRange_Prices && !isHaveRangeBreak
       && barTime >= validBreakTime_start && barTime <= validBreakTime_end){
      Print("CLOSE Price broke the HIGH range. ",barClose," > ",maximum_price); //--- Log the breakout event
      isHaveRangeBreak = true; //--- Set the flag indicating a breakout occurred
      drawBreakPoint(TimeToString(barTime),barTime,barClose,234,clrBlack,-1); //--- Draw a point to mark the breakout
      obj_Trade.Buy(0.01,_Symbol,Ask,minimum_price,Bid+(maximum_price-minimum_price)*2);
   }
   //--- Check for lower range breakout condition
   else if (barClose < minimum_price && isHaveDailyRange_Prices && !isHaveRangeBreak
            && barTime >= validBreakTime_start && barTime <= validBreakTime_end){
      Print("CLOSE Price broke the LOW range. ",barClose," < ",minimum_price); //--- Log the breakout event
      isHaveRangeBreak = true; //--- Set the flag indicating a breakout occurred
      drawBreakPoint(TimeToString(barTime),barTime,barClose,233,clrBlue,1); //--- Draw a point to mark the breakout
      obj_Trade.Sell(0.01,_Symbol,Bid,maximum_price,Ask-(maximum_price-minimum_price)*2);
   }
このロジックにより、ポジションを建てることができるようになりました。プログラムを実行すると、次の出力が得られます。
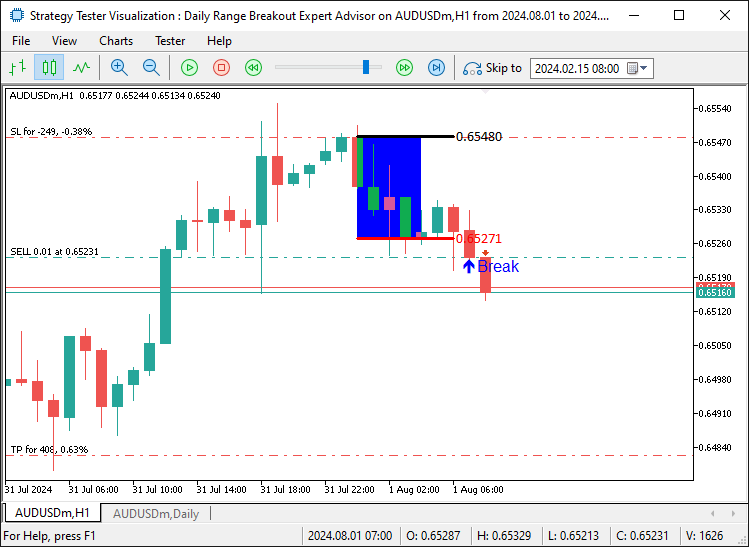
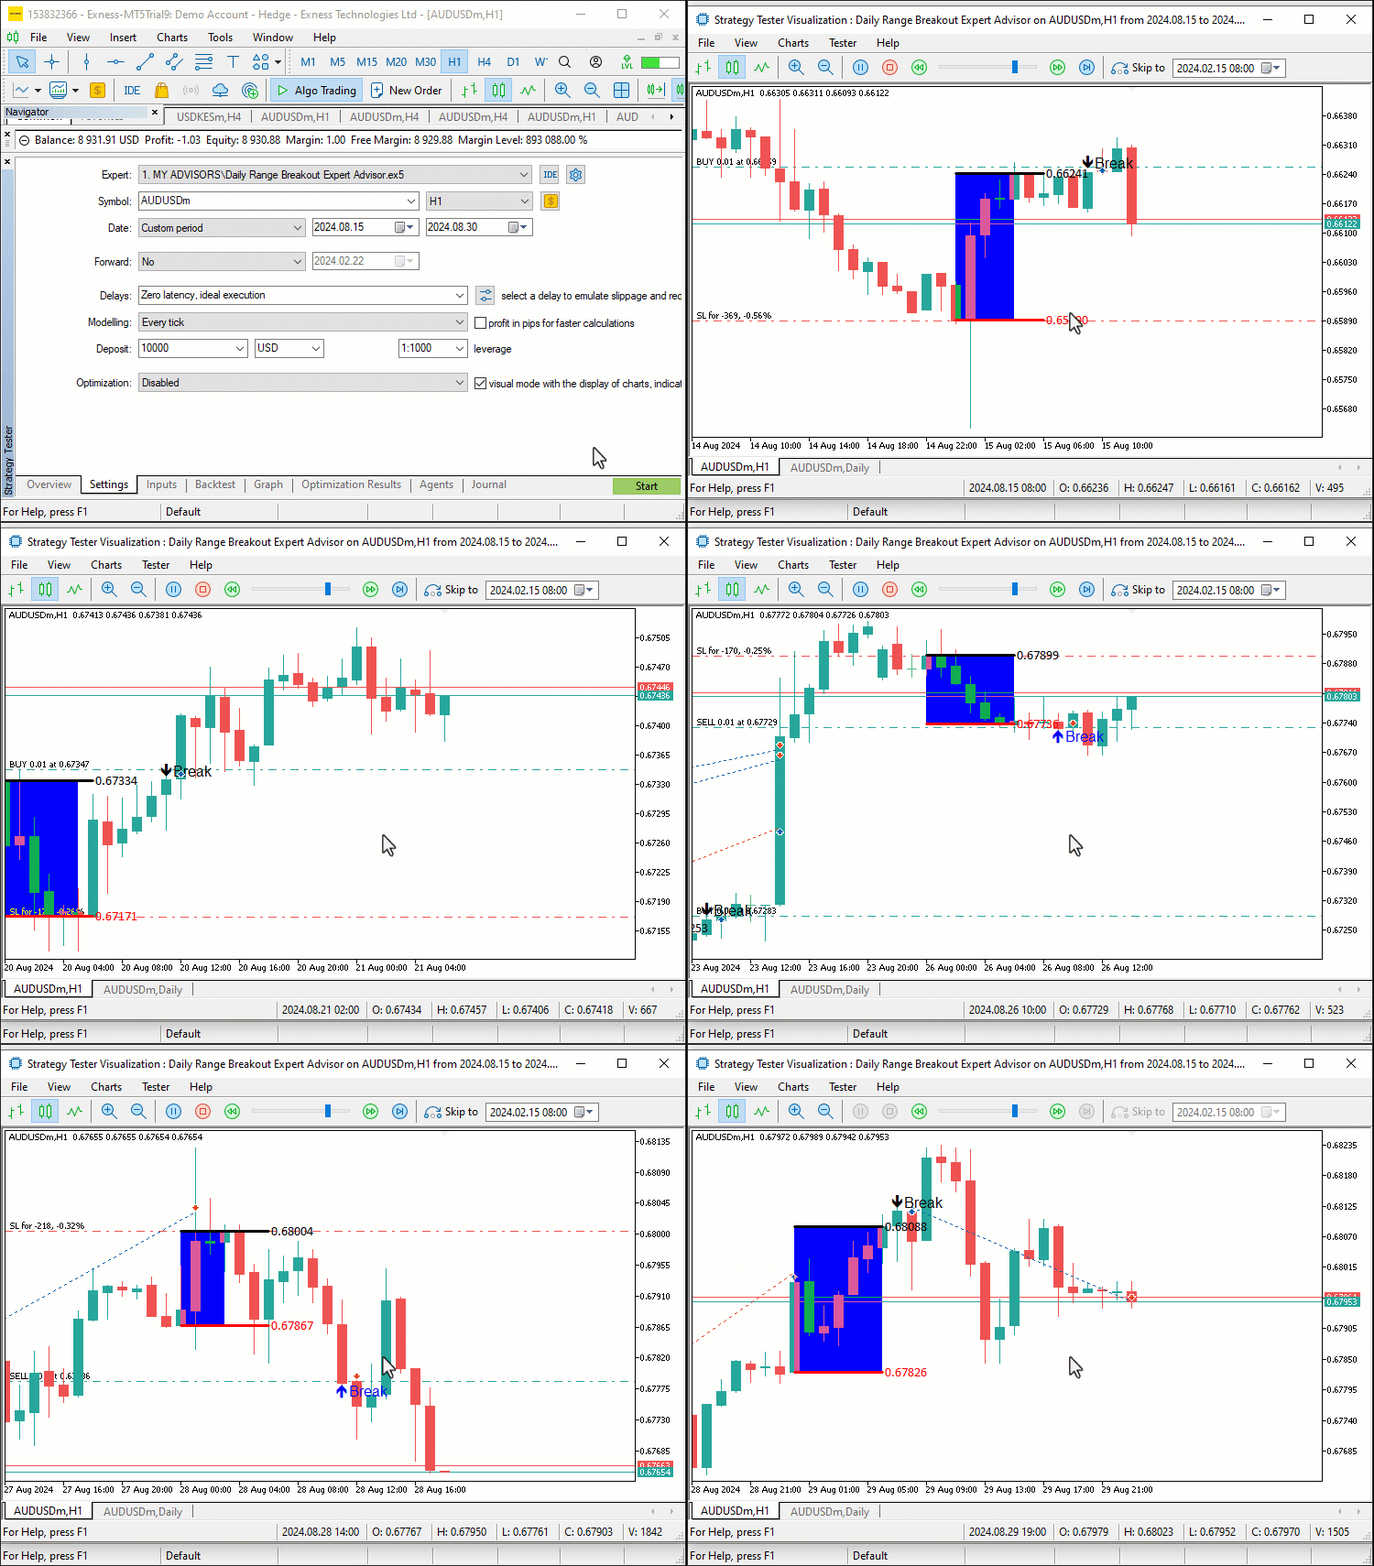
画像から、例えば売りポジションのストップロスを上限に設定し、テイクプロフィットをエントリーポイントより下のレンジサイズの2倍に設定するなどして、ポジションを正しく開いていることを確認できます。次のセクションでは、プログラムのテストに焦点を当て、そのパフォーマンスを評価し、最適な結果を得るためにパラメータを微調整します。
バックテストと最適化
実装が完了したら、次の重要なステップは、EAを徹底的にテストし、そのパフォーマンスを評価し、パラメータを最適化することです。効果的なテストにより、様々な市場環境において戦略が期待通りに動作することが保証され、取引中に予期せぬ問題が発生するリスクを最小限に抑えることができます。ここでは、MetaTrader 5ストラテジーテスターを使ってバックテストと最適化をおこない、戦略に最適な入力値を見つけます。
最適化をおこなうには、設定セクションに入力する必要があります。ここで採用する最適化では、リスクと報酬の比率、ブレイクの有効時間(時間単位)、およびブレイクが発生したときの取引の方向を考慮します。つまり、より低いレベルのブレイクがあった場合、ショートではなくロングをおこなうことを検討することができます。それだけです。採用しているロジックは次のとおりです。
enum trade_direction {Default_Trade_Directions,Invert_Trade_Directions};

input int r2r = 2;
input int hoursValidity = 5;
input trade_direction direction_of_trade = Default_Trade_Directions;
ここでは、列挙型を定義し、取引の動作と戦略パラメータを制御するために使用するいくつかの入力変数を初期化します。まず、列挙型trade_directionを宣言します。これは、Default_Trade_DirectionsとInvert_Trade_Directionsの2つの値を定義します。enum(列挙)はMQL5のユーザー定義データ型であり、整数定数に名前を割り当てることができるため、コードの読みやすさと管理しやすさが向上します。この場合、trade_directionは、取引がデフォルトの取引方向に従うか、特定の条件に基づいて方向が反転するかを制御するのに役立ちます。
次に、ユーザーがコード自体を編集せずにEA設定から直接値を変更できるようにする3つの入力変数を定義しますが、これらはプログラムを最適化するときにさらに役立ちます。最初の変数はr2rで、デフォルトでは2に設定されており、これを使用して戦略のリスクと報酬の側面を制御します。inputキーワードは、この変数がユーザーによって外部から調整できることを示します。2番目の入力はhoursValidityで、デフォルト値5で初期化されます。この変数は、ブレイクアウト取引条件またはシグナルが時間単位で有効な期間を制御します。
最後に、3番目の入力はdirection_of_tradeで、これはtrade_direction型(前に定義した列挙型)です。デフォルトではDefault_Trade_Directionsに設定されていますが、取引を反対方向に実行したい場合は、ユーザーがInvert_Trade_Directionsに変更できます。この入力により、EAのコアロジックを変更することなく、取引の方向を柔軟に決定できるようになります。これを念頭に置いて、動的な側面を追加するには、コード内のそれぞれのstaticパラメータを置き換えるだけです。
   static datetime midnight = iTime(_Symbol,PERIOD_D1,0);  //--- Get the time of midnight (start of the day) for daily chart
   static datetime sixAM = midnight + 6 * 3600;            //--- Calculate 6 AM based on midnight time
   static datetime scanBarTime = sixAM + 1 * PeriodSeconds(_Period); //--- Set scan time for the next bar after 6 AM

   static datetime validBreakTime_start = scanBarTime;     //--- Set the start of valid breakout time
   static datetime validBreakTime_end = midnight + (6+hoursValidity) * 3600; //--- Set the end of valid breakout time to 11 AM

   if (isNewDay()){
      //--- Reset values for the new day
      midnight = iTime(_Symbol,PERIOD_D1,0);    //--- Get the new midnight time
      sixAM = midnight + 6 * 3600;              //--- Recalculate 6 AM
      scanBarTime = sixAM + 1 * PeriodSeconds(_Period); //--- Recalculate the scan bar time

      validBreakTime_start = scanBarTime;       //--- Update valid breakout start time
      validBreakTime_end = midnight + (6+hoursValidity) * 3600; //--- Update valid breakout end time to 11 AM

      maximum_price = -DBL_MAX;                 //--- Reset the maximum price for the new day
      minimum_price = DBL_MAX;                  //--- Reset the minimum price for the new day

      isHaveDailyRange_Prices = false;          //--- Reset the daily range flag for the new day
      isHaveRangeBreak = false;                 //--- Reset the breakout flag for the new day
   }

   //---

   //--- Check for upper range breakout condition
   if (barClose > maximum_price && isHaveDailyRange_Prices && !isHaveRangeBreak
       && barTime >= validBreakTime_start && barTime <= validBreakTime_end){
      Print("CLOSE Price broke the HIGH range. ",barClose," > ",maximum_price); //--- Log the breakout event
      isHaveRangeBreak = true; //--- Set the flag indicating a breakout occurred
      drawBreakPoint(TimeToString(barTime),barTime,barClose,234,clrBlack,-1); //--- Draw a point to mark the breakout

      if (direction_of_trade == Default_Trade_Directions){
         obj_Trade.Buy(0.01,_Symbol,Ask,minimum_price,Bid+(maximum_price-minimum_price)*r2r);
      }
      else if (direction_of_trade == Invert_Trade_Directions){
         obj_Trade.Sell(0.01,_Symbol,Bid,Ask+(maximum_price-minimum_price),Ask-(maximum_price-minimum_price)*r2r);
      }
   }
   //--- Check for lower range breakout condition
   else if (barClose < minimum_price && isHaveDailyRange_Prices && !isHaveRangeBreak
            && barTime >= validBreakTime_start && barTime <= validBreakTime_end){
      Print("CLOSE Price broke the LOW range. ",barClose," < ",minimum_price); //--- Log the breakout event
      isHaveRangeBreak = true; //--- Set the flag indicating a breakout occurred
      drawBreakPoint(TimeToString(barTime),barTime,barClose,233,clrBlue,1); //--- Draw a point to mark the breakout

      if (direction_of_trade == Default_Trade_Directions){
         obj_Trade.Sell(0.01,_Symbol,Bid,maximum_price,Ask-(maximum_price-minimum_price)*r2r);
      }
      else if (direction_of_trade == Invert_Trade_Directions){
         obj_Trade.Buy(0.01,_Symbol,Ask,Bid-(maximum_price-minimum_price),Bid+(maximum_price-minimum_price)*r2r);
      }
   }
変更が追加され、わかりやすくするために特定のセクションが強調表示されました。これをコンパイルすると、以下のように入力セクションに入力が表示されるので、その中から選択して最適化をおこない、プログラムに最適な取引パラメータを見つけることができます。
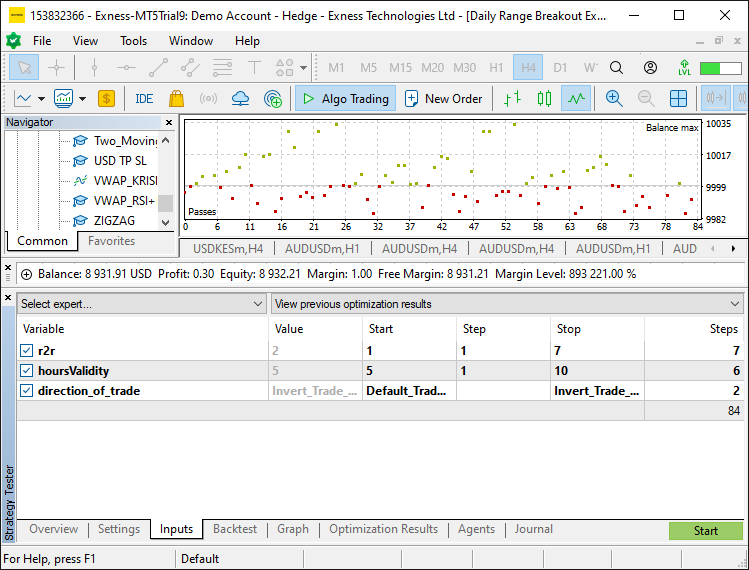
画像から、最適化入力があり、開始ボタンをクリックするだけで最適化を開始できることがわかります。この場合、プログラムを過度に最適化しないように、1か月だけを選択しました。完了したら、プログラムの正しい設定を確立し、バックテストの目的で使用します。得られた結果は次のとおりです。
//+------------------------------------------------------------------+
//|                          Daily Range Breakout Expert Advisor.mq5 |
//|      Copyright 2024, ALLAN MUNENE MUTIIRIA. #@Forex Algo-Trader. |
//|                                     https://forexalg0-trader.com |
//+------------------------------------------------------------------+
#property copyright "Copyright 2024, ALLAN MUNENE MUTIIRIA. #@Forex Algo-Trader"
#property link      "https://forexalg0-trader.com"
#property description "Daily Range Breakout Expert Advisor"
#property version   "1.00"

#include <Trade/Trade.mqh>
CTrade obj_Trade;

enum trade_direction {Default_Trade_Directions,Invert_Trade_Directions};

input int r2r = 2;
input int hoursValidity = 5;
input trade_direction direction_of_trade = Default_Trade_Directions;

double maximum_price = -DBL_MAX;  //--- Initialize the maximum price with the smallest possible value
double minimum_price = DBL_MAX;   //--- Initialize the minimum price with the largest possible value
datetime maximum_time, minimum_time; //--- Declare variables to store the time of the highest and lowest prices
bool isHaveDailyRange_Prices = false; //--- Boolean flag to check if daily range prices are extracted
bool isHaveRangeBreak = false;        //--- Boolean flag to check if a range breakout has occurred

#define RECTANGLE_PREFIX "RANGE RECTANGLE " //--- Prefix for naming range rectangles
#define UPPER_LINE_PREFIX "UPPER LINE "     //--- Prefix for naming upper range line
#define LOWER_LINE_PREFIX "LOWER LINE "     //--- Prefix for naming lower range line

//+------------------------------------------------------------------+
//| Expert initialization function                                   |
//+------------------------------------------------------------------+
int OnInit(){
   //--- Initialization code can be placed here if needed

   //---
   return(INIT_SUCCEEDED); //--- Return successful initialization
}
//+------------------------------------------------------------------+
//| Expert deinitialization function                                 |
//+------------------------------------------------------------------+
void OnDeinit(const int reason){
   //--- Deinitialization code can be placed here if needed
}
//+------------------------------------------------------------------+
//| Expert tick function                                             |
//+------------------------------------------------------------------+
void OnTick(){
   //---
   static datetime midnight = iTime(_Symbol,PERIOD_D1,0);  //--- Get the time of midnight (start of the day) for daily chart
   static datetime sixAM = midnight + 6 * 3600;            //--- Calculate 6 AM based on midnight time
   static datetime scanBarTime = sixAM + 1 * PeriodSeconds(_Period); //--- Set scan time for the next bar after 6 AM

   static datetime validBreakTime_start = scanBarTime;     //--- Set the start of valid breakout time
   static datetime validBreakTime_end = midnight + (6+hoursValidity) * 3600; //--- Set the end of valid breakout time to 11 AM

   if (isNewDay()){
      //--- Reset values for the new day
      midnight = iTime(_Symbol,PERIOD_D1,0);    //--- Get the new midnight time
      sixAM = midnight + 6 * 3600;              //--- Recalculate 6 AM
      scanBarTime = sixAM + 1 * PeriodSeconds(_Period); //--- Recalculate the scan bar time

      validBreakTime_start = scanBarTime;       //--- Update valid breakout start time
      validBreakTime_end = midnight + (6+hoursValidity) * 3600; //--- Update valid breakout end time to 11 AM

      maximum_price = -DBL_MAX;                 //--- Reset the maximum price for the new day
      minimum_price = DBL_MAX;                  //--- Reset the minimum price for the new day

      isHaveDailyRange_Prices = false;          //--- Reset the daily range flag for the new day
      isHaveRangeBreak = false;                 //--- Reset the breakout flag for the new day
   }

   if (isNewBar()){
      //--- If a new bar has been formed, process the data
      datetime currentBarTime = iTime(_Symbol,_Period,0); //--- Get the time of the current bar

      if (currentBarTime == scanBarTime && !isHaveDailyRange_Prices){
         //--- If it's time to scan and the daily range is not yet extracted
         Print("WE HAVE ENOUGH BARS DATA FOR DOCUMENTATION. MAKE THE EXTRACTION"); //--- Log the extraction process
         int total_bars = int((sixAM - midnight)/PeriodSeconds(_Period)) + 1; //--- Calculate total bars between midnight and 6 AM
         Print("Total Bars for scan = ",total_bars); //--- Log the total number of bars for scanning
         int highest_price_bar_index = -1;   //--- Variable to store the bar index of the highest price
         int lowest_price_bar_index = -1;    //--- Variable to store the bar index of the lowest price

         for (int i=1; i<=total_bars ; i++){ //--- Loop through all bars within the defined time range
            double open_i = open(i);         //--- Get the opening price of the i-th bar
            double close_i = close(i);       //--- Get the closing price of the i-th bar

            double highest_price_i = (open_i > close_i) ? open_i : close_i; //--- Determine the highest price between open and close
            double lowest_price_i = (open_i < close_i) ? open_i : close_i;  //--- Determine the lowest price between open and close

            if (highest_price_i > maximum_price){
               //--- If the current highest price is greater than the recorded maximum price
               maximum_price = highest_price_i; //--- Update the maximum price
               highest_price_bar_index = i;     //--- Update the index of the highest price bar
               maximum_time = time(i);          //--- Update the time of the highest price
            }
            if (lowest_price_i < minimum_price){
               //--- If the current lowest price is lower than the recorded minimum price
               minimum_price = lowest_price_i;  //--- Update the minimum price
               lowest_price_bar_index = i;      //--- Update the index of the lowest price bar
               minimum_time = time(i);          //--- Update the time of the lowest price
            }
         }
         //--- Log the maximum and minimum prices, along with their respective bar indices and times
         Print("Maximum Price = ",maximum_price,", Bar index = ",highest_price_bar_index,", Time = ",maximum_time);
         Print("Minimum Price = ",minimum_price,", Bar index = ",lowest_price_bar_index,", Time = ",minimum_time);

         //--- Create visual elements to represent the daily range
         create_Rectangle(RECTANGLE_PREFIX+TimeToString(maximum_time),maximum_time,maximum_price,minimum_time,minimum_price,clrBlue); //--- Create a rectangle for the daily range
         create_Line(UPPER_LINE_PREFIX+TimeToString(midnight),midnight,maximum_price,sixAM,maximum_price,3,clrBlack,DoubleToString(maximum_price,_Digits)); //--- Draw upper range line
         create_Line(LOWER_LINE_PREFIX+TimeToString(midnight),midnight,minimum_price,sixAM,minimum_price,3,clrRed,DoubleToString(minimum_price,_Digits));   //--- Draw lower range line

         isHaveDailyRange_Prices = true; //--- Set the flag indicating daily range prices have been extracted
      }
   }

   //--- Get the close price and time of the previous bar
   double barClose = close(1);
   datetime barTime = time(1);

   double Ask = NormalizeDouble(SymbolInfoDouble(_Symbol,SYMBOL_ASK),_Digits);
   double Bid = NormalizeDouble(SymbolInfoDouble(_Symbol,SYMBOL_BID),_Digits);

   //--- Check for upper range breakout condition
   if (barClose > maximum_price && isHaveDailyRange_Prices && !isHaveRangeBreak
       && barTime >= validBreakTime_start && barTime <= validBreakTime_end){
      Print("CLOSE Price broke the HIGH range. ",barClose," > ",maximum_price); //--- Log the breakout event
      isHaveRangeBreak = true; //--- Set the flag indicating a breakout occurred
      drawBreakPoint(TimeToString(barTime),barTime,barClose,234,clrBlack,-1); //--- Draw a point to mark the breakout

      if (direction_of_trade == Default_Trade_Directions){
         obj_Trade.Buy(0.01,_Symbol,Ask,minimum_price,Bid+(maximum_price-minimum_price)*r2r);
      }
      else if (direction_of_trade == Invert_Trade_Directions){
         obj_Trade.Sell(0.01,_Symbol,Bid,Ask+(maximum_price-minimum_price),Ask-(maximum_price-minimum_price)*r2r);
      }
   }
   //--- Check for lower range breakout condition
   else if (barClose < minimum_price && isHaveDailyRange_Prices && !isHaveRangeBreak
            && barTime >= validBreakTime_start && barTime <= validBreakTime_end){
      Print("CLOSE Price broke the LOW range. ",barClose," < ",minimum_price); //--- Log the breakout event
      isHaveRangeBreak = true; //--- Set the flag indicating a breakout occurred
      drawBreakPoint(TimeToString(barTime),barTime,barClose,233,clrBlue,1); //--- Draw a point to mark the breakout

      if (direction_of_trade == Default_Trade_Directions){
         obj_Trade.Sell(0.01,_Symbol,Bid,maximum_price,Ask-(maximum_price-minimum_price)*r2r);
      }
      else if (direction_of_trade == Invert_Trade_Directions){
         obj_Trade.Buy(0.01,_Symbol,Ask,Bid-(maximum_price-minimum_price),Bid+(maximum_price-minimum_price)*r2r);
      }
   }
}

//--- Utility functions to retrieve price and time data for a given bar index
double open(int index){return (iOpen(_Symbol,_Period,index));}   //--- Get the opening price
double high(int index){return (iHigh(_Symbol,_Period,index));}   //--- Get the highest price
double low(int index){return (iLow(_Symbol,_Period,index));}     //--- Get the lowest price
double close(int index){return (iClose(_Symbol,_Period,index));} //--- Get the closing price
datetime time(int index){return (iTime(_Symbol,_Period,index));} //--- Get the time of the bar

//+------------------------------------------------------------------+
//|       FUNCTION TO CREATE A RECTANGLE                             |
//+------------------------------------------------------------------+
void create_Rectangle(string objName, datetime time1, double price1, datetime time2, double price2, color clr) {
   //--- Check if the object already exists by finding it on the chart
   if (ObjectFind(0, objName) < 0) {
      //--- Create a rectangle object using the defined parameters: name, type, and coordinates
      ObjectCreate(0, objName, OBJ_RECTANGLE, 0, time1, price1, time2, price2);

      //--- Set the time for the first point of the rectangle (start point)
      ObjectSetInteger(0, objName, OBJPROP_TIME, 0, time1);

      //--- Set the price for the first point of the rectangle (start point)
      ObjectSetDouble(0, objName, OBJPROP_PRICE, 0, price1);

      //--- Set the time for the second point of the rectangle (end point)
      ObjectSetInteger(0, objName, OBJPROP_TIME, 1, time2);

      //--- Set the price for the second point of the rectangle (end point)
      ObjectSetDouble(0, objName, OBJPROP_PRICE, 1, price2);

      //--- Enable the fill property for the rectangle, making it filled
      ObjectSetInteger(0, objName, OBJPROP_FILL, true);

      //--- Set the color for the rectangle
      ObjectSetInteger(0, objName, OBJPROP_COLOR, clr);

      //--- Set the rectangle to not appear behind other objects
      ObjectSetInteger(0, objName, OBJPROP_BACK, false);

      //--- Redraw the chart to reflect the new changes
      ChartRedraw(0);
   }
}
//+------------------------------------------------------------------+
//|      FUNCTION TO CREATE A TREND LINE                             |
//+------------------------------------------------------------------+
void create_Line(string objName, datetime time1, double price1, datetime time2, double price2, int width, color clr, string text) {
   //--- Check if the line object already exists by its name
   if (ObjectFind(0, objName) < 0) {
      //--- Create a trendline object with the specified parameters
      ObjectCreate(0, objName, OBJ_TREND, 0, time1, price1, time2, price2);

      //--- Set the time for the first point of the trendline
      ObjectSetInteger(0, objName, OBJPROP_TIME, 0, time1);

      //--- Set the price for the first point of the trendline
      ObjectSetDouble(0, objName, OBJPROP_PRICE, 0, price1);

      //--- Set the time for the second point of the trendline
      ObjectSetInteger(0, objName, OBJPROP_TIME, 1, time2);

      //--- Set the price for the second point of the trendline
      ObjectSetDouble(0, objName, OBJPROP_PRICE, 1, price2);

      //--- Set the width for the line
      ObjectSetInteger(0, objName, OBJPROP_WIDTH, width);

      //--- Set the color of the trendline
      ObjectSetInteger(0, objName, OBJPROP_COLOR, clr);

      //--- Set the trendline to not be behind other objects
      ObjectSetInteger(0, objName, OBJPROP_BACK, false);

      //--- Retrieve the current chart scale
      long scale = 0;
      if(!ChartGetInteger(0, CHART_SCALE, 0, scale)) {
         //--- Print an error message if unable to retrieve the chart scale
         Print("UNABLE TO GET THE CHART SCALE. DEFAULT OF ", scale, " IS CONSIDERED");
      }
      //--- Set a default font size based on the chart scale
      int fontsize = 11;
      if (scale == 0) { fontsize = 5; }
      else if (scale == 1) { fontsize = 6; }
      else if (scale == 2) { fontsize = 7; }
      else if (scale == 3) { fontsize = 9; }
      else if (scale == 4) { fontsize = 11; }
      else if (scale == 5) { fontsize = 13; }

      //--- Define the description text to appear near the right price
      string txt = " Right Price";
      string objNameDescr = objName + txt;

      //--- Create a text object next to the line to display the description
      ObjectCreate(0, objNameDescr, OBJ_TEXT, 0, time2, price2);

      //--- Set the color for the text
      ObjectSetInteger(0, objNameDescr, OBJPROP_COLOR, clr);

      //--- Set the font size for the text
      ObjectSetInteger(0, objNameDescr, OBJPROP_FONTSIZE, fontsize);

      //--- Anchor the text to the left of the line
      ObjectSetInteger(0, objNameDescr, OBJPROP_ANCHOR, ANCHOR_LEFT);

      //--- Set the text content to display the specified string
      ObjectSetString(0, objNameDescr, OBJPROP_TEXT, " " + text);

      //--- Set the font of the text to "Calibri"
      ObjectSetString(0, objNameDescr, OBJPROP_FONT, "Calibri");

      //--- Redraw the chart to reflect the changes
      ChartRedraw(0);
   }
}

bool isNewBar() {
   //--- Static variable to hold the previous number of bars
   static int prevBars = 0;

   //--- Get the current number of bars on the chart
   int currBars = iBars(_Symbol, _Period);

   //--- If the number of bars hasn't changed, return false
   if (prevBars == currBars) return (false);

   //--- Update the previous bar count with the current one
   prevBars = currBars;

   //--- Return true if a new bar has been formed
   return (true);
}

bool isNewDay() {
   //--- Flag to indicate if a new day has started
   bool newDay = false;

   //--- Structure to hold the current date and time
   MqlDateTime Str_DateTime;

   //--- Convert the current time to a structured format
   TimeToStruct(TimeCurrent(), Str_DateTime);

   //--- Static variable to store the previous day
   static int prevDay = 0;

   //--- Get the current day from the structured time
   int currDay = Str_DateTime.day;

   //--- If the previous day is the same as the current day, we're still on the same day
   if (prevDay == currDay) {
      newDay = false;
   }
   //--- If the current day differs from the previous one, we have a new day
   else if (prevDay != currDay) {
      //--- Print a message indicating the new day
      Print("WE HAVE A NEW DAY WITH DATE ", currDay);

      //--- Update the previous day to the current day
      prevDay = currDay;

      //--- Set the flag to true, indicating a new day has started
      newDay = true;
   }

   //--- Return whether a new day has started
   return (newDay);
}
//+------------------------------------------------------------------+
//|       FUNCTION TO CREATE AN ARROW                                |
//+------------------------------------------------------------------+
void drawBreakPoint(string objName, datetime time, double price, int arrCode, color clr, int direction) {
   //--- Check if the arrow object already exists on the chart
   if (ObjectFind(0, objName) < 0) {
      //--- Create an arrow object with the specified time, price, and arrow code
      ObjectCreate(0, objName, OBJ_ARROW, 0, time, price);

      //--- Set the arrow's code (symbol)
      ObjectSetInteger(0, objName, OBJPROP_ARROWCODE, arrCode);

      //--- Set the color for the arrow
      ObjectSetInteger(0, objName, OBJPROP_COLOR, clr);

      //--- Set the font size for the arrow
      ObjectSetInteger(0, objName, OBJPROP_FONTSIZE, 12);

      //--- Set the anchor position for the arrow based on the direction
      if (direction > 0) ObjectSetInteger(0, objName, OBJPROP_ANCHOR, ANCHOR_TOP);
      if (direction < 0) ObjectSetInteger(0, objName, OBJPROP_ANCHOR, ANCHOR_BOTTOM);

      //--- Define a text label for the break point
      string txt = " Break";
      string objNameDescr = objName + txt;

      //--- Create a text object for the break point description
      ObjectCreate(0, objNameDescr, OBJ_TEXT, 0, time, price);

      //--- Set the color for the text description
      ObjectSetInteger(0, objNameDescr, OBJPROP_COLOR, clr);

      //--- Set the font size for the text
      ObjectSetInteger(0, objNameDescr, OBJPROP_FONTSIZE, 12);

      //--- Adjust the text anchor based on the direction of the arrow
      if (direction > 0) {
         ObjectSetInteger(0, objNameDescr, OBJPROP_ANCHOR, ANCHOR_LEFT_UPPER);
         ObjectSetString(0, objNameDescr, OBJPROP_TEXT, " " + txt);
      }
      if (direction < 0) {
         ObjectSetInteger(0, objNameDescr, OBJPROP_ANCHOR, ANCHOR_LEFT_LOWER);
         ObjectSetString(0, objNameDescr, OBJPROP_TEXT, " " + txt);
      }
   }
   //--- Redraw the chart to reflect the new objects
   ChartRedraw(0);
}
バックテスト結果
バックテストのグラフ
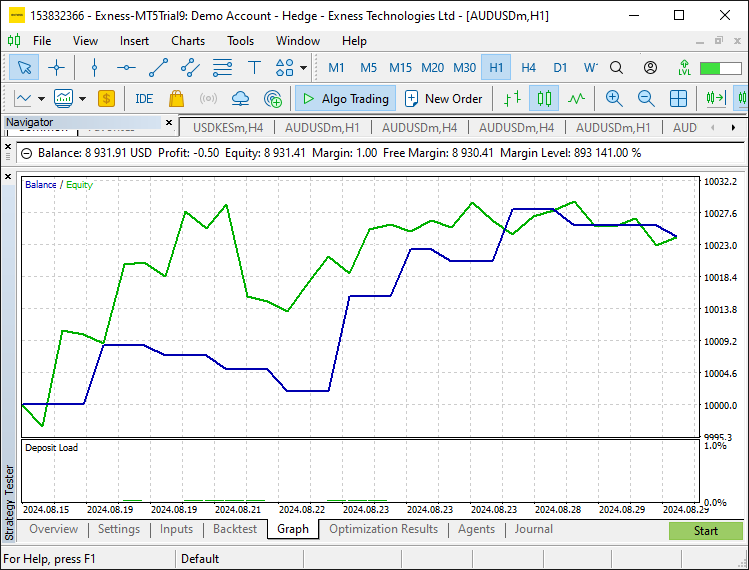
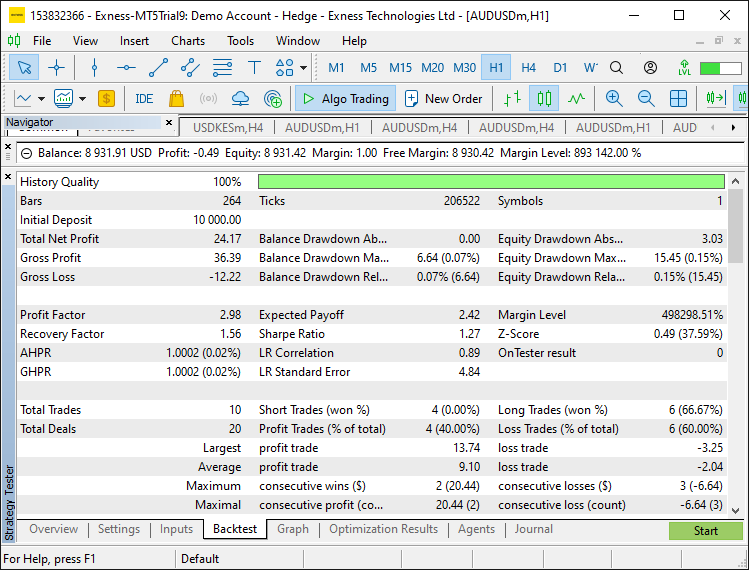
このテスト段階で、入力パラメータを最適化し、ストラテジーテスターで戦略のパフォーマンスを検証しました。入力パラメータを調整することで、取引戦略の柔軟性が向上しました。バックテストと最適化をおこなった結果、この戦略が意図したとおりに機能し、良好な結果が得られることが確認されました。
結論
要約すると、この記事では、日次レンジブレイクアウトをトレードするEAをMQL5で作成するための、段階的かつ詳細なアプローチを説明しました。最初に、EAに毎日の価格レンジを計算し、ブレイクアウトレベルを設定するための基本的な機能を組み込みました。これらの機能は、価格がその日のレンジを突破すると予測される直前および直後のタイミングを判断する上で重要な役割を果たします。
さらに、市場状況を監視し、必要な価格比較をおこない、ブレイクアウトが発生した瞬間に取引を実行するためのアクションを実施するために、さまざまなMQL5関数をどのように実装するかを検討しました。また、この戦略に必要な主要なレベルをトレーダーが迅速に確認できるよう、チャートに視覚的なツール(矩形やトレンドライン)を追加しました。この戦略では入力パラメータを柔軟に調整できることが求められるため、ツールをプログラムする際には柔軟性を持たせるよう注意を払いました。
この戦略はMetaTrader 5のストラテジーテスターを使用してテストを実施しました。このテストにより、戦略のパフォーマンスを評価し、取引条件に応じてさらに最適化することができました。コーディングの成功と取引の成果をお祈りします。
MetaQuotes Ltdにより英語から翻訳されました。
元の記事: https://www.mql5.com/en/articles/16135
警告: これらの資料についてのすべての権利はMetaQuotes Ltd.が保有しています。これらの資料の全部または一部の複製や再プリントは禁じられています。
この記事はサイトのユーザーによって執筆されたものであり、著者の個人的な見解を反映しています。MetaQuotes Ltdは、提示された情報の正確性や、記載されているソリューション、戦略、または推奨事項の使用によって生じたいかなる結果についても責任を負いません。
 MQL5とPythonで自己最適化エキスパートアドバイザーを構築する(第6回): Deep Double Descentの活用
 知っておくべきMQL5ウィザードのテクニック(第43回):SARSAによる強化学習
 プライスアクション分析ツールキットの開発(第1回):チャートプロジェクター
 ニュース取引が簡単に(第4回):パフォーマンス向上
- 無料取引アプリ
- 8千を超えるシグナルをコピー
- 金融ニュースで金融マーケットを探索
よく知られている「モーニング・フラット・ブレイクアウト」のようであり、「デイリーレンジ・ブレイクアウト」(これは違う)ではないので、タイトルは誤解を招きやすい。
サーバーのGMTオフセットによって、ブレイクアウトのレンジを定義する「モーニング・フラット」は、必ずしも真夜中の00:00からではなく、オフセットで始まるはずだからです。
よく知られた「モーニング・フラット・ブレイクアウト」のように見えるが、「デイリーレンジ・ブレイクアウト」(これは違う)ではないので、タイトルは誤解を招く。
サーバーのGMTオフセットによって、ブレイクアウトのレンジを定義する「モーニング・フラット」は、必ずしも真夜中の00:00からではなく、オフセットで始まるはずだからです。
ご回答ありがとうございます。それは使用するストラテジーによります。当社の場合、デイリーレンジ・ブレイクアウトで、基本的に午前0時から午前6時まで稼働しています。ありがとうございます。