
MQL5での取引戦略の自動化(第15回):プライスアクションハーモニックCypherパターンの可視化
はじめに
前回の記事(第14回)では、MACD(Moving Average Convergence Divergence、移動平均収束拡散法)とRSI(Relative Strength Index、相対力指数)を用いた統計的手法により、トレンド市場で動的にポジションをスケーリングするトレードレイヤリング戦略を開発しました。今回の第15回では、フィボナッチに基づく反転パターンであるCypherハーモニックパターンの自動化に焦点を当てます。MetaQuotes Language 5 (MQL5)で、このパターンを検出、可視化、取引するエキスパートアドバイザー(EA)を実装します。次のトピックについて説明します。
この記事を読み終える頃には、Cypherパターンを識別し、チャートに明確な視覚的注釈を加え、正確に取引を実行する完全な機能を備えたプログラムを完成させることができるでしょう。それでは、さっそく始めましょう。
Cypherパターンアーキテクチャの理解
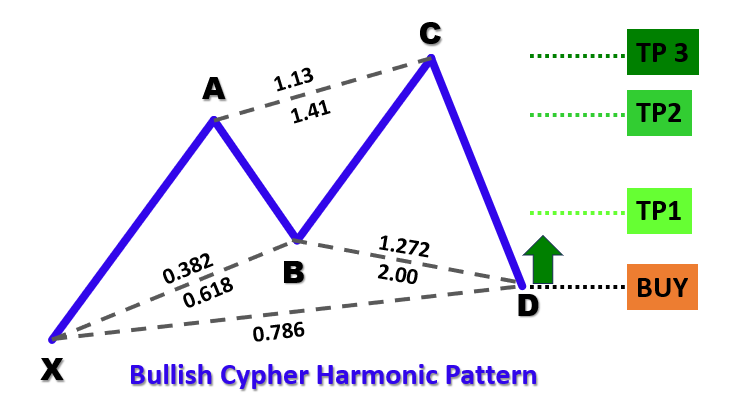
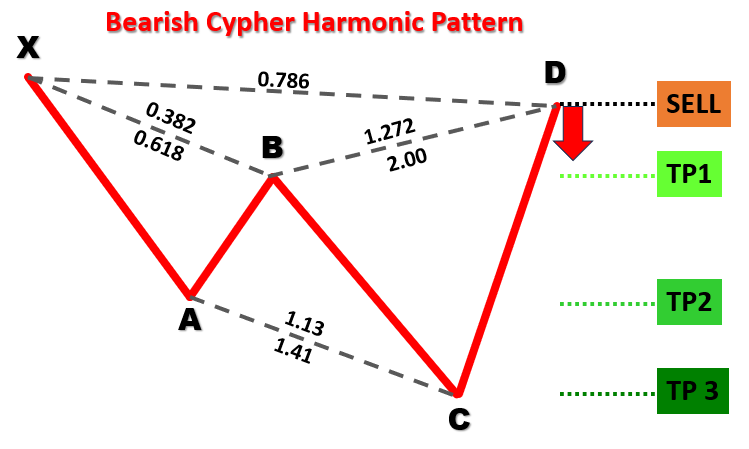
Cypherパターンは、X、A、B、C、Dの5つの主要なスイングポイントによって定義されるハーモニックトレーディングのフォーメーションであり、「強気パターン」と「弱気パターン」の2種類が存在します。強気のCypherパターンでは、安値・高値・安値・高値・安値という順序で構造が形成されます。Xはスイングロー(最初の安値)であり、Aはスイングハイ、Bは次のスイングロー、Cは再びスイングハイ、そしてDは最後のスイングローとなります。このとき、DはXよりも下に位置します。一方、弱気のCypherパターンでは、高値・安値・高値・安値・高値という順序で形成され、Xはスイングハイ(最初の高値)であり、DはXよりも上に位置します。以下に、それぞれのパターンタイプの可視例を示します。
強気のCypherハーモニックパターン
弱気のCypherハーモニックパターン
パターンを識別するために、以下のような構造化されたアプローチを採用します。
- XAレッグの定義:X点からA点への初動によって、パターンの基準距離が確立され、方向性が決まります(下降であれば弱気パターン、上昇であれば強気パターンとなります)。
- ABレッグの確定:どちらのパターンタイプにおいても、B点はXAの動きの38.2%〜61.8%の範囲でリトレース(戻り)する必要があり、初動に対する中程度の修正を示します。
- BCレッグの分析:このレッグはABレッグの127.2%〜141.4%の範囲まで拡張する必要があり、最終レッグの前に強い逆方向の動きが発生することを示します。
- CDレッグの設定:この最終レッグは、XCの動き(X点からC点まで)の約78.6%をリトレースする必要があり、そこが反転の可能性があるゾーン(PRZ: Potential Reversal Zone)となります。
これらの幾何学的かつフィボナッチに基づいた条件を適用することで、当取引システムは過去の価格データから有効なCypherパターンを体系的に検出します。パターンが確認されると、プログラムはチャート上に三角形やトレンドライン、X・A・B・C・D各ポイントのラベル、およびトレードレベルを注釈付きで視覚的に表示します。この構成によって、計算されたエントリーポイント、ストップロス、テイクプロフィット水準に基づく自動取引の実行が可能となり、パターンが持つ相場反転の予測力を活かした取引が実現されます。
MQL5での実装
MQL5でプログラムを作成するには、まずMetaEditorを開き、ナビゲータに移動して、Indicatorsフォルダを見つけ、[新規作成]タブをクリックして、表示される手順に従ってファイルを作成します。ファイルが作成されたら、コーディング環境で、まずプログラム全体で使用するグローバル変数をいくつか宣言する必要があります。
//+------------------------------------------------------------------+
//|                        Copyright 2025, Forex Algo-Trader, Allan. |
//|                                 "https://t.me/Forex_Algo_Trader" |
//+------------------------------------------------------------------+
#property copyright "Forex Algo-Trader, Allan"
#property link      "https://t.me/Forex_Algo_Trader"
#property version   "1.00"
#property description "This EA trades based on Cypher Strategy with visualization"
#property strict //--- Forces strict coding rules to catch errors early

//--- Include the Trade library from MQL5 to handle trading operations like buying and selling
#include <Trade\Trade.mqh>
//--- Create an instance (object) of the CTrade class to use for placing trades
CTrade obj_Trade;

//--- Input parameters let the user customize the EA without editing the code
input int    SwingHighCount    = 5;      // How many bars to check on the left to find a swing point (high or low)
input int    SwingLowCount     = 5;      // How many bars to check on the right to confirm a swing point
input double FibonacciTolerance = 0.10;  // Allowed error margin (10%) for Fibonacci ratios in the pattern
input double TradeVolume       = 0.01;   // Size of the trade (e.g., 0.01 lots is small for testing)
input bool   TradingEnabled    = true;   // True = EA can trade; False = only visualize patterns

//--- Define the Cypher pattern rules as a comment for reference
//--- Bullish Cypher: X (low), A (high), B (low), C (high), D (low)
//---   XA > 0; AB = 0.382-0.618 XA; BC = 1.272-1.414 AB; CD = 0.786 XC; D < X
//--- Bearish Cypher: X (high), A (low), B (high), C (low), D (high)
//---   XA > 0; AB = 0.382-0.618 XA; BC = 1.272-1.414 AB; CD = 0.786 XC; D > X

//--- Define a structure (like a custom data type) to store swing point info
struct SwingPoint {
   datetime TimeOfSwing;    //--- When the swing happened (date and time of the bar)
   double   PriceAtSwing;   //--- Price at the swing (high or low)
   bool     IsSwingHigh;    //--- True = swing high; False = swing low
};

//--- Create a dynamic array to hold all detected swing points
SwingPoint SwingPoints[];
ここでは、CypherパターンのトレーディングシステムをMetaQuotes Language 5 (MQL5)で実装するために、Trade.mqhライブラリをインクルードして、取引操作を可能にし、CTradeクラスのインスタンスobj_Tradeを作成して、実際の取引実行に使用します。
入力パラメータとしては、スイングポイント検出に使用するSwingHighCountおよびSwingLowCount(いずれも5)、フィボナッチ比率の許容範囲を設定するFibonacciTolerance (0.10)、取引ロットサイズを設定するTradeVolume(0.01ロット)、取引の有効/無効を切り替えるTradingEnabled (true)を定義しており、ユーザーによるカスタマイズが可能です。
SwingPoint構造体では、TimeOfSwing(日時)、PriceAtSwing(価格)、IsSwingHigh(高値スイングかどうかの真偽値)をメンバーとして定義し、すべての検出されたスイングポイントを格納する動的配列SwingPointsによってパターン解析をおこないます。
次に、チャート上にパターンを視覚的に描画するための関数群を定義していきます。
//+------------------------------------------------------------------+
//| Helper: Draw a filled triangle                                   |
//+------------------------------------------------------------------+
//--- Function to draw a triangle on the chart to highlight pattern segments
void DrawTriangle(string TriangleName, datetime Time1, double Price1, datetime Time2, double Price2, datetime Time3, double Price3, color LineColor, int LineWidth, bool FillTriangle, bool DrawBehind) {
   //--- Create a triangle object using three points (time, price) on the chart
   if(ObjectCreate(0, TriangleName, OBJ_TRIANGLE, 0, Time1, Price1, Time2, Price2, Time3, Price3)) {
      ObjectSetInteger(0, TriangleName, OBJPROP_COLOR, LineColor);      //--- Set the triangle’s color (e.g., blue or red)
      ObjectSetInteger(0, TriangleName, OBJPROP_STYLE, STYLE_SOLID);    //--- Use a solid line style
      ObjectSetInteger(0, TriangleName, OBJPROP_WIDTH, LineWidth);      //--- Set the line thickness
      ObjectSetInteger(0, TriangleName, OBJPROP_FILL, FillTriangle);    //--- Fill the triangle with color if true
      ObjectSetInteger(0, TriangleName, OBJPROP_BACK, DrawBehind);      //--- Draw behind candles if true
   }
}
ここでは、DrawTriangle関数を実装し、Cypherパターンの可視化を強化します。この関数は、MetaTrader 5のチャート上に塗りつぶされた三角形を描画し、パターン内の特定のセグメントを強調することで、トレーダーの理解を深めます。関数は、三角形の外観と位置を定義するために複数のパラメータを受け取ります。TriangleName(文字列)はオブジェクトの一意識別子を指定し、Time1、Time2、Time3(datetime)は三角形の3つの頂点の時間座標を、Price1、Price2、Price3(double)はそれぞれの価格座標を設定します。
さらに、LineColor (color)は三角形の枠線の色を指定します(たとえば、強気パターンには青、弱気には赤など)、LineWidth (int)は線の太さを設定し、FillTriangle (bool)は三角形を塗りつぶすかどうか、DrawBehind (bool)はチャートのローソク足の背後に描画するかどうかを制御します。これは価格データの視認性を保つためです。
関数内部では、ObjectCreate関数を使用してチャート上に三角形オブジェクトを作成します。オブジェクトの種類はOBJ_TRIANGLEとし、3点の時間・価格座標を指定します。オブジェクトの作成に成功した場合にのみ、その後のプロパティ設定をおこないます。
作成が成功したら、ObjectSetInteger関数を複数回呼び出して、三角形の属性を設定します。OBJPROP_COLORにはLineColorの値を、OBJPROP_STYLEはSTYLE_SOLIDに設定し、OBJPROP_WIDTHにはLineWidthの値を適用、OBJPROP_FILLにはFillTriangleの真偽値を使って塗りつぶしの有無を、OBJPROP_BACKにはDrawBehindの真偽値を使って、ローソク足の背後に描画されるかどうかを設定します。
残りのヘルパー関数も同じロジックで定義できるようになります。
//+------------------------------------------------------------------+
//| Helper: Draw a trend line                                        |
//+------------------------------------------------------------------+
//--- Function to draw a straight line between two points on the chart
void DrawTrendLine(string LineName, datetime StartTime, double StartPrice, datetime EndTime, double EndPrice, color LineColor, int LineWidth, int LineStyle) {
   //--- Create a trend line object connecting two points (start time/price to end time/price)
   if(ObjectCreate(0, LineName, OBJ_TREND, 0, StartTime, StartPrice, EndTime, EndPrice)) {
      ObjectSetInteger(0, LineName, OBJPROP_COLOR, LineColor);      //--- Set the line color
      ObjectSetInteger(0, LineName, OBJPROP_STYLE, LineStyle);      //--- Set line style (e.g., solid or dashed)
      ObjectSetInteger(0, LineName, OBJPROP_WIDTH, LineWidth);      //--- Set line thickness
      ObjectSetInteger(0, LineName, OBJPROP_BACK, true);
   }
}

//+------------------------------------------------------------------+
//| Helper: Draw a dotted trend line                                 |
//+------------------------------------------------------------------+
//--- Function to draw a horizontal dotted line (e.g., for entry or take-profit levels)
void DrawDottedLine(string LineName, datetime StartTime, double LinePrice, datetime EndTime, color LineColor) {
   //--- Create a horizontal line from start time to end time at a fixed price
   if(ObjectCreate(0, LineName, OBJ_TREND, 0, StartTime, LinePrice, EndTime, LinePrice)) {
      ObjectSetInteger(0, LineName, OBJPROP_COLOR, LineColor);      //--- Set the line color
      ObjectSetInteger(0, LineName, OBJPROP_STYLE, STYLE_DOT);      //--- Use dotted style
      ObjectSetInteger(0, LineName, OBJPROP_WIDTH, 1);              //--- Thin line
   }
}

//+------------------------------------------------------------------+
//| Helper: Draw anchored text label (for pivots and levels)         |
//+------------------------------------------------------------------+
//--- Function to place text labels (e.g., "X" or "TP1") on the chart
void DrawTextLabel(string LabelName, string LabelText, datetime LabelTime, double LabelPrice, color TextColor, int FontSize, bool IsAbove) {
   //--- Create a text object at a specific time and price
   if(ObjectCreate(0, LabelName, OBJ_TEXT, 0, LabelTime, LabelPrice)) {
      ObjectSetString(0, LabelName, OBJPROP_TEXT, LabelText);          //--- Set the text to display
      ObjectSetInteger(0, LabelName, OBJPROP_COLOR, TextColor);        //--- Set text color
      ObjectSetInteger(0, LabelName, OBJPROP_FONTSIZE, FontSize);      //--- Set text size
      ObjectSetString(0, LabelName, OBJPROP_FONT, "Arial Bold");       //--- Use bold Arial font
      //--- Position text below if it’s a high point, above if it’s a low point
      ObjectSetInteger(0, LabelName, OBJPROP_ANCHOR, IsAbove ? ANCHOR_BOTTOM : ANCHOR_TOP);
      ObjectSetInteger(0, LabelName, OBJPROP_ALIGN, ALIGN_CENTER);     //--- Center the text
   }
}
ここでは、DrawTrendLine関数を実装し、Cypherパターンのスイングポイントを結ぶ直線をチャート上に描画します。この関数は、LineName (string)、StartTime・EndTime (datetime)、StartPrice・EndPrice (double)、LineColor (color)、LineWidth (int)、LineStyle (int)といったパラメータを受け取ります。関数内では、ObjectCreate関数を使用してOBJ_TRENDタイプのラインオブジェクトを作成し、作成に成功した場合には、ObjectSetIntegerを使ってOBJPROP_COLOR、OBJPROP_STYLE、OBJPROP_WIDTH、およびローソク足の背後に表示するためのOBJPROP_BACK (true)を設定します。
DrawDottedLine関数では、トレードレベルなどを示すための水平点線ラインを描画します。受け取るパラメータは、LineName (string)、StartTime・EndTime (datetime)、LinePrice (double)、LineColor (color)です。固定価格でOBJ_TRENDオブジェクトをObjectCreate関数で作成し、ObjectSetInteger関数でOBJPROP_COLOR、OBJPROP_STYLE (STYLE_DOT)、OBJPROP_WIDTH (1)を設定することで、目立ちすぎないマーカーとして機能させます。
DrawTextLabel関数は、スイングポイントやトレードレベルに注釈を追加するためのテキストラベルを描画します。パラメータには、LabelName・LabelText (string)、LabelTime (datetime)、LabelPrice (double)、TextColor (color)、FontSize (int)、IsAbove (bool)を受け取ります。OBJ_TEXTオブジェクトをObjectCreate関数で作成し、ObjectSetString関数を使用してOBJPROP_TEXTとOBJPROP_FONT (Arial Bold)を設定します。また、ObjectSetIntegerを用いてOBJPROP_COLOR、OBJPROP_FONTSIZE、OBJPROP_ANCHOR(ANCHOR_BOTTOMまたはANCHOR_TOP)、OBJPROP_ALIGN (ALIGN_CENTER)などを指定し、明確で読みやすい注釈を表示します。
これらの変数と関数を備えたことで、次はOnTickイベントハンドラに進み、パターン認識の処理を開始できます。ただし、すべてのティックごとに処理をおこなう必要はないため、1本のバーにつき1回だけパターン識別処理をおこなうロジックを定義していく必要があります。
//+------------------------------------------------------------------+
//| Expert tick function                                             |
//+------------------------------------------------------------------+
//--- Main function that runs every time a new price tick arrives
void OnTick() {
   //--- Use a static variable to track the last bar’s time so we only process new bars
   static datetime LastProcessedBarTime = 0;
   //--- Get the time of the second-to-last bar (latest complete bar)
   datetime CurrentBarTime = iTime(_Symbol, _Period, 1);
   //--- If no new bar has formed, exit to avoid over-processing
   if(CurrentBarTime == LastProcessedBarTime)
      return;
   LastProcessedBarTime = CurrentBarTime;  //--- Update to the current bar
}
OnTickイベントハンドラは、MetaTrader 5プラットフォームで新しい価格ティックが発生するたびに実行されるメインのイベントハンドラーです。この関数内で、前回処理したバーのタイムスタンプを追跡するために、静的変数「LastProcessedBarTime」を宣言します。これにより、新しいバーが形成されたときのみ処理を実行し、パフォーマンスを最適化できます。
iTime関数を使って、直近の確定済みバー(最新の1つ前のバー)の時刻を取得し、それをCurrentBarTimeに格納します。そして、CurrentBarTimeとLastProcessedBarTimeを比較し、新しいバーが形成されたかどうかを確認します。もし両者が同じ場合は、新しいバーがまだ形成されていないと判断し、return文で関数を終了し、無駄な処理を回避します。
新しいバーが検出された場合、LastProcessedBarTimeをCurrentBarTimeに更新し、価格データの分析およびCypherパターンの検出に関する後続の処理を続ける準備が整います。次に、スイングポイントのレベルを定義するための変数を用意していきます。
//--- Clear the SwingPoints array to start fresh each time
ArrayResize(SwingPoints, 0);
//--- Get the total number of bars on the chart
int TotalBars = Bars(_Symbol, _Period);
int StartBarIndex = SwingHighCount;         //--- Start checking swings after SwingHighCount bars
int EndBarIndex = TotalBars - SwingLowCount; //--- Stop before the last SwingLowCount bars
ArrayResize関数を使用して、SwingPoints配列のサイズを0に設定し、配列をクリアします。これにより、新しいバーごとにスイングポイントを新たに格納するためのクリーンな状態が確保されます。次に、Bars関数を使ってチャート上のバーの総数を取得し、その結果をTotalBarsに格納します。これによって、過去データの分析範囲が定義されます。
スイング検出の対象を関連するバーのみに絞るため、StartBarIndexをSwingHighCountの値に設定します。これはスイングポイントの検出を開始する最も早いバーを示します。そして、EndBarIndexをTotalBarsからSwingLowCountを引いた値として計算し、直近の数バーは確認用データとして残すことで、スイングポイントの信頼性を確保します。
これらの準備が整うと、ループ処理を使ってスイングポイントのデータを収集することができます。
//--- Loop through bars to find swing highs and lows (swing points)
for(int BarIndex = EndBarIndex - 1; BarIndex >= StartBarIndex; BarIndex--) {
   bool IsSwingHigh = true;   //--- Assume it’s a high until proven otherwise
   bool IsSwingLow = true;    //--- Assume it’s a low until proven otherwise
   double CurrentBarHigh = iHigh(_Symbol, _Period, BarIndex); //--- Get the high of this bar
   double CurrentBarLow = iLow(_Symbol, _Period, BarIndex);   //--- Get the low of this bar
   //--- Check bars to the left and right to confirm it’s a swing point
   for(int NeighborIndex = BarIndex - SwingHighCount; NeighborIndex <= BarIndex + SwingLowCount; NeighborIndex++) {
      if(NeighborIndex < 0 || NeighborIndex >= TotalBars || NeighborIndex == BarIndex) //--- Skip invalid bars or current bar
         continue;
      if(iHigh(_Symbol, _Period, NeighborIndex) > CurrentBarHigh) //--- If any bar is higher, not a high
         IsSwingHigh = false;
      if(iLow(_Symbol, _Period, NeighborIndex) < CurrentBarLow)   //--- If any bar is lower, not a low
         IsSwingLow = false;
   }
   //--- If it’s a high or low, store it in the SwingPoints array
   if(IsSwingHigh || IsSwingLow) {
      SwingPoint NewSwing;
      NewSwing.TimeOfSwing = iTime(_Symbol, _Period, BarIndex); //--- Store the bar’s time
      NewSwing.PriceAtSwing = IsSwingHigh ? CurrentBarHigh : CurrentBarLow; //--- Store high or low price
      NewSwing.IsSwingHigh = IsSwingHigh;              //--- Mark as high or low
      int CurrentArraySize = ArraySize(SwingPoints);   //--- Get current array size
      ArrayResize(SwingPoints, CurrentArraySize + 1);  //--- Add one more slot
      SwingPoints[CurrentArraySize] = NewSwing;        //--- Add the swing to the array
   }
}
ここでは、Cypherパターンにおけるスイングハイおよびスイングローを検出するロジックを実装します。forループを使用して、BarIndexを現在のバーとして追跡しながら、「EndBarIndex - 1」からStartBarIndexまで逆順にバーを反復処理します。各バーについては、まずIsSwingHighおよびIsSwingLowをtrueに初期化し、そのバーがスイングポイントであると仮定して処理を開始します。バーの高値と安値はiHighおよびiLow関数を使用して取得し、それぞれCurrentBarHighおよびCurrentBarLowに格納します。次に、入れ子のforループで、「BarIndex - SwingHighCount」から「BarIndex + SwingLowCount」の範囲にある近隣バーをチェックします。NeighborIndexにより隣接バーを参照し、無効なインデックス(データ外)や現在のバー自身を処理しないようにcontinue文でスキップします。
もし近隣バーの高値がCurrentBarHighを上回っていた場合、または安値がCurrentBarLowを下回っていた場合(iHighおよびiLowによる)は、それぞれIsSwingHighやIsSwingLowをfalseに設定します。いずれかがtrueのままであれば、そのバーはスイングポイントとみなされます。このとき、新たなSwingPointインスタンスNewSwingを作成し、iTimeで取得したバーの時刻をTimeOfSwingに、スイングの種類に応じて高値または安値をPriceAtSwingに、またIsSwingHighの真偽をそのまま代入します。
その後、ArraySize関数を使用してSwingPoints配列の現在のサイズを取得し、ArrayResizeによって1つ分拡張します。そして、拡張されたインデックス位置にNewSwingを格納することで、スイングポイントのコレクションを構築していきます。最後に、ArrayPrint(SwingPoints)関数でデータを出力することで、検出されたスイングポイントの内容を確認できます。
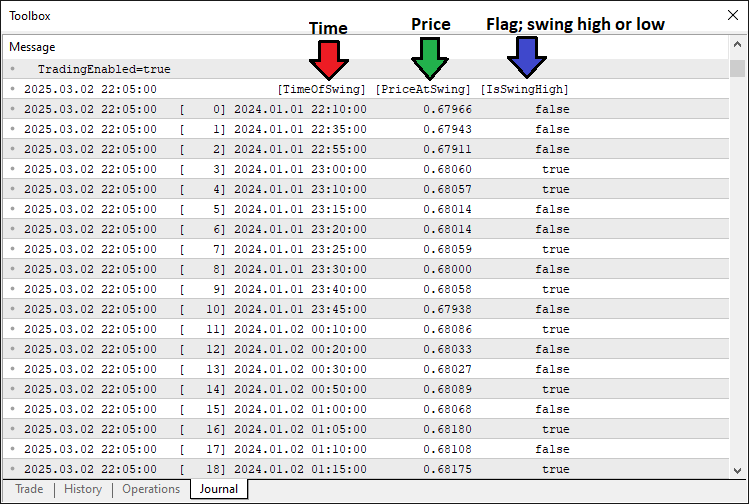
取得したデータをもとにピボットポイントを抽出し、十分な数のピボットが揃えば、パターンの解析と検出をおこなうことができます。これを実現するために、以下のロジックを実装しています。
//--- Check if we have enough swing points (need 5 for Cypher: X, A, B, C, D)
int TotalSwingPoints = ArraySize(SwingPoints);
if(TotalSwingPoints < 5)
   return;  //--- Exit if not enough swing points

//--- Assign the last 5 swing points to X, A, B, C, D (most recent is D)
SwingPoint PointX = SwingPoints[TotalSwingPoints - 5];
SwingPoint PointA = SwingPoints[TotalSwingPoints - 4];
SwingPoint PointB = SwingPoints[TotalSwingPoints - 3];
SwingPoint PointC = SwingPoints[TotalSwingPoints - 2];
SwingPoint PointD = SwingPoints[TotalSwingPoints - 1];

//--- Variables to track if we found a pattern and its type
bool PatternFound = false;
string PatternDirection = "";

//--- Check for Bearish Cypher pattern
if(PointX.IsSwingHigh && !PointA.IsSwingHigh && PointB.IsSwingHigh && !PointC.IsSwingHigh && PointD.IsSwingHigh) {
   double LegXA = PointX.PriceAtSwing - PointA.PriceAtSwing;  //--- Calculate XA leg (should be positive)
   if(LegXA > 0) {
      double LegAB = PointB.PriceAtSwing - PointA.PriceAtSwing; //--- AB leg
      double LegBC = PointB.PriceAtSwing - PointC.PriceAtSwing; //--- BC leg
      double LegXC = PointX.PriceAtSwing - PointC.PriceAtSwing; //--- XC leg
      double LegCD = PointD.PriceAtSwing - PointC.PriceAtSwing; //--- CD leg
      //--- Check Fibonacci rules and D > X for bearish
      if(LegAB >= 0.382 * LegXA && LegAB <= 0.618 * LegXA &&
         LegBC >= 1.272 * LegAB && LegBC <= 1.414 * LegAB &&
         MathAbs(LegCD - 0.786 * LegXC) <= FibonacciTolerance * LegXC && PointD.PriceAtSwing > PointX.PriceAtSwing) {
         PatternFound = true;
         PatternDirection = "Bearish";
      }
   }
}
//--- Check for Bullish Cypher pattern
else if(!PointX.IsSwingHigh && PointA.IsSwingHigh && !PointB.IsSwingHigh && PointC.IsSwingHigh && !PointD.IsSwingHigh) {
   double LegXA = PointA.PriceAtSwing - PointX.PriceAtSwing;  //--- Calculate XA leg (should be positive)
   if(LegXA > 0) {
      double LegAB = PointA.PriceAtSwing - PointB.PriceAtSwing; //--- AB leg
      double LegBC = PointC.PriceAtSwing - PointB.PriceAtSwing; //--- BC leg
      double LegXC = PointC.PriceAtSwing - PointX.PriceAtSwing; //--- XC leg
      double LegCD = PointC.PriceAtSwing - PointD.PriceAtSwing; //--- CD leg
      //--- Check Fibonacci rules and D < X for bullish
      if(LegAB >= 0.382 * LegXA && LegAB <= 0.618 * LegXA &&
         LegBC >= 1.272 * LegAB && LegBC <= 1.414 * LegAB &&
         MathAbs(LegCD - 0.786 * LegXC) <= FibonacciTolerance * LegXC && PointD.PriceAtSwing < PointX.PriceAtSwing) {
         PatternFound = true;
         PatternDirection = "Bullish";
      }
   }
}
ここでは、十分なスイングポイントを確認し、最後の5つのパターン形成を分析することで、Cypherパターンの検証を継続します。ArraySize関数を使ってSwingPoints配列の要素数を取得し、それをTotalSwingPointsに格納します。Cypherパターンには5つのポイント(X、A、B、C、D)が必要なため、TotalSwingPointsが5未満であればreturn文で処理を終了します。十分なポイントが存在する場合は、配列の末尾から5つのスイングポイントを取り出して、それぞれPointX、PointA、PointB、PointC、PointDに割り当てます。インデックスは「TotalSwingPoints - 5」から「TotalSwingPoints - 1」までで、PointDが最新のポイントになります。
次に、有効なパターンが検出されたかどうかを追跡するためにPatternFoundをfalseで初期化し、パターンの種類を格納するためにPatternDirectionを空文字列で初期化します。弱気のCypherパターンを確認するには、PointX.IsSwingHighがtrue、PointA.IsSwingHighがfalse、PointB.IsSwingHighがtrue、PointC.IsSwingHighがfalse、PointD.IsSwingHighがtrueであることを検証します。これにより、「高・低・高・低・高」という順序が成立していることを確認します。
この条件が満たされている場合、各レッグの長さを以下のように計算します。LegXAはPointX.PriceAtSwingからPointA.PriceAtSwingを引いた値(弱気では正の値)、LegABはPointB.PriceAtSwingからPointA.PriceAtSwingを引いた値、LegBCはPointB.PriceAtSwingからPointC.PriceAtSwingを引いた値、LegXCはPointX.PriceAtSwingからPointC.PriceAtSwingを引いた値、LegCDはPointD.PriceAtSwingからPointC.PriceAtSwingを引いた値です。
フィボナッチ比率の検証では、まず、LegABがLegXAの38.2%から61.8%の範囲内であること、LegBCがLegABの127.2%から141.4%の範囲内であること、LegCDがLegXCの78.6%に対してFibonacciToleranceの範囲内に収まっていること(この検証にはMathAbs関数を使用)、そしてPointD.PriceAtSwingがPointX.PriceAtSwingを上回っていることを確認します。これらすべての条件が満たされた場合、PatternFoundをtrueに、PatternDirectionを「弱気」に設定します。
強気のCypherパターンを確認する場合は、逆のスイングの順序を検証します。PointX.IsSwingHighがfalse、PointA.IsSwingHighがtrue、PointB.IsSwingHighがfalse、PointC.IsSwingHighがtrue、そしてPointD.IsSwingHighがfalseである必要があります。これは「低・高・低・高・低」の順序に対応します。
そのうえで、LegXAはPointA.PriceAtSwingからPointX.PriceAtSwingを引いた値(強気では正の値)、LegABはPointA.PriceAtSwingからPointB.PriceAtSwingを引いた値、LegBCはPointC.PriceAtSwingからPointB.PriceAtSwingを引いた値、LegXCはPointC.PriceAtSwingからPointX.PriceAtSwingを引いた値、LegCDはPointC.PriceAtSwingからPointD.PriceAtSwingを引いた値としてそれぞれ計算します。
フィボナッチ比率のチェックは弱気の場合と同様に適用され、さらにPointD.PriceAtSwingがPointX.PriceAtSwingを下回っていることを確認します。これらの条件がすべて満たされた場合、PatternFoundをtrueに、PatternDirectionを「強気」に設定し、続く可視化や取引のロジックに進むことが可能となります。 パターンが検出された場合、チャート上にそのパターンを可視化する処理を進めることができます。
//--- If a pattern is found, visualize it and trade
if(PatternFound) {
   //--- Log the pattern detection in the Experts tab
   Print(PatternDirection, " Cypher pattern detected at ", TimeToString(PointD.TimeOfSwing, TIME_DATE|TIME_MINUTES));

   //--- Create a unique prefix for all chart objects using D’s time
   string ObjectPrefix = "CY_" + IntegerToString(PointD.TimeOfSwing);
   //--- Set triangle color: blue for bullish, red for bearish
   color TriangleColor = (PatternDirection == "Bullish") ? clrBlue : clrRed;

   //--- **Visualization Steps**
   //--- 1. Draw two filled triangles to highlight the pattern
   DrawTriangle(ObjectPrefix + "_Triangle1", PointX.TimeOfSwing, PointX.PriceAtSwing, PointA.TimeOfSwing, PointA.PriceAtSwing, PointB.TimeOfSwing, PointB.PriceAtSwing, TriangleColor, 2, true, true);
   DrawTriangle(ObjectPrefix + "_Triangle2", PointB.TimeOfSwing, PointB.PriceAtSwing, PointC.TimeOfSwing, PointC.PriceAtSwing, PointD.TimeOfSwing, PointD.PriceAtSwing, TriangleColor, 2, true, true);
}
PatternFoundがtrueの場合、検出されたCypherパターンの可視化処理に進みます。まず、Print関数を使って、Expertsタブにパターン検出のログを出力します。この出力には、PatternDirectionの値と、「Cypherパターンが検出された」とのメッセージが含まれ、さらにPointD.TimeOfSwingをTimeToString関数で日付と時刻(TIME_DATE | TIME_MINUTES)形式に変換して、視認性を高めた形で表示します。
チャートオブジェクトを整理するため、ObjectPrefixという一意の接頭辞を生成します。これは、「CY_」という文字列と、IntegerToString関数で文字列に変換したPointD.TimeOfSwingを連結して構成されます。これにより、各パターンに関連するオブジェクトが一意に識別できるようになります。続いて、PatternDirectionの値に基づいて、三角形の色を決定します。これは三項演算子(条件演算子)を使用し、「強気」の場合はclrBlue、「弱気」の場合はclrRedをTriangleColorとして設定します。
パターンの構造をチャート上で可視化するために、DrawTriangle関数を2回呼び出します。最初の呼び出しでは、「ObjectPrefix + '_Triangle1'」という名前の三角形を描画し、PointX、PointA、PointBのTimeOfSwingおよびPriceAtSwingの値を頂点とします。2回目の呼び出しでは、「ObjectPrefix + '_Triangle2'」という名前で、PointB、PointC、PointDを使ってもう一つの三角形を描きます。どちらもTriangleColorを使用し、線の太さは2、塗りつぶしとローソク足の背面への描画をtrueに設定して、パターン構造を強調表示します。これまでの処理で、チャート上にCypherパターンの構造を可視化する仕組みが完成しました。
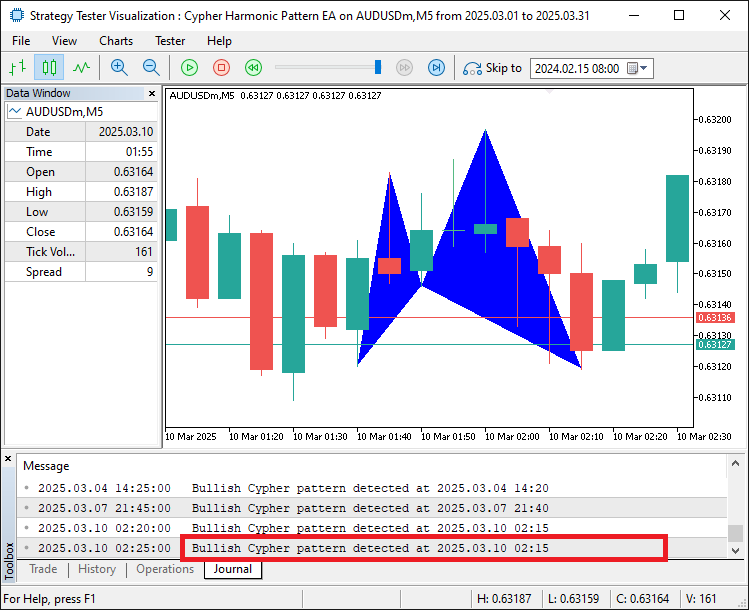
画像から、検出されたパターンを正しくマッピングおよび可視化できていることが確認できます。ここからは、パターンをより明確に視認できるように、パターンの構造を明確に示すためのトレンドラインの描画を続けていく必要があります。また、各レベルを識別しやすくするために、ラベルの追加もおこないます。
//--- 2. Draw six trend lines connecting the swing points
DrawTrendLine(ObjectPrefix + "_Line_XA", PointX.TimeOfSwing, PointX.PriceAtSwing, PointA.TimeOfSwing, PointA.PriceAtSwing, clrBlack, 2, STYLE_SOLID);
DrawTrendLine(ObjectPrefix + "_Line_AB", PointA.TimeOfSwing, PointA.PriceAtSwing, PointB.TimeOfSwing, PointB.PriceAtSwing, clrBlack, 2, STYLE_SOLID);
DrawTrendLine(ObjectPrefix + "_Line_BC", PointB.TimeOfSwing, PointB.PriceAtSwing, PointC.TimeOfSwing, PointC.PriceAtSwing, clrBlack, 2, STYLE_SOLID);
DrawTrendLine(ObjectPrefix + "_Line_CD", PointC.TimeOfSwing, PointC.PriceAtSwing, PointD.TimeOfSwing, PointD.PriceAtSwing, clrBlack, 2, STYLE_SOLID);
DrawTrendLine(ObjectPrefix + "_Line_XB", PointX.TimeOfSwing, PointX.PriceAtSwing, PointB.TimeOfSwing, PointB.PriceAtSwing, clrBlack, 2, STYLE_SOLID);
DrawTrendLine(ObjectPrefix + "_Line_BD", PointB.TimeOfSwing, PointB.PriceAtSwing, PointD.TimeOfSwing, PointD.PriceAtSwing, clrBlack, 2, STYLE_SOLID);

//--- 3. Draw labels for each swing point (X, A, B, C, D)
double LabelOffset = 15 * SymbolInfoDouble(_Symbol, SYMBOL_POINT); //--- Offset in points for label placement
DrawTextLabel(ObjectPrefix + "_Label_X", "X", PointX.TimeOfSwing, PointX.PriceAtSwing + (PointX.IsSwingHigh ? LabelOffset : -LabelOffset), clrBlack, 11, PointX.IsSwingHigh);
DrawTextLabel(ObjectPrefix + "_Label_A", "A", PointA.TimeOfSwing, PointA.PriceAtSwing + (PointA.IsSwingHigh ? LabelOffset : -LabelOffset), clrBlack, 11, PointA.IsSwingHigh);
DrawTextLabel(ObjectPrefix + "_Label_B", "B", PointB.TimeOfSwing, PointB.PriceAtSwing + (PointB.IsSwingHigh ? LabelOffset : -LabelOffset), clrBlack, 11, PointB.IsSwingHigh);
DrawTextLabel(ObjectPrefix + "_Label_C", "C", PointC.TimeOfSwing, PointC.PriceAtSwing + (PointC.IsSwingHigh ? LabelOffset : -LabelOffset), clrBlack, 11, PointC.IsSwingHigh);
DrawTextLabel(ObjectPrefix + "_Label_D", "D", PointD.TimeOfSwing, PointD.PriceAtSwing + (PointD.IsSwingHigh ? LabelOffset : -LabelOffset), clrBlack, 11, PointD.IsSwingHigh);

//--- 4. Draw a central label to identify the pattern
datetime CenterTime = (PointX.TimeOfSwing + PointB.TimeOfSwing) / 2;  //--- Middle time between X and B
double CenterPrice = PointD.PriceAtSwing;                            //--- Place it at D’s price level
if(ObjectCreate(0, ObjectPrefix + "_Label_Center", OBJ_TEXT, 0, CenterTime, CenterPrice)) {
   ObjectSetString(0, ObjectPrefix + "_Label_Center", OBJPROP_TEXT, "Cypher"); //--- Label as "Cypher"
   ObjectSetInteger(0, ObjectPrefix + "_Label_Center", OBJPROP_COLOR, clrBlack);
   ObjectSetInteger(0, ObjectPrefix + "_Label_Center", OBJPROP_FONTSIZE, 11);
   ObjectSetString(0, ObjectPrefix + "_Label_Center", OBJPROP_FONT, "Arial Bold");
   ObjectSetInteger(0, ObjectPrefix + "_Label_Center", OBJPROP_ALIGN, ALIGN_CENTER);
}
チャート上にCypherパターンをさらに明確に表示するために、可視化の処理を継続します。まず、DrawTrendLine関数を6回呼び出し、スイングポイント間を接続する実線の黒いラインを描画します。各ラインには、ObjectPrefixにユニークなサフィックス(例:_Line_XA)を付けて命名します。これらのラインは、それぞれPointXからPointA、PointAからPointB、PointBからPointC、PointCからPointD、PointXからPointB、PointBからPointDを接続し、各ポイントのTimeOfSwingとPriceAtSwingを使って描画されます。ラインの太さは2、スタイルはSTYLE_SOLIDとして、パターンの構造が明確になるようにします。
次に、各スイングポイントにテキストラベルを追加します。ラベルの位置調整に使うLabelOffsetは、SymbolInfoDouble関数でSYMBOL_POINTを取得し、それに15を掛けて算出します。DrawTextLabel関数を5回呼び出し、それぞれのポイントPointX、PointA、PointB、PointC、PointDに対して、「ObjectPrefix + '_Label_X'」のような名前と、テキスト「X」、「A」、「B」、「C」、「D」を付与します。各ラベルは、それぞれのTimeOfSwingと、PriceAtSwingにLabelOffsetを加算または減算して配置します(IsSwingHighがtrueのときは加算、falseのときは減算)。ラベルの色はclrBlack、フォントサイズは11で、IsSwingHighの真偽値に応じて上または下に表示されます。
最後に、パターン全体を示す中央ラベルを作成します。CenterTimeはPointX.TimeOfSwingとPointB.TimeOfSwingの平均を使って計算し、CenterPriceにはPointD.PriceAtSwingを設定します。ObjectCreate関数で、「ObjectPrefix + '_Label_Center'」という名前のOBJ_TEXT型テキストオブジェクトをこれらの座標で作成します。作成に成功した場合は、ObjectSetStringでOBJPROP_TEXTにCypher、OBJPROP_FONTにArial Boldを設定し、ObjectSetIntegerでOBJPROP_COLORにclrBlack、OBJPROP_FONTSIZEに11、OBJPROP_ALIGNにALIGN_CENTERを設定して、チャート上でパターン名が明確に表示されるようにします。コンパイルすると、次の結果が得られます。
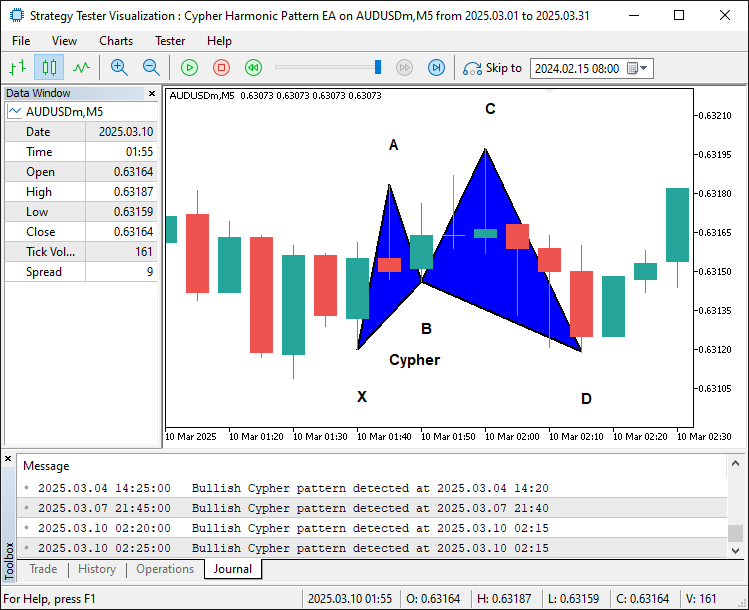
画像から、パターンにエッジ(トレンドライン)とラベルを追加したことで、より明確かつ視覚的に把握しやすくなったことが分かります。次におこなうべきことは、このパターンに基づいてトレードレベルを決定することです。
//--- 5. Draw trade levels (entry, take-profits) as dotted lines
datetime LineStartTime = PointD.TimeOfSwing;                    //--- Start at D’s time
datetime LineEndTime = PointD.TimeOfSwing + PeriodSeconds(_Period) * 2; //--- Extend 2 bars to the right
double EntryPrice, StopLossPrice, TakeProfitPrice, TakeProfit1Level, TakeProfit2Level, TakeProfit3Level, TradeDistance;
if(PatternDirection == "Bullish") {
   EntryPrice = SymbolInfoDouble(_Symbol, SYMBOL_ASK); //--- Buy at current ask price
   StopLossPrice = PointX.PriceAtSwing;                //--- Stop-loss at X (below entry for bullish)
   TakeProfitPrice = PointC.PriceAtSwing;              //--- Take-profit at C (target level)
   TakeProfit3Level = PointC.PriceAtSwing;             //--- Highest TP at C
   TradeDistance = TakeProfit3Level - EntryPrice;      //--- Distance to TP3
   TakeProfit1Level = EntryPrice + TradeDistance / 3;  //--- First TP at 1/3 of the distance
   TakeProfit2Level = EntryPrice + 2 * TradeDistance / 3; //--- Second TP at 2/3
} else {
   EntryPrice = SymbolInfoDouble(_Symbol, SYMBOL_BID); //--- Sell at current bid price
   StopLossPrice = PointX.PriceAtSwing;                //--- Stop-loss at X (above entry for bearish)
   TakeProfitPrice = PointC.PriceAtSwing;              //--- Take-profit at C
   TakeProfit3Level = PointC.PriceAtSwing;             //--- Lowest TP at C
   TradeDistance = EntryPrice - TakeProfit3Level;      //--- Distance to TP3
   TakeProfit1Level = EntryPrice - TradeDistance / 3;  //--- First TP at 1/3
   TakeProfit2Level = EntryPrice - 2 * TradeDistance / 3; //--- Second TP at 2/3
}

DrawDottedLine(ObjectPrefix + "_EntryLine", LineStartTime, EntryPrice, LineEndTime, clrMagenta); //--- Entry line
DrawDottedLine(ObjectPrefix + "_TP1Line", LineStartTime, TakeProfit1Level, LineEndTime, clrForestGreen); //--- TP1 line
DrawDottedLine(ObjectPrefix + "_TP2Line", LineStartTime, TakeProfit2Level, LineEndTime, clrGreen);      //--- TP2 line
DrawDottedLine(ObjectPrefix + "_TP3Line", LineStartTime, TakeProfit3Level, LineEndTime, clrDarkGreen);  //--- TP3 line

//--- 6. Draw labels for trade levels
datetime LabelTime = LineEndTime + PeriodSeconds(_Period) / 2; //--- Place labels further right
string EntryLabelText = (PatternDirection == "Bullish") ? "BUY (" : "SELL (";
EntryLabelText += DoubleToString(EntryPrice, _Digits) + ")"; //--- Add price to label
DrawTextLabel(ObjectPrefix + "_EntryLabel", EntryLabelText, LabelTime, EntryPrice, clrMagenta, 11, true);

string TP1LabelText = "TP1 (" + DoubleToString(TakeProfit1Level, _Digits) + ")";
DrawTextLabel(ObjectPrefix + "_TP1Label", TP1LabelText, LabelTime, TakeProfit1Level, clrForestGreen, 11, true);

string TP2LabelText = "TP2 (" + DoubleToString(TakeProfit2Level, _Digits) + ")";
DrawTextLabel(ObjectPrefix + "_TP2Label", TP2LabelText, LabelTime, TakeProfit2Level, clrGreen, 11, true);

string TP3LabelText = "TP3 (" + DoubleToString(TakeProfit3Level, _Digits) + ")";
DrawTextLabel(ObjectPrefix + "_TP3Label", TP3LabelText, LabelTime, TakeProfit3Level, clrDarkGreen, 11, true);
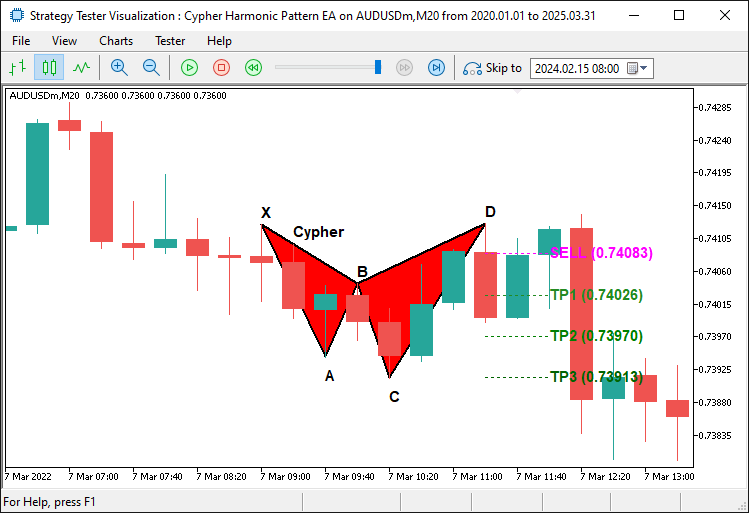
ここでは、Cypherパターンのトレードレベルを可視化するために、点線とラベルを描画し続けます。まず、水平線の時間範囲を定義するためにLineStartTimeをPointD.TimeOfSwingに設定し、PeriodSeconds関数に2を掛けた値を使って、そこから2本先のバーの時間をLineEndTimeとします。
強気のパターン(PatternDirectionがBullish)では、EntryPriceをSymbolInfoDouble関数を使ってSYMBOL_ASKに設定します。StopLossPriceにはPointX.PriceAtSwingを、TakeProfitPriceおよびTakeProfit3LevelにはPointC.PriceAtSwingを設定します。TradeDistanceはTakeProfit3LevelからEntryPriceを引いた値として計算され、TakeProfit1LevelとTakeProfit2Levelは、それぞれTradeDistanceの3分の1および3分の2をEntryPriceに加えた値として求められます。
一方、弱気のパターン(PatternDirectionがBearish)では、EntryPriceをSYMBOL_BIDを使って現在のBid価格に設定します。StopLossPriceとTakeProfit3Levelも同様に設定し、TradeDistanceはEntryPriceからTakeProfit3Levelを引いた値として計算します。TakeProfit1LevelとTakeProfit2Levelは、そのTradeDistanceの3分の1および3分の2をEntryPriceから差し引いた値として求められます。
次にDrawDottedLine関数を4回呼び出し、以下の4本の水平ラインを描画します。「ObjectPrefix + '_EntryLine'」をEntryPriceで描画し色はclrMagenta、「ObjectPrefix + '_TP1Line'」をTakeProfit1Levelで描画し色はclrForestGreen、「ObjectPrefix + '_TP2Line'」をTakeProfit2Levelで描画し色はclrGreen、「ObjectPrefix + '_TP3Line'」をTakeProfit3Levelで描画し色はclrDarkGreenとします。すべての線はLineStartTimeからLineEndTimeまでの範囲で描画されます。
ラベルを追加するためLabelTimeをLineEndTimeにPeriodSecondsの半分を加えた時間に設定します。EntryLabelTextはPatternDirectionに基づき「BUY (」または「SELL (」を設定し、そこにEntryPriceをDoubleToStringと_Digitsでフォーマットした値を追加します。DrawTextLabel関数を使い「ObjectPrefix + '_EntryLabel'」という名前でEntryPriceの位置にclrMagenta色のラベルを描画します。
同様にTP1LabelText、TP2LabelText、TP3LabelTextにはそれぞれTakeProfit1Level、TakeProfit2Level、TakeProfit3Levelをフォーマットして設定し、それぞれにDrawTextLabelを呼び出し対応する価格レベルにclrForestGreen、clrGreen、clrDarkGreenのラベルを描画します。すべてのラベルはフォントサイズ11で価格より上に配置しトレードレベルを視覚的に明確にします。以下はその結果です。
弱気パターン
強気パターン
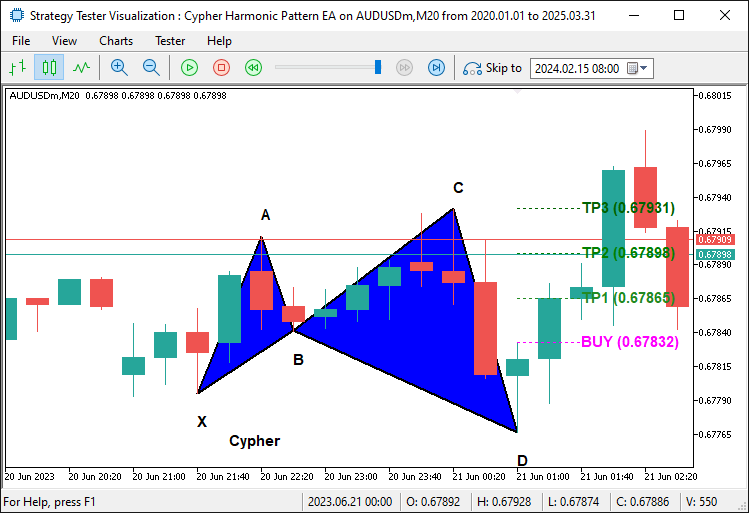
画像から、トレードレベルを正しくマッピングできていることが確認できます。次におこなうべきことは、実際のポジションを建てることだけです。
//--- **Trading Logic**
//--- Check if trading is allowed and no position is already open
if(TradingEnabled && !PositionSelect(_Symbol)) {
   //--- Place a buy or sell order based on pattern type
   bool TradeSuccessful = (PatternDirection == "Bullish") ?
      obj_Trade.Buy(TradeVolume, _Symbol, EntryPrice, StopLossPrice, TakeProfitPrice, "Cypher Buy") :
      obj_Trade.Sell(TradeVolume, _Symbol, EntryPrice, StopLossPrice, TakeProfitPrice, "Cypher Sell");
   //--- Log the result of the trade attempt
   if(TradeSuccessful)
      Print(PatternDirection, " order opened successfully.");
   else
      Print(PatternDirection, " order failed: ", obj_Trade.ResultRetcodeDescription());
}

//--- Force the chart to update and show all drawn objects
ChartRedraw();
ここでは条件が満たされたときにCypherパターンの取引を実行する取引ロジックを実装します。まずTradingEnabledがtrueであり、PositionSelect関数に_Symbolを渡して現在のシンボルに対するポジションが開かれていないことを確認し、許可された場合かつ既存のポジションと競合しない場合のみ取引をおこないます。両方の条件を満たしたら、三項演算子を用いてPatternDirectionに基づく取引を実行します。Bullishパターンの場合はobj_Trade.Buy関数をTradeVolume、_Symbol、EntryPrice、StopLossPrice、TakeProfitPrice、コメントにCypher Buyを指定して呼び出し、Bearishパターンの場合は同じパラメータでコメントをCypher Sellとしてobj_Trade.Sell関数を呼び出します。結果はTradeSuccessfulに格納されます。
次にPrint関数を用いて結果をログに出力します。TradeSuccessfulがtrueならPatternDirectionとorder opened successfullyを、falseならorder failedとobj_Trade.ResultRetcodeDescriptionによるエラー説明を表示します。最後にChartRedraw関数を呼び出し、MetaTrader 5のチャートを強制的に更新して三角形やライン、ラベルなど描画されたすべてのオブジェクトを即座にユーザーに表示させます。
最後にプログラムを削除する際には、チャート上のパターンも削除する必要があります。
//+------------------------------------------------------------------+
//| Expert deinitialization function                                 |
//+------------------------------------------------------------------+
//--- Runs when the EA stops (e.g., removed from chart)
void OnDeinit(const int reason) {
   //--- Remove all objects starting with "CY_" (our Cypher pattern objects)
   ObjectsDeleteAll(0, "CY_");
}
OnDeinitイベントハンドラ内ではObjectsDeleteAll関数を使用して名前が「CY_」で始まるすべてのチャートオブジェクトを削除し、三角形やトレンドライン、ラベルなどのCypherパターンに関連するすべての可視化をチャートから消去します。これによりシステムが非アクティブになった際に作業スペースをきれいに保つことができます。コンパイルすると、次の結果が得られます。
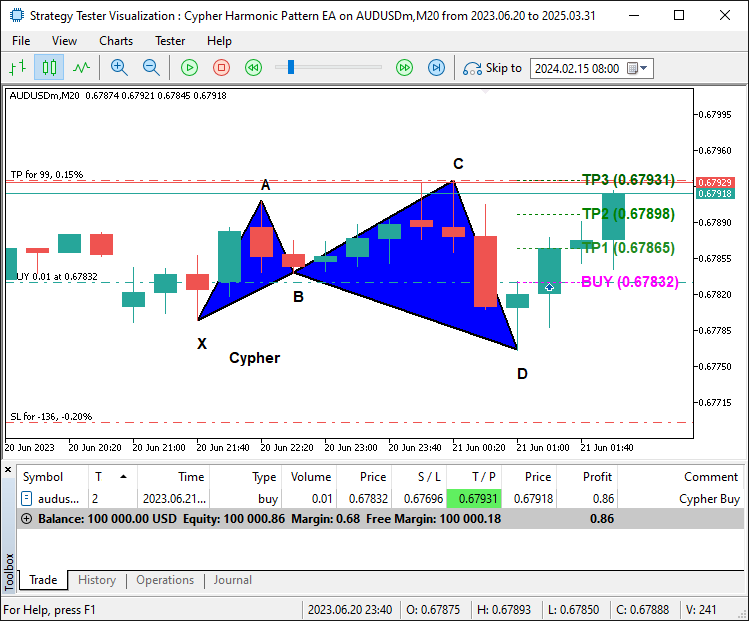
画像から、Cypherパターンを正しくプロットできており、パターンが確定した後にそれに応じて取引も行えていることが確認できます。これにより、パターンの識別、描画、取引という目的を達成できています。残された作業はプログラムのバックテストであり、それについては次のセクションで取り扱います。
バックテストと最適化
初期のバックテスト中に重大な問題を発見しました。それはシステムがパターンをリペイントしやすいことです。リペイントとは、あるバーの時点でCypherパターンが有効に見えても、新しい価格データが入るとパターンが変化したり消えたりしてしまい、信頼性の低い売買シグナルを生み出す現象を指します。この問題により、後に無効と判明するパターンに基づいて誤った取引(偽陽性)がおこなわれ、パフォーマンスに悪影響を及ぼしました。以下に、その例を示します。
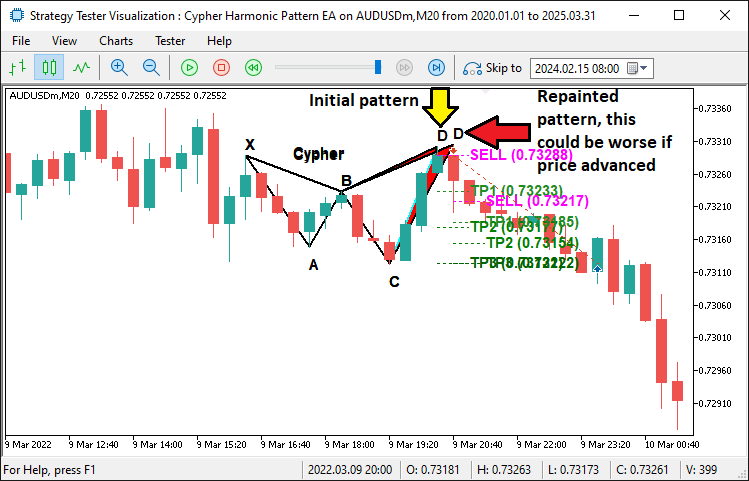
この問題に対処するために、パターンロック機構を実装しました。グローバル変数g_patternFormationBarとg_lockedPatternXを用いて、パターン検出時にロックし、次のバーでパターンを確定させることでXのスイングポイントが一貫していることを保証します。この修正によりリペイントが大幅に減少し、その後のテストでもパターン検出の安定性が向上し無効な取引が減ったことが確認されています。以下はパターンをロックし、パターンが安定するまで取引を待つためのコード例です。
//--- If the pattern has changed, update the lock
g_patternFormationBar = CurrentBarIndex;
g_lockedPatternX = PointX.TimeOfSwing;
Print("Cypher pattern has changed; updating lock on bar ", CurrentBarIndex, ". Waiting for confirmation.");
return;
パターンが確定し安定するまで、追加の1本のバーを待つように常に確認ロジックを追加しました。これは、パターン形成の始まりに過ぎなかったことに後から気づくような、早すぎるエントリーを避けるためです。ロックパターンを追加した後、この問題は解消されたことが確認できました。
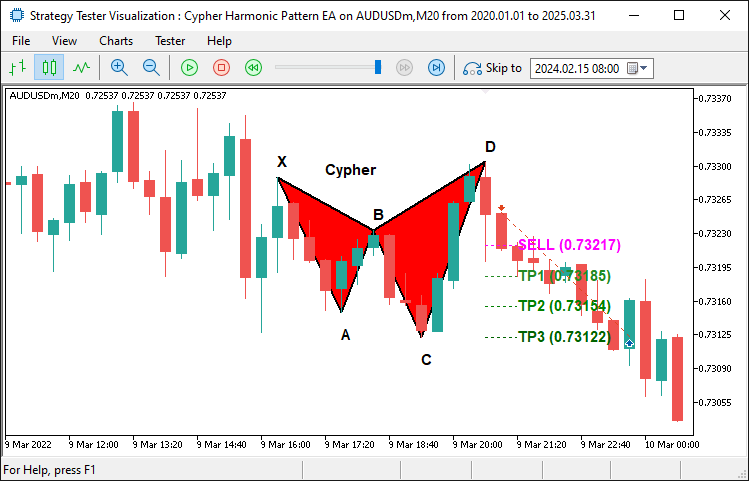
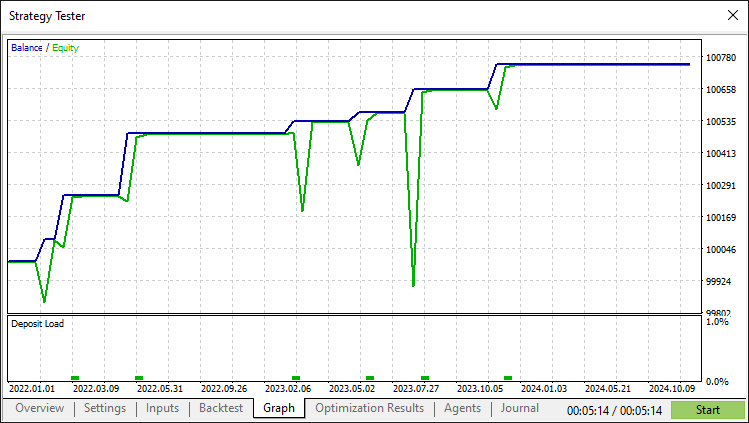
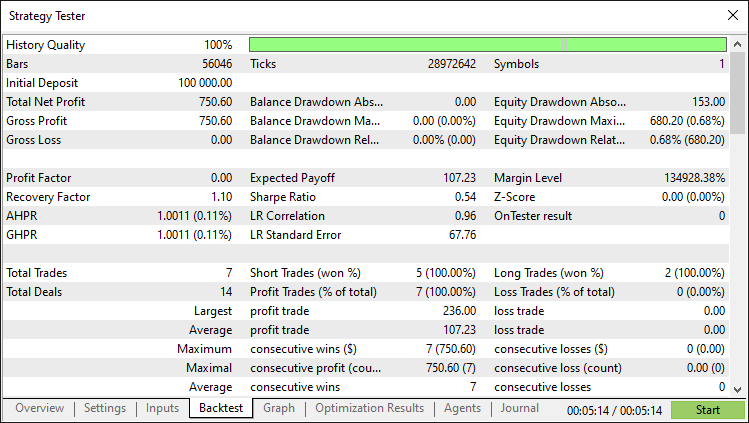
修正と徹底的なバックテストの結果、次の結果が得られました。
バックテストグラフ
バックテストレポート
結論
結論として、私たちはCypherハーモニックパターンを高精度で検出・取引するMetaQuotes Language 5 EAを無事に開発しました。スイングポイント検出、フィボナッチ比に基づく検証、包括的なチャート可視化、そしてリペイント(再描画)を防ぐためのパターン・ロック機構を統合することで、市場の変化に動的に対応できる堅牢なシステムを構築することができました。
免責条項:本記事は教育目的のみを意図したものです。取引には大きな財務リスクが伴い、市場の状況は予測できない場合があります。概説した戦略はハーモニック取引への構造化されたアプローチを提供しますが、収益性を保証するものではありません。本プログラムを実運用する前には、十分なバックテストと適切なリスク管理が必須です。
これらのテクニックを実装することで、ハーモニックパターン取引スキルを洗練し、テクニカル分析を強化し、アルゴリズム取引戦略を進化させることができます。皆さんの取引の成功をお祈りしております。
MetaQuotes Ltdにより英語から翻訳されました。
元の記事: https://www.mql5.com/en/articles/17865
警告: これらの資料についてのすべての権利はMetaQuotes Ltd.が保有しています。これらの資料の全部または一部の複製や再プリントは禁じられています。
この記事はサイトのユーザーによって執筆されたものであり、著者の個人的な見解を反映しています。MetaQuotes Ltdは、提示された情報の正確性や、記載されているソリューション、戦略、または推奨事項の使用によって生じたいかなる結果についても責任を負いません。
 データサイエンスとML(第37回):ローソク足パターンとAIを活用して市場をリードする
 知っておくべきMQL5ウィザードのテクニック(第60回):移動平均とストキャスティクスパターンを用いた推論(ワッサースタインVAE)
 MQL5での取引戦略の自動化(第16回):ミッドナイトレンジブレイクアウト+Break of Structure (BoS)のプライスアクション
 データサイエンスとML(第36回):偏った金融市場への対処
- 無料取引アプリ
- 8千を超えるシグナルをコピー
- 金融ニュースで金融マーケットを探索
やあ、素晴らしい記事だね。ご苦労様です。完成したコード・ファイルを共有できますか?記事の最後に添付していただけますか?
ようこそ。確認しましたか?ありがとう。
この記事をシェアしてくれてありがとう。他の高調波パターンを実装するのに便利なコードです。
もちろんです。