
MQL5での取引戦略の自動化(第16回):ミッドナイトレンジブレイクアウト+Break of Structure (BoS)のプライスアクション
はじめに
前回の記事(第15回)では、Cypherハーモニックパターンを活用した市場の反転を捉える取引戦略を自動化しました。今回の第16回では、MetaQuotes Language 5 (MQL5)を用いて、「ミッドナイトレンジブレイクアウト + Break of Structure (BoS)」戦略を自動化することに焦点を当て、深夜0時から午前6時までの価格レンジを特定し、BoSを検出して取引を実行するエキスパートアドバイザー(EA)を開発します。次のトピックについて説明します。
この記事を読み終える頃には、主要な価格レベルを可視化し、ブレイクアウトを確認し、リスク管理された取引を実行できる完全機能のMQL5プログラムが完成しているはずです。さっそく始めましょう。
ミッドナイトレンジブレイクアウトとBoS戦略の理解
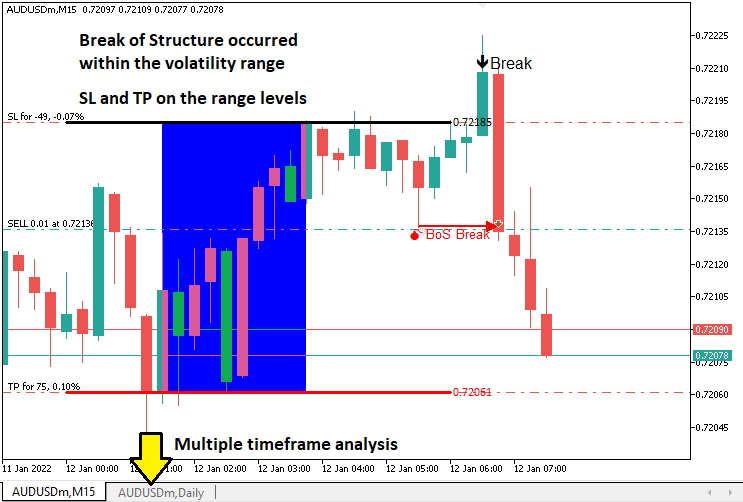
ミッドナイトレンジブレイクアウト + BoS戦略は、深夜0時から午前6時までの値動きが小さい価格レンジを活用し、その間の高値と安値をブレイクアウトの基準レベルとして使用します。そのうえで、BoSによる確認をおこなうことで、取引シグナルの正当性を検証します。BoSは、価格が直近のスイングハイを超えたとき(上昇トレンド)、またはスイングローを下回ったとき(下降トレンド)にトレンドの転換を示すものです。これにより、ダマシのブレイクアウトを除外し、相場のモメンタムに沿ったエントリーが可能になります。この手法は、ロンドン市場のオープン時など、セッションの移行期間に適していますが、どの市場を対象とするかは、トレーダーの判断に委ねられます。ただし、タイムゾーンの整合性を取る必要があり、急激な値動きが発生しやすい重要な経済指標の発表時には注意が必要です。
私たちの実装計画では、深夜0時から午前6時までのレンジを計算し、設定された時間枠内でのブレイクアウトを監視し、指定された時間枠(通常は5分、10分、または15分)においてBoSを確認することで、戦略を自動化するMQL5のEAを作成します。この時間枠はユーザーが動的に選択できるように入力として設定します。システムは、レンジから導き出されるストップロスおよびテイクプロフィットレベルを用いて取引を実行し、チャート上には重要な価格レベルを明示して、視認性を高めます。また、市場環境を問わず一貫したパフォーマンスを維持するために、堅牢なリスク管理も実装します。以上が本戦略の目的です。
MQL5での実装
MQL5でプログラムを作成するには、まずMetaEditorを開き、ナビゲータに移動して、Indicatorsフォルダを見つけ、[新規作成]タブをクリックして、表示される手順に従ってファイルを作成します。ファイルが作成されたら、コーディング環境で、まずプログラム全体で使用するグローバル変数をいくつか宣言する必要があります。
//+------------------------------------------------------------------+
//|                   Midnight Range Break of Structure Breakout.mq5 |
//|                           Copyright 2025, Allan Munene Mutiiria. |
//|                                   https://t.me/Forex_Algo_Trader |
//+------------------------------------------------------------------+
#property copyright "Copyright 2025, Allan Munene Mutiiria."
#property link      "https://t.me/Forex_Algo_Trader"
#property version   "1.00"

#include <Trade/Trade.mqh> //--- Include the Trade library for handling trade operations
CTrade obj_Trade;          //--- Create an instance of the CTrade class for trade execution

double maximum_price = -DBL_MAX;      //--- Initialize the maximum price variable to negative infinity
double minimum_price = DBL_MAX;       //--- Initialize the minimum price variable to positive infinity
datetime maximum_time, minimum_time;  //--- Declare variables to store the times of maximum and minimum prices
bool isHaveDailyRange_Prices = false; //--- Initialize flag to indicate if daily range prices are calculated
bool isHaveRangeBreak = false;        //--- Initialize flag to indicate if a range breakout has occurred
bool isTakenTrade = false;            //--- Initialize flag to indicate if a trade is taken for the current day

#define RECTANGLE_PREFIX "RANGE RECTANGLE " //--- Define a prefix for rectangle object names
#define UPPER_LINE_PREFIX "UPPER LINE "     //--- Define a prefix for upper line object names
#define LOWER_LINE_PREFIX "LOWER LINE "     //--- Define a prefix for lower line object names

// bos
input ENUM_TIMEFRAMES timeframe_bos = PERIOD_M5; // Input the timeframe for Break of Structure (BoS) analysis
ここから、プログラムの基礎部分を構築することで戦略の実装を始めます。まず、<Trade/Trade.mqh>ライブラリをインクルードし、取引操作を可能にします。そして、CTradeクラスのインスタンス「obj_Trade」オブジェクトを生成し、売買ポジションの発注といった取引実行をこのオブジェクトが担います。
次に、この戦略において重要なデータを追跡するために、いくつかのグローバル変数を定義します。maximum_priceとminimum_priceは、それぞれ-DBL_MAXとDBL_MAXで初期化され、深夜0時から午前6時までの間の最高値および最安値を記録します。これにより、レンジの上下限を特定できます。maximum_timeとminimum_timeはdatetime型で、それぞれの極値が発生した時間を記録します。これらの情報は、チャート上にレンジを視覚的に表示する際に必要です。また、いくつかのブール型フラグも使用します。isHaveDailyRange_Pricesは日足レンジの価格がすでに取得されたかどうかを示し、isHaveRangeBreakはブレイクアウトが発生したかどうかを追跡し、isTakenTradeは1日に1回だけ取引を実行するように制御します。これにより過剰な取引を防止します。
チャートの視覚的な表示を補助するために、オブジェクト名の定数も定義します。RECTANGLE_PREFIXは「RANGE RECTANGLE」、UPPER_LINE_PREFIXは「UPPER LINE」、LOWER_LINE_PREFIXは「LOWER LINE」としており、チャート上に描画される矩形やラインといったオブジェクトに一意の名前を付けるために使用されます。これにより、レンジとブレイクアウトのレベルをチャート上に明確に示すことができます。さらに、timeframe_bosというユーザー入力パラメータも導入しており、デフォルトではPERIOD_M5に設定されています。これにより、スイングハイ・スイングローの検出に用いるBoS分析の時間枠をトレーダーが指定できるようになります。これで準備は整いました。次におこなうべきは、新しい日付や新しいバーの間で取引制御をおこなうための2つの関数を定義することです。
//+------------------------------------------------------------------+
//| Function to check for a new bar                                  |
//+------------------------------------------------------------------+
bool isNewBar(){ //--- Define a function to detect a new bar on the current timeframe
   static int prevBars = 0;                //--- Store the previous number of bars
   int currBars = iBars(_Symbol,_Period);  //--- Get the current number of bars
   if (prevBars==currBars) return (false); //--- Return false if no new bar has formed
   prevBars = currBars;                    //--- Update the previous bar count
   return (true);                          //--- Return true if a new bar has formed
}

//+------------------------------------------------------------------+
//| Function to check for a new day                                  |
//+------------------------------------------------------------------+
bool isNewDay(){ //--- Define a function to detect a new trading day
   bool newDay = false;  //--- Initialize the new day flag

   MqlDateTime Str_DateTime;                 //--- Declare a structure to hold date and time information
   TimeToStruct(TimeCurrent(),Str_DateTime); //--- Convert the current time to the structure

   static int prevDay = 0;         //--- Store the previous day's date
   int currDay = Str_DateTime.day; //--- Get the current day's date

   if (prevDay == currDay){ //--- Check if the current day is the same as the previous day
      newDay = false;       //--- Set the flag to false (no new day)
   }
   else if (prevDay != currDay){ //--- Check if a new day has started
      Print("WE HAVE A NEW DAY WITH DATE ",currDay); //--- Log the new day
      prevDay = currDay;                             //--- Update the previous day
      newDay = true;                                 //--- Set the flag to true (new day)
   }

   return (newDay); //--- Return the new day status
}
ここでは、isNewBar関数とisNewDay関数を実装し、MQL5における「ミッドナイトレンジブレイクアウト + BoS」戦略を市場の時間と同期させます。isNewBar関数では、staticなprevBars変数とiBars関数(引数は_Symbolと_Period)を使ってバーの数を追跡し、新しいバーが形成されたときにtrueを返します。isNewDay関数では、MqlDateTime構造体、TimeToStruct関数(TimeCurrentを使用)を用い、staticなprevDayを使って日付の変化を検出します。currDayが変更されたときにレンジの再計算をおこなうようにし、その際にはPrint関数を使ってログ出力します。これらの関数が揃ったことで、OnTickイベントハンドラ内で戦略ロジックを直接定義できる状態になります。
//+------------------------------------------------------------------+
//| Expert tick function                                             |
//+------------------------------------------------------------------+
void OnTick(){
   //---
   static datetime midnight = iTime(_Symbol,PERIOD_D1,0);            //--- Store the current day's midnight time
   static datetime sixAM = midnight + 6 * 3600;                      //--- Calculate 6 AM time by adding 6 hours to midnight
   static datetime scanBarTime = sixAM + 1 * PeriodSeconds(_Period); //--- Set the time of the next bar after 6 AM for scanning
   static double midnight_price = iClose(_Symbol,PERIOD_D1,0);       //--- Store the closing price at midnight

   static datetime validBreakTime_start = scanBarTime;               //--- Set the start time for valid breakout detection
   static datetime validBreakTime_end = midnight + (6+5) * 3600;     //--- Set the end time for valid breakouts to 11 AM

   if (isNewDay()){ //--- Check if a new trading day has started
      midnight = iTime(_Symbol,PERIOD_D1,0);                          //--- Update midnight time for the new day
      sixAM = midnight + 6 * 3600;                                    //--- Recalculate 6 AM time for the new day
      scanBarTime = sixAM + 1 * PeriodSeconds(_Period);               //--- Update the scan bar time to the next bar after 6 AM
      midnight_price = iClose(_Symbol,PERIOD_D1,0);                   //--- Update the midnight closing price
      Print("Midnight price = ",midnight_price,", Time = ",midnight); //--- Log the midnight price and time

      validBreakTime_start = scanBarTime;           //--- Reset the start time for valid breakouts
      validBreakTime_end = midnight + (6+5) * 3600; //--- Reset the end time for valid breakouts to 11 AM

      maximum_price = -DBL_MAX; //--- Reset the maximum price to negative infinity
      minimum_price = DBL_MAX;  //--- Reset the minimum price to positive infinity

      isHaveDailyRange_Prices = false; //--- Reset the flag indicating daily range calculation
      isHaveRangeBreak = false;        //--- Reset the flag indicating a range breakout
      isTakenTrade = false;            //--- Reset the flag indicating a trade is taken
   }
}
ここでは、戦略の中核となるロジックをOnTick関数内に構築します。OnTickは、プログラム内ですべてのティック(価格変動)ごとに実行される主要なイベントハンドラです。まず、重要な時間情報を追跡するために、いくつかのstatic変数を初期化します。midnightには、iTime関数を_Symbol、PERIOD_D1、インデックス0で呼び出すことで当日深夜0時(ミッドナイト)の時間を取得します。sixAMは、このmidnightに6時間(21,600秒)を加算して算出されます。scanBarTimeは、PeriodSeconds関数を_Periodに適用して、6時直後に始まる次のバーの時間を設定します。また、midnight_priceは、iClose関数を使用して、深夜0時の終値(当日始値)を取得します。さらに、有効なブレイクアウトの時間帯を定義するため、validBreakTime_startをscanBarTimeに、validBreakTime_endを0時から11時間後(午前11時)に設定し、有効な取引が発生する時間窓を確立します。
新しい取引日が始まった場合(isNewDay関数で検出)、これらの時間関連変数は新しい日付に合わせて更新されます。具体的には、iTimeやiClose関数を再び使用してmidnight、sixAM、scanBarTime、midnight_priceを更新し、Print関数でデバッグ用にミッドナイトの詳細をログ出力します。加えて、validBreakTime_startとvalidBreakTime_endもその日のブレイクアウト監視用に再設定されます。そして、maximum_priceを-DBL_MAXに、minimum_priceをDBL_MAXに再初期化し、isHaveDailyRange_Prices、isHaveRangeBreak、isTakenTradeの各フラグもfalseに戻します。これにより、EAは新しい日の深夜0時から午前6時までのレンジを再計算し、次のブレイクアウトを正確に監視できる状態になります。これで、時間範囲の計算を確認できます。
if (isNewBar()){ //--- Check if a new bar has formed on the current timeframe
   datetime currentBarTime = iTime(_Symbol,_Period,0); //--- Get the time of the current bar

   if (currentBarTime == scanBarTime && !isHaveDailyRange_Prices){              //--- Check if it's time to scan for daily range and range is not yet calculated
      Print("WE HAVE ENOUGH BARS DATA FOR DOCUMENTATION. MAKE THE EXTRACTION"); //--- Log that the scan for daily range is starting
      int total_bars = int((sixAM - midnight)/PeriodSeconds(_Period))+1;        //--- Calculate the number of bars from midnight to 6 AM
      Print("Total Bars for scan = ",total_bars);                               //--- Log the total number of bars to scan
      int highest_price_bar_index = -1;                                         //--- Initialize the index of the bar with the highest price
      int lowest_price_bar_index = -1;                                          //--- Initialize the index of the bar with the lowest price

      for (int i=1; i<=total_bars ; i++){ //--- Loop through each bar from midnight to 6 AM
         double open_i = open(i);   //--- Get the open price of the i-th bar
         double close_i = close(i); //--- Get the close price of the i-th bar

         double highest_price_i = (open_i > close_i) ? open_i : close_i; //--- Determine the highest price (open or close) of the bar
         double lowest_price_i = (open_i < close_i) ? open_i : close_i;  //--- Determine the lowest price (open or close) of the bar

         if (highest_price_i > maximum_price){ //--- Check if the bar's highest price exceeds the current maximum
            maximum_price = highest_price_i;   //--- Update the maximum price
            highest_price_bar_index = i;       //--- Store the bar index of the maximum price
            maximum_time = time(i);            //--- Store the time of the maximum price
         }
         if (lowest_price_i < minimum_price){ //--- Check if the bar's lowest price is below the current minimum
            minimum_price = lowest_price_i; //--- Update the minimum price
            lowest_price_bar_index = i;     //--- Store the bar index of the minimum price
            minimum_time = time(i);         //--- Store the time of the minimum price
         }
      }
      Print("Maximum Price = ",maximum_price,", Bar index = ",highest_price_bar_index,", Time = ",maximum_time); //--- Log the maximum price, its bar index, and time
      Print("Minimum Price = ",minimum_price,", Bar index = ",lowest_price_bar_index,", Time = ",minimum_time);  //--- Log the minimum price, its bar index, and time

      isHaveDailyRange_Prices = true; //--- Set the flag to indicate that the daily range is calculated
   }
}
新しいバーが形成されたときに深夜0時から午前6時までの価格レンジを計算するために、まずisNewBar関数を使って新しいバーが出現したかどうかを確認します。その後、_Symbol、_Period、インデックス0を引数にiTimeを使って現在のバーの時刻を取得し、それをcurrentBarTimeに保存します。もしこのcurrentBarTimeがscanBarTimeと一致し、かつisHaveDailyRange_Pricesがfalseの場合、Printを使ってレンジスキャンの開始をログ出力します。その後、PeriodSecondsを_Periodに適用してtotal_barsを計算し、バーをループ処理して最高値と最安値を取得します。この際、OpenやClose関数などを用いて価格を取得し、maximum_price、minimum_price、maximum_time、minimum_time、およびそれぞれのインデックスを更新します。最終的なレンジの結果をログ出力したのち、isHaveDailyRange_Pricesをtrueに設定し、ブレイクアウトの監視が可能な状態にします。
簡潔に処理するために、価格取得には事前定義された関数を使用しています。それらは以下のとおりです。
//+------------------------------------------------------------------+
//| Helper functions for price and time data                         |
//+------------------------------------------------------------------+
double open(int index){return (iOpen(_Symbol,_Period,index));}   //--- Return the open price of the specified bar index on the current timeframe
double high(int index){return (iHigh(_Symbol,_Period,index));}   //--- Return the high price of the specified bar index on the current timeframe
double low(int index){return (iLow(_Symbol,_Period,index));}     //--- Return the low price of the specified bar index on the current timeframe
double close(int index){return (iClose(_Symbol,_Period,index));} //--- Return the close price of the specified bar index on the current timeframe
datetime time(int index){return (iTime(_Symbol,_Period,index));} //--- Return the time of the specified bar index on the current timeframe

double high(int index,ENUM_TIMEFRAMES tf_bos){return (iHigh(_Symbol,tf_bos,index));}   //--- Return the high price of the specified bar index on the BoS timeframe
double low(int index,ENUM_TIMEFRAMES tf_bos){return (iLow(_Symbol,tf_bos,index));}     //--- Return the low price of the specified bar index on the BoS timeframe
datetime time(int index,ENUM_TIMEFRAMES tf_bos){return (iTime(_Symbol,tf_bos,index));} //--- Return the time of the specified bar index on the BoS timeframe
効率的に価格や時間のデータを取得するために、補助関数を実装します。open、high、low、close、およびtime関数を定義し、それぞれがindexパラメータを受け取ることで、現在の時間枠におけるバーの情報を取得します。これらの関数は、iOpen、iHigh、iLow、iClose、およびiTimeを使用し、_Symbolと_Periodを引数として、指定されたバーインデックスに対する始値、高値、安値、終値、または時間を返します。
さらに、high、low、time関数をオーバーロードしてENUM_TIMEFRAMEStf_bosパラメータを受け取れるようにし、BoSで使用する時間枠に対応した高値、安値、または時間を取得できるようにします。これらもiHigh、iLow、iTimeを使い、_Symbolとtf_bosを引数として使用します。すでに価格レンジの定義が完了しているので、これをチャート上に視覚的に表示します。そのためには、追加の補助関数をいくつか定義する必要があります。
//+------------------------------------------------------------------+
//| Function to create a rectangle object                            |
//+------------------------------------------------------------------+
void create_Rectangle(string objName,datetime time1,double price1,
               datetime time2,double price2,color clr){ //--- Define a function to draw a rectangle on the chart
   if (ObjectFind(0,objName) < 0){                                       //--- Check if the rectangle object does not already exist
      ObjectCreate(0,objName,OBJ_RECTANGLE,0,time1,price1,time2,price2); //--- Create a rectangle object with specified coordinates

      ObjectSetInteger(0,objName,OBJPROP_TIME,0,time1);  //--- Set the first time coordinate of the rectangle
      ObjectSetDouble(0,objName,OBJPROP_PRICE,0,price1); //--- Set the first price coordinate of the rectangle
      ObjectSetInteger(0,objName,OBJPROP_TIME,1,time2);  //--- Set the second time coordinate of the rectangle
      ObjectSetDouble(0,objName,OBJPROP_PRICE,1,price2); //--- Set the second price coordinate of the rectangle
      ObjectSetInteger(0,objName,OBJPROP_FILL,true);     //--- Enable filling the rectangle with color
      ObjectSetInteger(0,objName,OBJPROP_COLOR,clr);     //--- Set the color of the rectangle
      ObjectSetInteger(0,objName,OBJPROP_BACK,false);    //--- Ensure the rectangle is drawn in the foreground

      ChartRedraw(0); //--- Redraw the chart to display the rectangle
   }
}

//+------------------------------------------------------------------+
//| Function to create a line object with text                       |
//+------------------------------------------------------------------+
void create_Line(string objName,datetime time1,double price1,
               datetime time2,double price2,int width,color clr,string text){ //--- Define a function to draw a trend line with text
   if (ObjectFind(0,objName) < 0){                                   //--- Check if the line object does not already exist
      ObjectCreate(0,objName,OBJ_TREND,0,time1,price1,time2,price2); //--- Create a trend line object with specified coordinates

      ObjectSetInteger(0,objName,OBJPROP_TIME,0,time1);  //--- Set the first time coordinate of the line
      ObjectSetDouble(0,objName,OBJPROP_PRICE,0,price1); //--- Set the first price coordinate of the line
      ObjectSetInteger(0,objName,OBJPROP_TIME,1,time2);  //--- Set the second time coordinate of the line
      ObjectSetDouble(0,objName,OBJPROP_PRICE,1,price2); //--- Set the second price coordinate of the line
      ObjectSetInteger(0,objName,OBJPROP_WIDTH,width);   //--- Set the width of the line
      ObjectSetInteger(0,objName,OBJPROP_COLOR,clr);     //--- Set the color of the line
      ObjectSetInteger(0,objName,OBJPROP_BACK,false);    //--- Ensure the line is drawn in the foreground

      long scale = 0; //--- Initialize a variable to store the chart scale
      if(!ChartGetInteger(0,CHART_SCALE,0,scale)){                                   //--- Attempt to get the chart scale
         Print("UNABLE TO GET THE CHART SCALE. DEFAULT OF ",scale," IS CONSIDERED"); //--- Log if the chart scale cannot be retrieved
      }

      int fontsize = 11; //--- Set the default font size for the text
      if (scale==0){fontsize=5;} //--- Adjust font size for minimized chart scale
      else if (scale==1){fontsize=6;}  //--- Adjust font size for scale 1
      else if (scale==2){fontsize=7;}  //--- Adjust font size for scale 2
      else if (scale==3){fontsize=9;}  //--- Adjust font size for scale 3
      else if (scale==4){fontsize=11;} //--- Adjust font size for scale 4
      else if (scale==5){fontsize=13;} //--- Adjust font size for maximized chart scale

      string txt = " Right Price";         //--- Define the text suffix for the price label
      string objNameDescr = objName + txt; //--- Create a unique name for the text object
      ObjectCreate(0,objNameDescr,OBJ_TEXT,0,time2,price2);        //--- Create a text object at the line's end
      ObjectSetInteger(0,objNameDescr,OBJPROP_COLOR,clr);          //--- Set the color of the text
      ObjectSetInteger(0,objNameDescr,OBJPROP_FONTSIZE,fontsize);  //--- Set the font size of the text
      ObjectSetInteger(0,objNameDescr,OBJPROP_ANCHOR,ANCHOR_LEFT); //--- Set the text anchor to the left
      ObjectSetString(0,objNameDescr,OBJPROP_TEXT," "+text);       //--- Set the text content (price value)
      ObjectSetString(0,objNameDescr,OBJPROP_FONT,"Calibri");      //--- Set the font type to Calibri

      ChartRedraw(0); //--- Redraw the chart to display the line and text
   }
}
レンジを視覚化するために、2つの関数を定義します。まずcreate_Rectangle関数では深夜0時から午前6時までの価格レンジを表す塗りつぶし矩形を描画します。関数はobjName、time1、price1、time2、price2、clrの各パラメータを受け取り、描画内容をカスタマイズできるようにしています。最初にObjectFind関数を使ってチャートID0上に同名のオブジェクトが存在しないかを確認し重複描画を防ぎます。
オブジェクトが存在しない場合は、ObjectCreate関数を使ってOBJ_RECTANGLEを作成し、ObjectSetInteger関数を使ってOBJPROP_TIMEをObjectSetDouble関数でOBJPROP_PRICEを設定します。ObjectSetIntegerにより塗りつぶし、OBJPROP_FILLを有効にし矩形の色を設定します。さらにOBJPROP_BACKをfalseに設定することで矩形がチャートの前面に表示されるようにします。最後にChartRedraw関数を呼び出してチャートを更新します
次にcreate_Line関数では価格レンジの上限や下限を示すトレンドラインを描画し、ラベルテキストも加えます。関数はobjName、time1、price1、time2、price2、width、clr、textの各パラメータを受け取ります。まずObjectFindで同名のラインが存在しないことを確認し、なければObjectCreateでOBJ_TRENDを作成します。その後ObjectSetInteger関数やObjectSetDouble関数を使ってラインの座標太さ色などを設定します。テキストの読みやすさを保つために、ChartGetIntegerを使ってチャートのスケールズームレベルを取得し、取得に失敗した場合はPrint関数でログを出力します。取得したスケールに応じてフォントサイズを5から13の範囲で動的に調整します。
テキストオブジェクトはObjectCreateを使ってOBJ_TEXTとしてobjNameDescrの名前で作成し、ObjectSetString関数を使って文字の色やフォントサイズ左寄せを設定します。またObjectSetStringでフォントCalibriと表示する価格テキストを設定します。最後にChartRedrawを呼び出してチャートに反映させます。価格レンジを定義したタイミングでこれらの関数を呼び出します。
create_Rectangle(RECTANGLE_PREFIX+TimeToString(maximum_time),maximum_time,maximum_price,minimum_time,minimum_price,clrBlue);                       //--- Draw a rectangle to mark the daily range
create_Line(UPPER_LINE_PREFIX+TimeToString(midnight),midnight,maximum_price,sixAM,maximum_price,3,clrBlack,DoubleToString(maximum_price,_Digits)); //--- Draw the upper line for the range
create_Line(LOWER_LINE_PREFIX+TimeToString(midnight),midnight,minimum_price,sixAM,minimum_price,3,clrRed,DoubleToString(minimum_price,_Digits));   //--- Draw the lower line for the range
深夜0時から午前6時までの価格レンジの視覚化を完了するために、create_Rectangle関数を呼び出します。引数には、「RECTANGLE_PREFIX+TimeToString(maximum_time)」、maximum_time、maximum_price、minimum_time、minimum_price、clrBlueを指定し、レンジを示す矩形を描画します。続いて、create_Lineを2回使用します。1回目は上限ライン用で、「UPPER_LINE_PREFIX+TimeToString(midnight)」、midnight、maximum_price、sixAM、幅3、clrBlack、そしてDoubleToString(maximum_price,_Digits)を指定します。2回目は下限ライン用で、LOWER_LINE_PREFIX、midnight、minimum_price、sixAM、幅3、clrRed、そして「DoubleToString(minimum_price、_Digits)」を使い、対応するパラメータを設定します。現在の結果は次のとおりです。
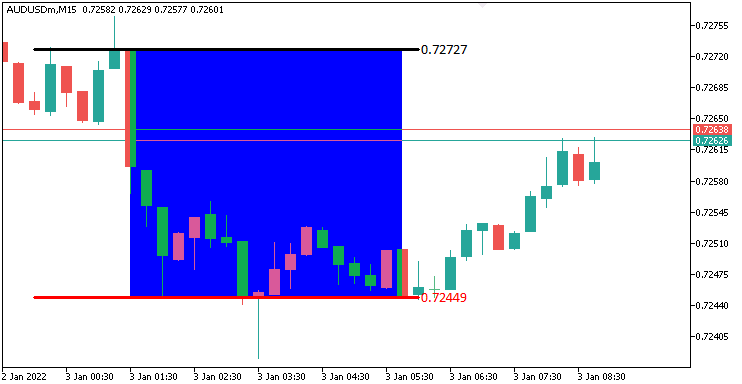
画像から、価格レンジが正確に視覚化されていることが確認できます。次におこなうべきことは、事前に定義された時間帯の中でブレイクが発生したかを追跡し、チャート上にも表示することです。そのためには、ブレイクをチャートに表示するためのカスタム関数が必要になります。
//+------------------------------------------------------------------+
//| Function to draw a breakpoint marker                             |
//+------------------------------------------------------------------+
void drawBreakPoint(string objName,datetime time,double price,int arrCode,
   color clr,int direction){ //--- Define a function to draw a breakpoint marker
   if (ObjectFind(0,objName) < 0){ //--- Check if the breakpoint object does not already exist
      ObjectCreate(0,objName,OBJ_ARROW,0,time,price);        //--- Create an arrow object at the specified time and price
      ObjectSetInteger(0,objName,OBJPROP_ARROWCODE,arrCode); //--- Set the arrow code for the marker
      ObjectSetInteger(0,objName,OBJPROP_COLOR,clr);         //--- Set the color of the arrow
      ObjectSetInteger(0,objName,OBJPROP_FONTSIZE,12);       //--- Set the font size for the arrow
      if (direction > 0) ObjectSetInteger(0,objName,OBJPROP_ANCHOR,ANCHOR_TOP);    //--- Set the anchor to top for upward breaks
      if (direction < 0) ObjectSetInteger(0,objName,OBJPROP_ANCHOR,ANCHOR_BOTTOM); //--- Set the anchor to bottom for downward breaks

      string txt = " Break"; //--- Define the text suffix for the breakpoint label
      string objNameDescr = objName + txt; //--- Create a unique name for the text object
      ObjectCreate(0,objNameDescr,OBJ_TEXT,0,time,price);   //--- Create a text object at the breakpoint
      ObjectSetInteger(0,objNameDescr,OBJPROP_COLOR,clr);   //--- Set the color of the text
      ObjectSetInteger(0,objNameDescr,OBJPROP_FONTSIZE,12); //--- Set the font size of the text
      if (direction > 0) { //--- Check if the breakout is upward
         ObjectSetInteger(0,objNameDescr,OBJPROP_ANCHOR,ANCHOR_LEFT_UPPER); //--- Set the text anchor to left upper
         ObjectSetString(0,objNameDescr,OBJPROP_TEXT, " " + txt);           //--- Set the text content
      }
      if (direction < 0) { //--- Check if the breakout is downward
         ObjectSetInteger(0,objNameDescr,OBJPROP_ANCHOR,ANCHOR_LEFT_LOWER); //--- Set the text anchor to left lower
         ObjectSetString(0,objNameDescr,OBJPROP_TEXT, " " + txt);           //--- Set the text content
      }
   }
   ChartRedraw(0); //--- Redraw the chart to display the breakpoint
}
ここでは、ブレイクアウト地点を視覚的にマークするために、drawBreakPoint関数を定義します。この関数は、objName、time、price、arrCode、clr、directionの各パラメータを受け取ります。まず、ObjectFindオブジェクトが存在しないことを確認し、存在しない場合はObjectCreate関数とOBJ_ARROWを使って矢印を作成します。その後、ObjectSetIntegerを使って矢印のスタイル、色、フォントサイズ12を設定し、directionに応じてANCHOR_TOPまたはANCHOR_BOTTOMにアンカーを配置します。
続いて、ラベルテキストBreakを表示するためにObjectCreate関数でOBJ_TEXTを作成し、名前はobjNameDescrとします。ObjectSetIntegerで色、フォントサイズ、アンカー位置(ANCHOR_LEFT_UPPERまたはANCHOR_LEFT_LOWER)を設定し、ObjectSetString関数でフォントとテキスト内容を指定します。最後にChartRedrawを呼び出して、これらのマーカーをチャートに表示します。これにより、ブレイクアウトの視覚的な識別が可能になります。
double barClose = close(1); //--- Get the closing price of the previous bar
datetime barTime = time(1); //--- Get the time of the previous bar

if (barClose > maximum_price && isHaveDailyRange_Prices && !isHaveRangeBreak
    && barTime >= validBreakTime_start && barTime <= validBreakTime_end
){ //--- Check for a breakout above the maximum price within the valid time window
   Print("CLOSE Price broke the HIGH range. ",barClose," > ",maximum_price); //--- Log the breakout above the high range
   isHaveRangeBreak = true;                                                //--- Set the flag to indicate a range breakout has occurred
   drawBreakPoint(TimeToString(barTime),barTime,barClose,234,clrBlack,-1); //--- Draw a breakpoint marker for the high breakout
}
else if (barClose < minimum_price && isHaveDailyRange_Prices && !isHaveRangeBreak
         && barTime >= validBreakTime_start && barTime <= validBreakTime_end
){ //--- Check for a breakout below the minimum price within the valid time window
   Print("CLOSE Price broke the LOW range. ",barClose," < ",minimum_price); //--- Log the breakout below the low range
   isHaveRangeBreak = true;                                              //--- Set the flag to indicate a range breakout has occurred
   drawBreakPoint(TimeToString(barTime),barTime,barClose,233,clrBlue,1); //--- Draw a breakpoint marker for the low breakout
}
有効なブレイクアウトを検出し視覚化するために、前のバーの終値をclose(1)で取得してbarCloseに、時間をtime(1)で取得してbarTimeに格納します。barCloseがmaximum_priceを上回り、かつisHaveDailyRange_Pricesがtrue、isHaveRangeBreakがfalseであり、さらにbarTimeがvalidBreakTime_startからvalidBreakTime_endの範囲内にある場合は、高値側のブレイクアウトと判断します。その際、Printでログを出力し、isHaveRangeBreakをtrueに設定し、drawBreakPointを呼び出して、TimeToString(barTime)、barClose、矢印コード234、clrBlack、方向-1を指定します。
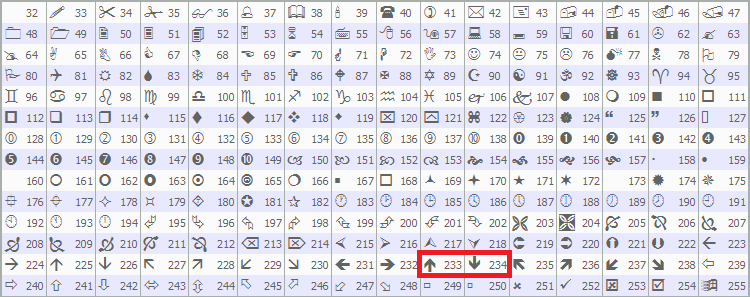
反対に、barCloseがminimum_priceを下回り、その他の条件が同じである場合、安値側のブレイクアウトと判断します。この場合もログを出力し、isHaveRangeBreakをtrueに設定し、drawBreakPointを呼び出して、矢印コード233、clrBlue、方向1を指定します。これにより、有効なブレイクアウトをチャート上にマークできます。今回使用している矢印コードはMQL5の定義済みコード233と234ですが、好みに応じて他のコードを使うことも可能です。
プログラムを実行すると、次の出力が得られます。
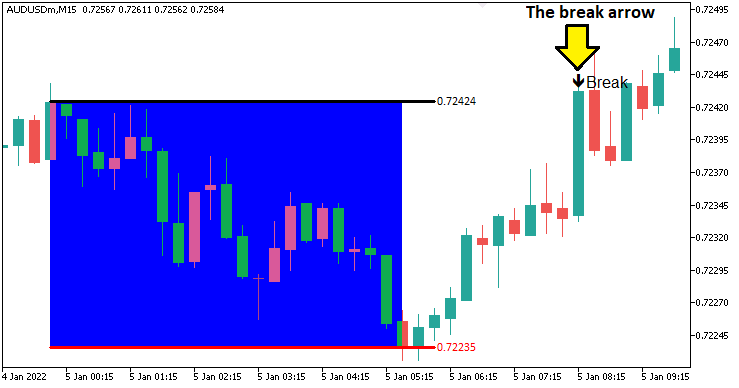
画像から、ブレイクを正確に識別して可視化できていることが確認できます。次に必要なのは、構造シフトとそのブレイクロジックを定義することです。したがって、特定されたスイングポイントを描画する関数が必要になります。
//+------------------------------------------------------------------+
//| Function to draw a swing point marker                            |
//+------------------------------------------------------------------+
void drawSwingPoint(string objName,datetime time,double price,int arrCode,
   color clr,int direction){ //--- Define a function to draw a swing point marker
   if (ObjectFind(0,objName) < 0){ //--- Check if the swing point object does not already exist
      ObjectCreate(0,objName,OBJ_ARROW,0,time,price);        //--- Create an arrow object at the specified time and price
      ObjectSetInteger(0,objName,OBJPROP_ARROWCODE,arrCode); //--- Set the arrow code for the marker
      ObjectSetInteger(0,objName,OBJPROP_COLOR,clr);         //--- Set the color of the arrow
      ObjectSetInteger(0,objName,OBJPROP_FONTSIZE,10);       //--- Set the font size for the arrow

      if (direction > 0) {ObjectSetInteger(0,objName,OBJPROP_ANCHOR,ANCHOR_TOP);}    //--- Set the anchor to top for swing lows
      if (direction < 0) {ObjectSetInteger(0,objName,OBJPROP_ANCHOR,ANCHOR_BOTTOM);} //--- Set the anchor to bottom for swing highs

      string text = "BoS";                   //--- Define the text label for Break of Structure
      string objName_Descr = objName + text; //--- Create a unique name for the text object
      ObjectCreate(0,objName_Descr,OBJ_TEXT,0,time,price);   //--- Create a text object at the swing point
      ObjectSetInteger(0,objName_Descr,OBJPROP_COLOR,clr);   //--- Set the color of the text
      ObjectSetInteger(0,objName_Descr,OBJPROP_FONTSIZE,10); //--- Set the font size of the text

      if (direction > 0) { //--- Check if the swing is a low
         ObjectSetString(0,objName_Descr,OBJPROP_TEXT,"  "+text);            //--- Set the text content
         ObjectSetInteger(0,objName_Descr,OBJPROP_ANCHOR,ANCHOR_LEFT_UPPER); //--- Set the text anchor to left upper
      }
      if (direction < 0) { //--- Check if the swing is a high
         ObjectSetString(0,objName_Descr,OBJPROP_TEXT,"  "+text);            //--- Set the text content
         ObjectSetInteger(0,objName_Descr,OBJPROP_ANCHOR,ANCHOR_LEFT_LOWER); //--- Set the text anchor to left lower
      }
   }
   ChartRedraw(0); //--- Redraw the chart to display the swing point
}
識別されたスイングハイおよびスイングローをマークするために、drawSwingPoint関数を実装します。関数は、objName、time、price、arrCode、clr、directionの各パラメータを受け取ります。まずObjectFind関数を使ってオブジェクトが存在しないことを確認し、存在しない場合はObjectCreate関数を使ってOBJ_ARROWで矢印を作成します。その後、ObjectSetInteger関数を使ってスタイル、色、フォントサイズ10を設定し、directionに応じてANCHOR_TOP(スイングローの場合)またはANCHOR_BOTTOM(スイングハイの場合)を設定します。次に「BoS」というラベルを追加するため、ObjectCreate関数を使ってOBJ_TEXTを作成します。ObjectSetIntegerで色、フォントサイズ、アンカー位置(ANCHOR_LEFT_UPPERまたはANCHOR_LEFT_LOWER)を設定し、ObjectSetString関数でフォントとテキストを指定します。最後にChartRedraw関数を呼び出してマーカーを表示し、重要なスイングポイントをチャート上に強調します。この関数を使うことで、スイングポイントの識別ロジックを次に組み立てていく準備が整います。
// bos logic
if (isHaveDailyRange_Prices){ //--- Proceed with BoS logic only if the daily range is calculated
   static bool isNewBar_bos = false;            //--- Initialize flag to indicate a new bar on the BoS timeframe
   int currBars = iBars(_Symbol,timeframe_bos); //--- Get the current number of bars on the BoS timeframe
   static int prevBars = currBars;              //--- Store the previous number of bars for comparison

   if (prevBars == currBars){isNewBar_bos = false;}                          //--- Set flag to false if no new bar has formed
   else if (prevBars != currBars){isNewBar_bos = true; prevBars = currBars;} //--- Set flag to true and update prevBars if a new bar has formed

   const int length = 4;                         //--- Define the number of bars to check for swing high/low (must be > 2)
   int right_index, left_index;                  //--- Declare variables to store indices for bars to the right and left
   int curr_bar = length;                        //--- Set the current bar index for swing analysis
   bool isSwingHigh = true, isSwingLow = true;   //--- Initialize flags to determine if the current bar is a swing high or low
   static double swing_H = -1.0, swing_L = -1.0; //--- Initialize variables to store the latest swing high and low prices

   if (isNewBar_bos){ //--- Check if a new bar has formed on the BoS timeframe
      for (int a=1; a<=length; a++){ //--- Loop through the specified number of bars to check for swings
         right_index = curr_bar - a; //--- Calculate the right-side bar index
         left_index = curr_bar + a;  //--- Calculate the left-side bar index
         if ( (high(curr_bar,timeframe_bos) <= high(right_index,timeframe_bos)) || (high(curr_bar,timeframe_bos) < high(left_index,timeframe_bos)) ){ //--- Check if the current bar's high is not the highest
            isSwingHigh = false; //--- Set flag to false if the bar is not a swing high
         }
         if ( (low(curr_bar,timeframe_bos) >= low(right_index,timeframe_bos)) || (low(curr_bar,timeframe_bos) > low(left_index,timeframe_bos)) ){ //--- Check if the current bar's low is not the lowest
            isSwingLow = false; //--- Set flag to false if the bar is not a swing low
         }
      }

      if (isSwingHigh){ //--- Check if the current bar is a swing high
         swing_H = high(curr_bar,timeframe_bos); //--- Store the swing high price
         Print("WE DO HAVE A SWING HIGH @ BAR INDEX ",curr_bar," H: ",high(curr_bar,timeframe_bos)); //--- Log the swing high details
         drawSwingPoint(TimeToString(time(curr_bar,timeframe_bos)),time(curr_bar,timeframe_bos),high(curr_bar,timeframe_bos),77,clrBlue,-1); //--- Draw a marker for the swing high
      }
      if (isSwingLow){ //--- Check if the current bar is a swing low
         swing_L = low(curr_bar,timeframe_bos); //--- Store the swing low price
         Print("WE DO HAVE A SWING LOW @ BAR INDEX ",curr_bar," L: ",low(curr_bar,timeframe_bos)); //--- Log the swing low details
         drawSwingPoint(TimeToString(time(curr_bar,timeframe_bos)),time(curr_bar,timeframe_bos),low(curr_bar,timeframe_bos),77,clrRed,+1); //--- Draw a marker for the swing low
      }
   }
}
日次価格、つまり日次レンジが既に定義されている場合、BoSの時間枠で新しいバーを監視します。ここではstatic変数isNewBar_bosを用い、iBars関数に_Symbolとtimeframe_bosを渡して現在のバー数を取得し、static変数prevBarsと比較します。新しいバーが形成された場合、isNewBar_bosをtrueにしprevBarsを更新します。
isNewBar_bosがtrueのとき、curr_barにlength=4を設定し、そのバーを中心に左右length本のバーを調べてスイングポイントを判定します。timeframe_bosを指定してhigh関数とlow関数を使い、現在のバーの高値と安値が周囲のバーと比較して最高値または最安値であるかを確認し、そうでなければisSwingHighまたはisSwingLowをfalseに設定します。
isSwingHighの場合は、価格をswing_Hに保存しPrintでログ出力したのち、drawSwingPointを呼び出してTimeToString、バーの時間、価格、矢印コード77、clrBlue、方向-1を渡します。isSwingLowの場合はswing_Lを更新しログを出力、drawSwingPointをclrRed、方向+1で呼び出します。コンパイルすると、次の結果が得られます。
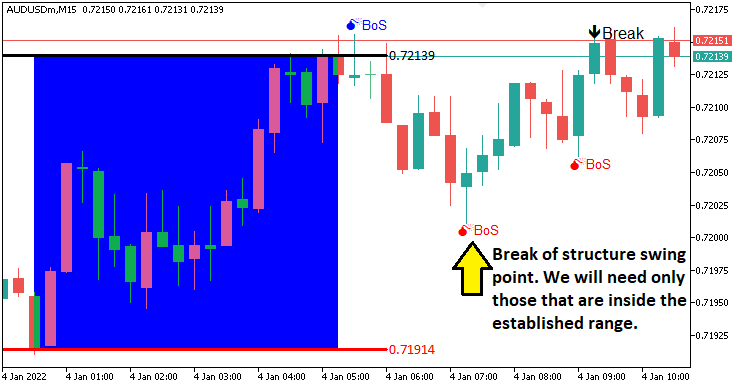
画像からスイングポイントが描画されていることが確認できます。次におこなうべきことは、スイングポイントのブレイク、つまり構造の転換を追跡することです。これがBoSとなります。これを再び可視化するために、以下のようなカスタム関数が必要になります。
//+------------------------------------------------------------------+
//| Function to draw a break level line                              |
//+------------------------------------------------------------------+
void drawBreakLevel(string objName,datetime time1,double price1,
   datetime time2,double price2,color clr,int direction){ //--- Define a function to draw a break level line
   if (ObjectFind(0,objName) < 0){ //--- Check if the break level object does not already exist
      ObjectCreate(0,objName,OBJ_ARROWED_LINE,0,time1,price1,time2,price2); //--- Create an arrowed line object
      ObjectSetInteger(0,objName,OBJPROP_TIME,0,time1);                     //--- Set the first time coordinate of the line
      ObjectSetDouble(0,objName,OBJPROP_PRICE,0,price1);                    //--- Set the first price coordinate of the line
      ObjectSetInteger(0,objName,OBJPROP_TIME,1,time2);                     //--- Set the second time coordinate of the line
      ObjectSetDouble(0,objName,OBJPROP_PRICE,1,price2);                    //--- Set the second price coordinate of the line

      ObjectSetInteger(0,objName,OBJPROP_COLOR,clr); //--- Set the color of the line
      ObjectSetInteger(0,objName,OBJPROP_WIDTH,2);   //--- Set the width of the line

      string text = "Break";                 //--- Define the text label for the break
      string objName_Descr = objName + text; //--- Create a unique name for the text object
      ObjectCreate(0,objName_Descr,OBJ_TEXT,0,time2,price2); //--- Create a text object at the line's end
      ObjectSetInteger(0,objName_Descr,OBJPROP_COLOR,clr);   //--- Set the color of the text
      ObjectSetInteger(0,objName_Descr,OBJPROP_FONTSIZE,10); //--- Set the font size of the text

      if (direction > 0) { //--- Check if the break is upward
         ObjectSetString(0,objName_Descr,OBJPROP_TEXT,text+"  ");             //--- Set the text content
         ObjectSetInteger(0,objName_Descr,OBJPROP_ANCHOR,ANCHOR_RIGHT_UPPER); //--- Set the text anchor to right upper
      }
      if (direction < 0) { //--- Check if the break is downward
         ObjectSetString(0,objName_Descr,OBJPROP_TEXT,text+"  ");             //--- Set the text content
         ObjectSetInteger(0,objName_Descr,OBJPROP_ANCHOR,ANCHOR_RIGHT_LOWER); //--- Set the text anchor to right lower
      }
   }
   ChartRedraw(0); //--- Redraw the chart to display the break level
}
ここではBoSを可視化するためにdrawBreakLevel関数を定義します。以前の可視化関数と同様のロジックを用いているため、細かい説明は省略します。この関数を使ってブレイクレベルをチャート上に表示します。この関数を使用してレベルを可視化します。
double Ask = NormalizeDouble(SymbolInfoDouble(_Symbol,SYMBOL_ASK),_Digits); //--- Get and normalize the current Ask price
double Bid = NormalizeDouble(SymbolInfoDouble(_Symbol,SYMBOL_BID),_Digits); //--- Get and normalize the current Bid price

if (swing_H > 0 && Ask > swing_H){ //--- Check if the Ask price breaks above the swing high
   Print("$$$$$$$$$ BUY SIGNAL NOW. BREAK OF SWING HIGH"); //--- Log a buy signal due to swing high breakout
   int swing_H_index = 0;                //--- Initialize the index of the swing high bar
   for (int i=0; i<=length*2+1000; i++){ //--- Loop through bars to find the swing high
      double high_sel = high(i,timeframe_bos); //--- Get the high price of the i-th bar
      if (high_sel == swing_H){ //--- Check if the high matches the swing high
         swing_H_index = i;     //--- Store the bar index
         Print("BREAK HIGH FOUND @ BAR INDEX ",swing_H_index); //--- Log the swing high bar index
         break;                 //--- Exit the loop once found
      }
   }
   drawBreakLevel(TimeToString(time(0,timeframe_bos)),time(swing_H_index,timeframe_bos),high(swing_H_index,timeframe_bos),
   time(0,timeframe_bos),high(swing_H_index,timeframe_bos),clrBlue,-1); //--- Draw a line to mark the swing high breakout

   if (isTakenTrade == false){                                     //--- Check if no trade is taken yet
      obj_Trade.Buy(0.01,_Symbol,Ask,minimum_price,maximum_price); //--- Execute a buy trade with 0.01 lots, using minimum price as SL and maximum as TP
      isTakenTrade = true;                                         //--- Set the flag to indicate a trade is taken
   }

   swing_H = -1.0; //--- Reset the swing high price
   return;         //--- Exit the OnTick function to avoid further processing
}
if (swing_L > 0 && Bid < swing_L){ //--- Check if the Bid price breaks below the swing low
   Print("$$$$$$$$$ SELL SIGNAL NOW. BREAK OF SWING LOW"); //--- Log a sell signal due to swing low breakout
   int swing_L_index = 0; //--- Initialize the index of the swing low bar
   for (int i=0; i<=length*2+1000; i++){ //--- Loop through bars to find the swing low
      double low_sel = low(i,timeframe_bos); //--- Get the low price of the i-th bar
      if (low_sel == swing_L){ //--- Check if the low matches the swing low
         swing_L_index = i;    //--- Store the bar index
         Print("BREAK LOW FOUND @ BAR INDEX ",swing_L_index); //--- Log the swing low bar index
         break;                //--- Exit the loop once found
      }
   }
   drawBreakLevel(TimeToString(time(0,timeframe_bos)),time(swing_L_index,timeframe_bos),low(swing_L_index,timeframe_bos),
   time(0,timeframe_bos),low(swing_L_index,timeframe_bos),clrRed,+1); //--- Draw a line to mark the swing low breakout

   if (isTakenTrade == false){ //--- Check if no trade is taken yet
      obj_Trade.Sell(0.01,_Symbol,Bid,maximum_price,minimum_price); //--- Execute a sell trade with 0.01 lots, using maximum price as SL and minimum as TP
      isTakenTrade = true;                                          //--- Set the flag to indicate a trade is taken
   }

   swing_L = -1.0; //--- Reset the swing low price
   return;         //--- Exit the OnTick function to avoid further processing
}
有効なブレイクアウトが発生した際の取引実行ロジックを実装します。まずSymbolInfoDouble関数とNormalizeDouble関数を使い、_Symbolと_Digitsを指定して正規化されたAsk価格とBid価格を取得します。
swing_Hが正の値でかつAskがswing_Hを上回った場合、Printでログを出力し、high関数とtimeframe_bosを使ってスイングハイのインデックスを特定します。TimeToString関数とtimeを使ってdrawBreakLevelでマーキングし、isTakenTradeがfalseならobj_Trade.Buyを0.01ロットで呼び出し、ストップロスはminimum_price、テイクプロフィットはmaximum_priceに設定します。取引実行後はisTakenTradeをtrueにし、swing_Hをリセットします。
一方、swing_Lが正の値でBidがswing_Lを下回った場合はログを出し、low関数でスイングローのインデックスを探しdrawBreakLevelでマークした後、obj_Trade.Sellを呼び出し、swing_Lをリセットします。取引を実行したあとは正確なBoS取引をおこなうためにreturnで処理を終了します。以下はその結果です。
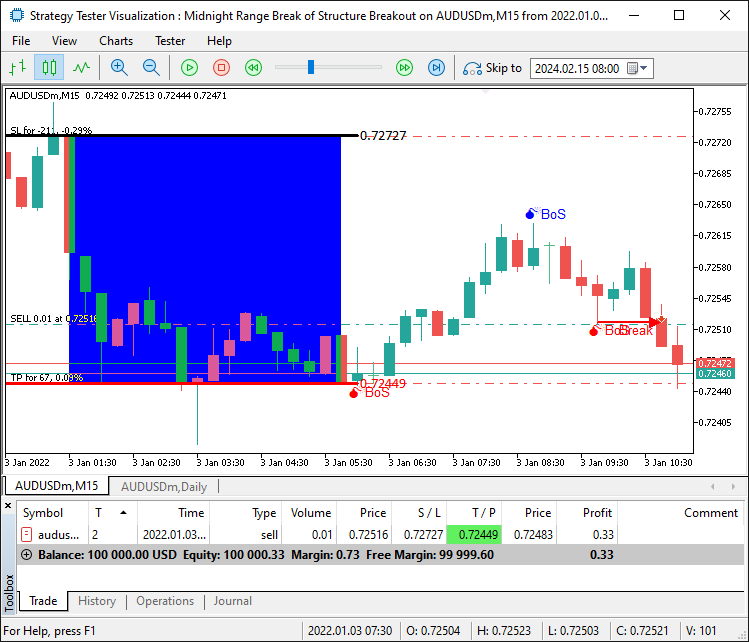
これで確定したセットアップに対して取引をおこなうことができるようになりました。しかし、レンジ外でのブレイクアウトが発生した場合はどうでしょうか。つまり、価格がレンジの上限または下限からさらに上昇または下降した場合です。この場合、価格が再びレンジ内に戻るまで待ち、戻ったときにのみそのブレイクを有効と見なす必要があります。これを実現するには、最大および最小の範囲価格を取得し、それらを追加してより厳格な制限を設け、誤ったシグナルを回避する必要があります。
if (swing_H > 0 && Ask > swing_H && swing_H <= maximum_price && swing_H >= minimum_price){ //--- Check if the Ask price breaks above the swing high within the range
   Print("$$$$$$$$$ BUY SIGNAL NOW. BREAK OF SWING HIGH WITHIN RANGE"); //--- Log a buy signal due to swing high breakout
   int swing_H_index = 0;                                               //--- Initialize the index of the swing high bar
   for (int i=0; i<=length*2+1000; i++){                                //--- Loop through bars to find the swing high
      double high_sel = high(i,timeframe_bos); //--- Get the high price of the i-th bar
      if (high_sel == swing_H){                //--- Check if the high matches the swing high
         swing_H_index = i; //--- Store the bar index
         Print("BREAK HIGH FOUND @ BAR INDEX ",swing_H_index); //--- Log the swing high bar index
         break;             //--- Exit the loop once found
      }
   }
   drawBreakLevel(TimeToString(time(0,timeframe_bos)),time(swing_H_index,timeframe_bos),high(swing_H_index,timeframe_bos),
   time(0,timeframe_bos),high(swing_H_index,timeframe_bos),clrBlue,-1); //--- Draw a line to mark the swing high breakout

   if (isTakenTrade == false){ //--- Check if no trade is taken yet
      obj_Trade.Buy(0.01,_Symbol,Ask,minimum_price,maximum_price); //--- Execute a buy trade with 0.01 lots, using minimum price as SL and maximum as TP
      isTakenTrade = true;                                         //--- Set the flag to indicate a trade is taken
   }

   swing_H = -1.0; //--- Reset the swing high price
   return;         //--- Exit the OnTick function to avoid further processing
}
if (swing_L > 0 && Bid < swing_L && swing_L <= maximum_price && swing_L >= minimum_price){ //--- Check if the Bid price breaks below the swing low within the range
   Print("$$$$$$$$$ SELL SIGNAL NOW. BREAK OF SWING LOW WITHIN RANGE"); //--- Log a sell signal due to swing low breakout
   int swing_L_index = 0;                //--- Initialize the index of the swing low bar
   for (int i=0; i<=length*2+1000; i++){ //--- Loop through bars to find the swing low
      double low_sel = low(i,timeframe_bos); //--- Get the low price of the i-th bar
      if (low_sel == swing_L){ //--- Check if the low matches the swing low
         swing_L_index = i;    //--- Store the bar index
         Print("BREAK LOW FOUND @ BAR INDEX ",swing_L_index); //--- Log the swing low bar index
         break;                //--- Exit the loop once found
      }
   }
   drawBreakLevel(TimeToString(time(0,timeframe_bos)),time(swing_L_index,timeframe_bos),low(swing_L_index,timeframe_bos),
   time(0,timeframe_bos),low(swing_L_index,timeframe_bos),clrRed,+1); //--- Draw a line to mark the swing low breakout

   if (isTakenTrade == false){ //--- Check if no trade is taken yet
      obj_Trade.Sell(0.01,_Symbol,Bid,maximum_price,minimum_price); //--- Execute a sell trade with 0.01 lots, using maximum price as SL and maximum as TP
      isTakenTrade = true;                                          //--- Set the flag to indicate a trade is taken
   }

   swing_L = -1.0; //--- Reset the swing low price
   return;         //--- Exit the OnTick function to avoid further processing
}
誤ったシグナルを除外できていることは問題なく、確定したセットアップに対して取引をおこなうことができることも確認できました。これにより、戦略のセットアップを識別し視覚化し、実際に取引をおこなうという目的を達成しています。残っている作業は、このプログラムのバックテストをおこなうことです。バックテストについては次のセクションで扱います。
バックテスト
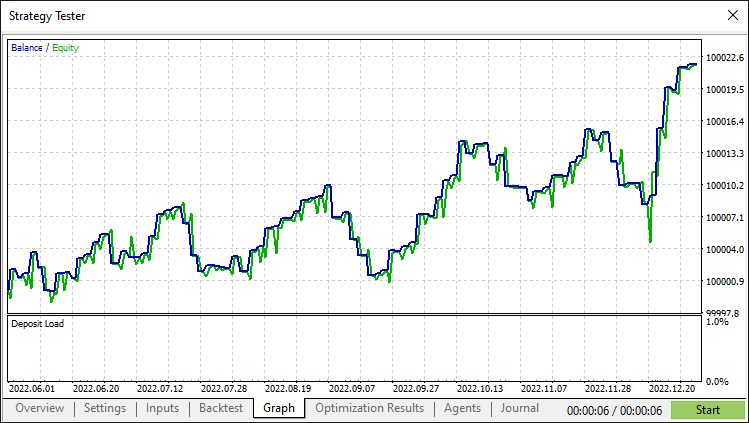
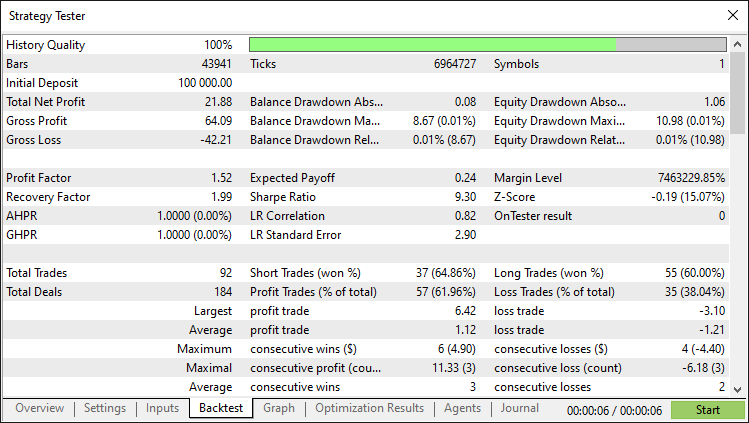
徹底的なバックテストの結果、次の結果が得られました。
バックテストグラフ
バックテストレポート
結論
結論として、私たちはミッドナイトレンジブレイクアウト+Break of Structure (BoS)の戦略を自動化するMQL5 EAを構築しました。このEAは当日のスイングポイントで確認された深夜のレンジ内のブレイクアウトを取引します。正確なレンジ検出と視覚化により、さらに発展させて独自の取引スタイルに合わせた複数の戦略を定義することも可能です。
免責条項:本記事は教育目的のみを意図したものです。取引は大きな財務リスクを伴い、市場のボラティリティにより損失が発生する可能性があります。ライブ取引でこのEAを使用する前には、十分なバックテストと慎重なリスク管理が不可欠です。
これらの技術を習得することでアルゴリズムトレードのスキルを向上させ、市場に対してより自信を持って臨むことができるでしょう。取引の成功をお祈りします。
MetaQuotes Ltdにより英語から翻訳されました。
元の記事: https://www.mql5.com/en/articles/17876
警告: これらの資料についてのすべての権利はMetaQuotes Ltd.が保有しています。これらの資料の全部または一部の複製や再プリントは禁じられています。
この記事はサイトのユーザーによって執筆されたものであり、著者の個人的な見解を反映しています。MetaQuotes Ltdは、提示された情報の正確性や、記載されているソリューション、戦略、または推奨事項の使用によって生じたいかなる結果についても責任を負いません。
 取引チャート上で双三次補間を用いたリソース駆動型画像スケーリングによる動的MQL5グラフィカルインターフェイスの作成
 データサイエンスとML(第37回):ローソク足パターンとAIを活用して市場をリードする
 Metatrader 5のWebsockets — Windows APIを使用した非同期クライアント接続
 MQL5での取引戦略の自動化(第15回):プライスアクションハーモニックCypherパターンの可視化
- 無料取引アプリ
- 8千を超えるシグナルをコピー
- 金融ニュースで金融マーケットを探索
アラン、こんにちは。
あなたのシステムをダウンロードしてテストを始めようと思っています。 興味深いことに、ストラテジー・テスター・レポートには 取引ペアも時間枠も明記されていません。 あなたがAUSD M15を図解しているので、私はあなたが使用したものだと思い、それでテストを始めようと思っています。 他のペアや時間枠を使用した場合の感触はありますか? 私は、このEAはアジアの取引ペアでよりよく機能するのではないかと思っていますが、正しいでしょうか?
CapeCoddahさん、ありがとうございます。
AUDUSD、AUDJPY、USDJPYを試しましたが、すべてシャープレシオが-3.00から-5.00で損失を出しました。USDJPY以外はすぐにマイナスになり、回復することはありませんでした。 USDJPYは2回プラスになった時期がありましたが、結局マイナスになり、戻ることはありませんでした。
アディオス
素晴らしい仕事だ。ありがとう、アラン!
もちろん。親切なフィードバックをありがとう。
アラン、 ありがとう。