
创建一个基于日波动区间突破策略的 MQL5 EA
引言
在本文中,我们将探索如何在MetaQuotes Language 5(MQL5)中创建一个基于日波动区间突破策略的EA。随着交易者不断寻找有效的自动化交易解决方案,日波动区间突破策略为外汇交易者提供了一种系统化的方法,能够利用价格突破特定范围后的波动,使其成为MetaTrader 5中极具吸引力的选择。
我们将首先概述日波动区间突破策略的基本原理,为其在自动化交易中的实现奠定坚实基础。接下来,我们将深入探讨识别突破条件以及建立入场和出场点的具体细节。随后,我们将引导您完成在 MQL5 中的编码过程,重点介绍推动该策略的核心函数和逻辑。此外,我们还将讨论回测和优化程序的重要性,以确保其在交易条件下的有效性。本文将涵盖的主题包括:
- 理解日波动区间突破策略
- EA的设计方案
- 在 MQL5 中实现日波动区间突破策略
- 回测与优化
- 结论
到本文结束时,您将掌握开发能够有效利用日波动区间突破策略的 MQL5 EA的知识,从而提升您的交易能力。让我们开始吧。
理解日波动区间突破策略
日波动区间突破策略是外汇交易者中广为人知的交易方法。它使交易者能够利用市场在形成日波动区间后,发生大幅价格波动的情形。该策略利用市场的价格行为来确定重要的支撑和阻力水平。一旦交易者知晓这些位置水平,他们就会交易这些位置的突破,寻找市场在突破这些位置后发生的大范围波动行情。
该策略以日波动范围为中心,该范围被定义为一个交易日内货币对的最高价和最低价之间的差异。突破点是从前一个交易日的波动范围推断出来的。当价格突破已建立的阻力水平或跌破支撑水平时,就会发生突破。回顾过去,前一天的价格似乎很好地定义了可以用作潜在突破点的水平。当价格向上突破阻力水平时,建立多头头寸。当价格向下突破支撑水平时,建立空头头寸。以下是对此的说明。
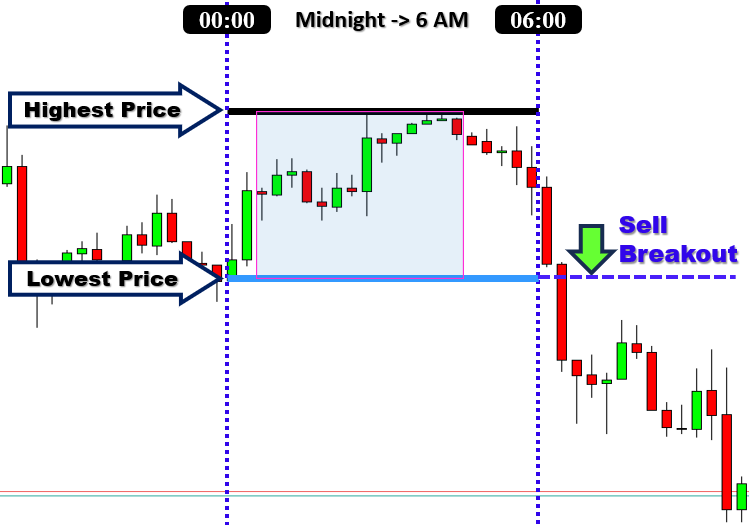
为了最大限度地提高效果,该策略通常应用于 1 小时或 4 小时图表。当交易者在这些时间框架上使用该模板时,他们通常可以捕捉到更大、更显著的价格波动。这是因为该策略主要避免了短时间框架中存在的噪声。突破策略通常利用亚洲时段的价格行为来确定日波动范围,然后在伦敦和纽约时段执行交易。突破策略通常存在假信号的问题,日波动区间突破也不例外。因此,与任何交易策略一样,使用日波动区间突破时管理风险至关重要。将止损订单放置在多头头寸的最后一个波动低点下方,以及空头交易的最后一个波动高点上方,以保持合理的风险。这就是我们的策略。通过在最后一个波动高点或低点上方或下方放置止损订单来管理风险。以下是止损逻辑的再次说明。
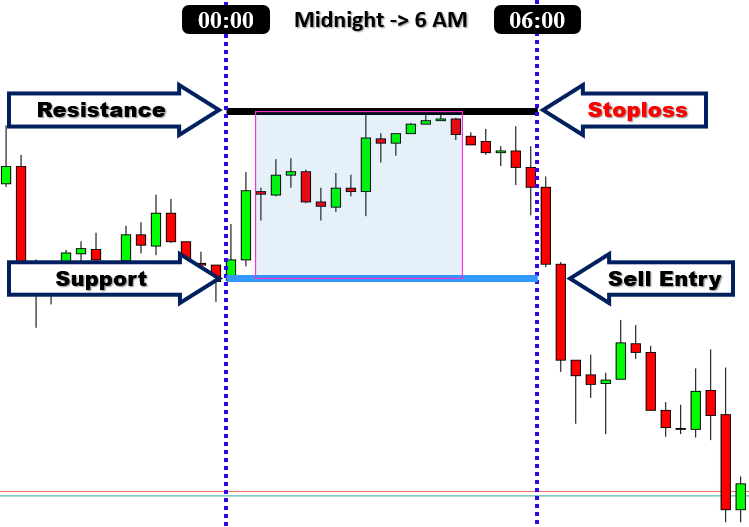
日波动区间突破策略在多个方面具有优势。首先,其简单性使其成为初学者和经验丰富的交易者都合适的选择。其次,它采用确定的价格水平,避免了交易者做出过多的主观决策。这种交易日区间突破的方式,使得每日交易时段之前和之后都能清晰地展现市场情况。在早上,市场的交易活动可以被划分为一个特定的“范围”。然后,在早盘交易结束后,“突破”范围的上界或下界成为第二天进入交易的可能信号。我们将在下一节中通过提供一个包含所有具体细节的清晰方案,进一步定义我们的交易参数。
EA的设计方案
突破上边界:买入条件
当价格突破前一天建立的区间上界时,这表明看涨突破,并暗示市场可能会继续上涨。这种突破表明有强烈的买入兴趣,并且有进一步上涨的潜力。当前一根K线收盘价高于区间上界水平时,我们开仓买入,旨在从这种突破后通常会跟随的动能中获利。
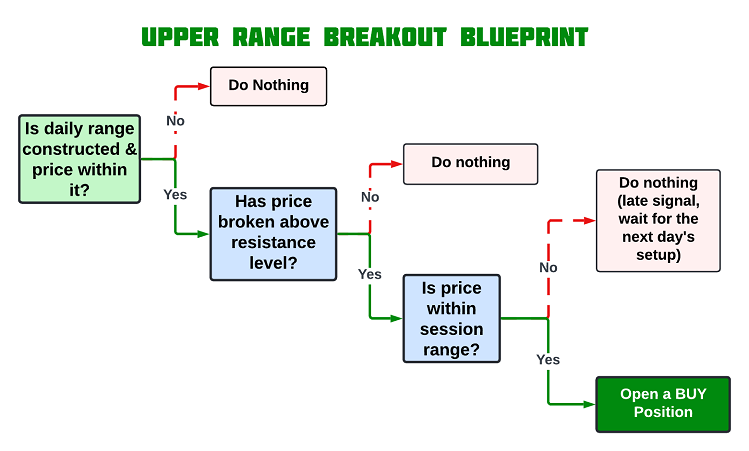
突破下边界:卖出条件
相反,当价格跌破前一天建立的区间下界时,这表明看跌突破,并暗示市场可能会继续下跌。这种突破表明有强烈的卖出压力,并且有进一步下跌的潜力。当前一根K线收盘价低于区间下界水平时,我们开仓卖出,预期突破后价格会继续走弱。
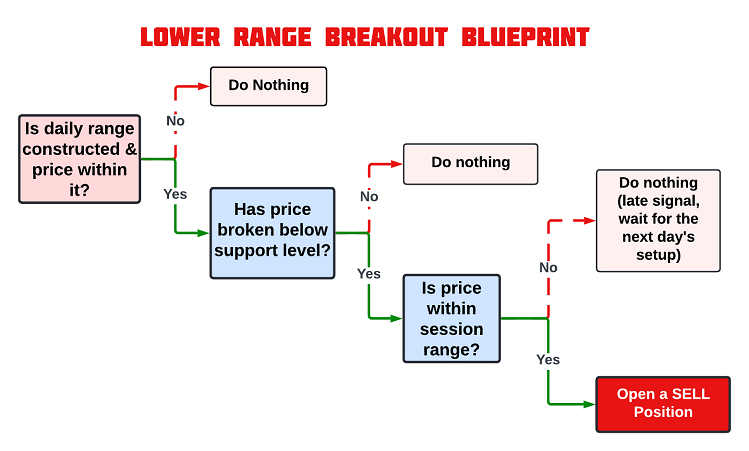
这些策略的图形化表达,对我们在MQL5中实现这些交易条件时非常有帮助,可作为编写精确入场和出场规则的代码的参考。
在 MQL5 中实现日波动区间突破策略
在学习了关于日波动区间突破策略的所有理论之后,让我们将这些理论程序化,并在MetaQuotes Language 5(MQL5)中为MetaTrader 5创建一个 EA。
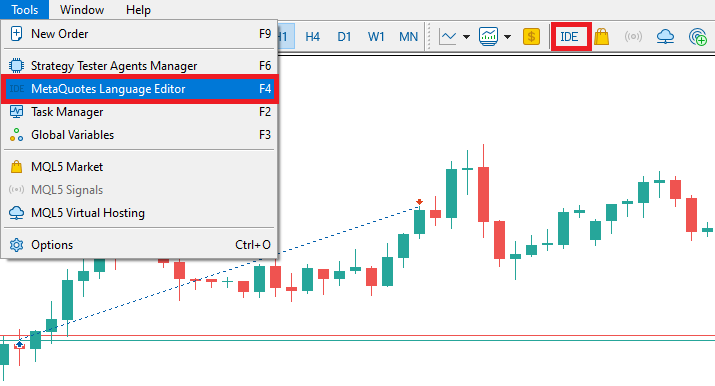
要在MetaTrader 5终端中创建EA,请点击“工具”选项卡并选择“MetaQuotes语言编辑器”,或者简单地在键盘上按F4键。另外,您还可以点击工具栏上的IDE(集成开发环境)图标。这将打开MetaQuotes语言编辑器环境,允许您编写EA、技术指标、脚本和函数库。
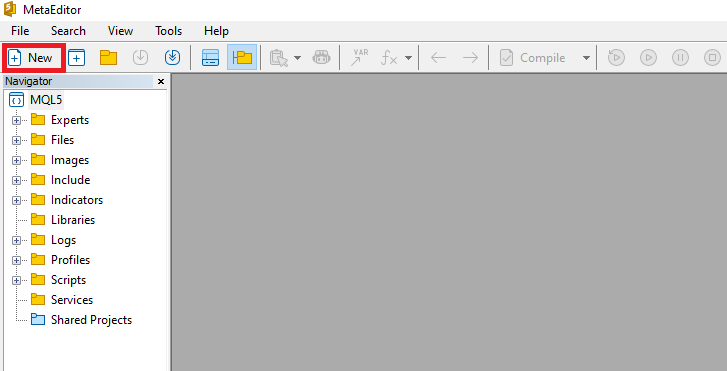
一旦MetaEditor被打开,在工具栏上,导航到“文件”选项卡并选择“新建文件”,或者简单地按CTRL + N,来创建一个新文档。另外,您也可以点击工具栏上的“新建”图标。这将弹出一个MQL向导(MQL Wizard)窗口。
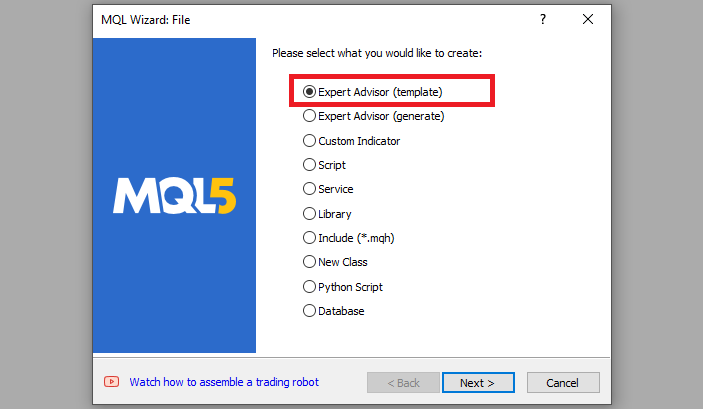
在弹出的向导中,选择“Expert Advisor (template) ”并点击“下一步”。
在EA的一般属性中,在名称部分,输入您的EA文件的名称。请注意,如果要指定或创建一个不存在的文件夹,您需要在EA名称前使用反斜杠。例如,这里我们默认有“Experts\”。这意味着我们的EA将被创建在Experts文件夹中,我们可以在那里找到它。其他部分都很容易理解,您也可以按照向导底部的链接去详细了解这一过程。
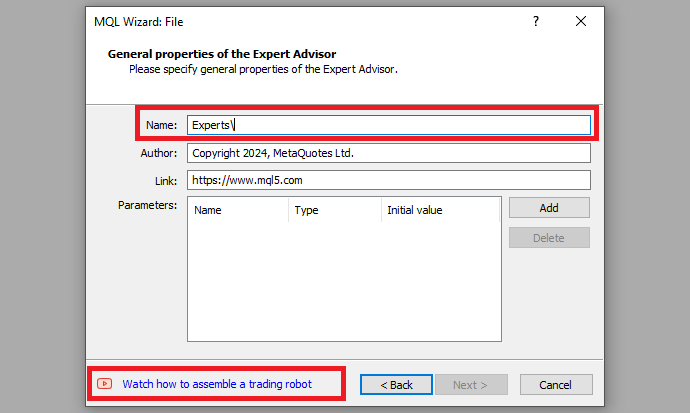
在提供了您想要的EA文件名后,点击“下一步”,再点击“下一步”,然后点击“完成”。 完成这些步骤后,我们现在就可以开始编写和规划我们的策略了。
首先我们从定义EA的基础数据开始。这包括EA的名称、版本信息和MetaQuotes的网站链接。我们还将指定EA的版本号,设置为“1.00”。
//+------------------------------------------------------------------+
//|                          Daily Range Breakout Expert Advisor.mq5 |
//|      Copyright 2024, ALLAN MUNENE MUTIIRIA. #@Forex Algo-Trader. |
//|                                     https://forexalg0-trader.com |
//+------------------------------------------------------------------+
#property copyright "Copyright 2024, ALLAN MUNENE MUTIIRIA. #@Forex Algo-Trader"
#property link      "https://forexalg0-trader.com"
#property description "Daily Range Breakout Expert Advisor"
#property version   "1.00"
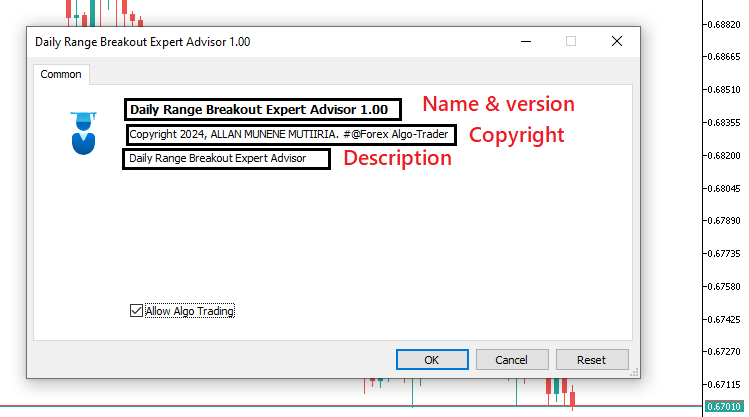
在加载程序时,会呈现出与下图类似的信息。
首先,我们在源代码的开头使用#include包含一个交易实例。这使我们能够访问CTrade类,我们将使用该类来创建一个交易对象。这非常关键,因为我们需要它来执行交易。
#include <Trade/Trade.mqh>
CTrade obj_Trade;
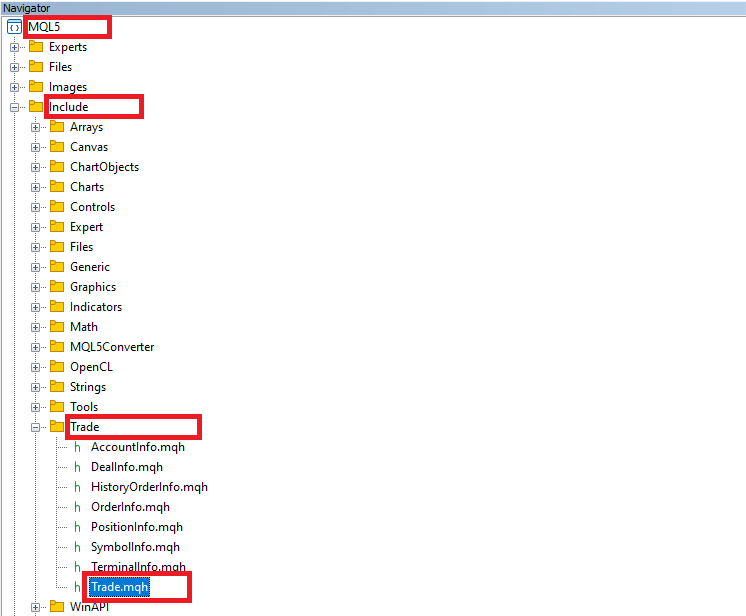
预处理器会用文件Trade.mqh的内容替换#include <Trade/Trade.mqh>这一行。尖括号表示Trade.mqh文件将从标准目录(通常是terminal_installation_directory\MQL5\Include)中获取。当前目录不会包含在搜索路径中。这行代码可以放在程序的任何位置,但通常,为了代码结构更好和引用更方便,所有的包含指令都放在源代码的开头。声明CTrade类的obj_Trade对象将使我们能够轻松访问该类中包含的方法,这得益于MQL5开发者的设计。
此后,我们需要声明一些重要的变量来存储和追踪区间突破的数据。
double maximum_price = -DBL_MAX;      //--- Initialize the maximum price with the smallest possible value
double minimum_price = DBL_MAX;       //--- Initialize the minimum price with the largest possible value
datetime maximum_time, minimum_time;  //--- Declare variables to store the time of the highest and lowest prices
bool isHaveDailyRange_Prices = false; //--- Boolean flag to check if daily range prices are extracted
bool isHaveRangeBreak = false;        //--- Boolean flag to check if a range breakout has occurred
在这里,我们声明几个重要的变量,用于跟踪关键价格数据,并在交易逻辑中处理区间突破。首先,我们初始化两个double变量,“maximum_price”和“minimum_price”,它们将用于存储在特定期间内找到的最高价和最低价。“maximum_price”被设置为-DBL_MAX,这是可能的最小双精度值,确保任何遇到的价格都会更高并替换这个初始值。同样,我们将“minimum_price”设置为DBL_MAX,这是可能的最大双精度值,确保任何更低的价格都会替换它作为最小值。
我们还声明了两个datetime变量,“maximum_time”和“minimum_time”,用于存储最高价和最低价发生的确切时间。如果我们需要引用这些价格水平达到的具体时刻,那么会用到这些变量。
此外,还声明了两个bool变量,用于处理与价格范围和突破相关的逻辑。第一个,“isHaveDailyRange_Prices”,初始化为 false,用作标记区间价格(即最高价和最低价)是否被成功确定。第二个,“isHaveRangeBreak”,也初始化为 false,用作标记是否发生了突破,即价格已超出日波动区间。此外,我们将在图表中直观地呈现区间。因此,我们需要为区间命名,也可以在这里声明它们。
#define RECTANGLE_PREFIX "RANGE RECTANGLE " //--- Prefix for naming range rectangles
#define UPPER_LINE_PREFIX "UPPER LINE "     //--- Prefix for naming upper range line
#define LOWER_LINE_PREFIX "LOWER LINE "     //--- Prefix for naming lower range line
在这里,我们定义了三个预处理器指令,用于为与交易区间相关的各种图形对象创建前缀。我们使用指令#define RECTANGLE_PREFIX "RANGE RECTANGLE ",为表示交易区间的矩形建立一致的命名约定,便于在图表中识别和管理这些对象。同样,#define UPPER_LINE_PREFIX "UPPER LINE " 为区间的上边界线创建了一个特定的前缀,而 LOWER_LINE_PREFIX "LOWER LINE " 则为下边界线服务。通过使用这些前缀,我们确保所有与区间相关的图形对象都被系统地命名,这有助于在代码中保持清晰和组织性,尤其是在图表中可能存在多个对象时。
从这里开始,我们可以进入实际的代码处理程序。我们的代码应用于每个价格变动,并直接进入OnTick事件处理程序,该程序在每一次价格变动时都会被调用和执行。
//+------------------------------------------------------------------+
//| Expert tick function                                             |
//+------------------------------------------------------------------+
void OnTick(){
//---

}
这只是一个默认的价格变动事件处理程序,我们将用它来构建我们的控制逻辑。接下来,我们需要声明一些变量来保存我们的时间区间。
   static datetime midnight = iTime(_Symbol,PERIOD_D1,0);  //--- Get the time of midnight (start of the day) for daily chart
   static datetime sixAM = midnight + 6 * 3600;            //--- Calculate 6 AM based on midnight time
   static datetime scanBarTime = sixAM + 1 * PeriodSeconds(_Period); //--- Set scan time for the next bar after 6 AM
我们声明了三个static变量来管理与时间相关的功能。第一个变量,“midnight”,被赋值为iTime函数返回的值,该函数检索当前交易品种(由_Symbol表示)的日线图的午夜时间,周期设置为PERIOD_D1,表示我们处理的是日K线。0 代表当前K线。这为每天的计算建立了一个参考基准点。
接下来,我们通过将6小时(表示为6 * 3600,其中3600是一小时的秒数,即1小时乘以60分钟乘以60秒)加到“midnight”变量上,计算“sixAM”的时间。这使我们能够在市场开盘后指定一个时间,便于我们从交易日的早期开始分析价格行为。
最后,我们建立“scanBarTime”变量,以指示“sixAM”之后下一根K线的扫描时间。我们通过动态地在当前上午6点的K线上增加一根额外的K线来实现这一点,以便将其也纳入检测范围。1表示要跳过的K线数量,而PeriodSeconds函数会自动将当前图表周期转换为秒。例如,我们可能有一个1小时图表,这意味着我们将1小时转换为秒,并将秒数乘以1根K线,通常会得到3600秒,然后将其加到上午6点,得到上午7点的K线。总体而言,这些静态变量对于在交易策略中实现基于时间的逻辑至关重要。
接下来,我们还可以声明变量来定义时间内有效突破区间,如果突破发生在7小时后或特定时间(如下午1点)之后,我们不认为任何信号有效,因此我们等待第二天的设置。
   static datetime validBreakTime_start = scanBarTime;     //--- Set the start of valid breakout time
   static datetime validBreakTime_end = midnight + (6+5) * 3600; //--- Set the end of valid breakout time to 11 AM
在这里,我们声明了两个额外的static变量,用于定义交易策略中有效突破条件的时间窗口。第一个变量,“validBreakTime_start”,被初始化为“scanBarTime”的值,这是我们之前建立的。这设定了我们有效突破时间的开始,使我们能够从上午6点后的下一根K线开始关注价格行为。
第二个变量,“validBreakTime_end”,是通过将(6 + 5) * 3600加到“midnight”变量上计算得出的。这个表达式指定了我们有效突破期的结束时间,对应于上午11点。通过建立这个时间框架,我们创建了一个清晰的窗口,在此期间我们将评估突破条件,确保我们的交易决策基于在此定义范围内发生的价格波动。在完成所有这些之后,我们就可以开始我们的逻辑了。首先需要考虑的是,我们希望每天检查设置,因此,需要一个逻辑来识别新的一天。
   if (isNewDay()){
        //---

   }
我们使用一个 if 语句来检查是否是新的一天,如果是,就执行其中的代码片段。我们用返回类型为bool值的"isNewDay"函数来检查是否是新的一天。代码逻辑如下:
bool isNewDay() {
   //--- Flag to indicate if a new day has started
   bool newDay = false;

   //--- Structure to hold the current date and time
   MqlDateTime Str_DateTime;

   //--- Convert the current time to a structured format
   TimeToStruct(TimeCurrent(), Str_DateTime);

   //--- Static variable to store the previous day
   static int prevDay = 0;

   //--- Get the current day from the structured time
   int currDay = Str_DateTime.day;

   //--- If the previous day is the same as the current day, we're still on the same day
   if (prevDay == currDay) {
      newDay = false;
   }
   //--- If the current day differs from the previous one, we have a new day
   else if (prevDay != currDay) {
      //--- Print a message indicating the new day
      Print("WE HAVE A NEW DAY WITH DATE ", currDay);

      //--- Update the previous day to the current day
      prevDay = currDay;

      //--- Set the flag to true, indicating a new day has started
      newDay = true;
   }

   //--- Return whether a new day has started
   return (newDay);
}
在这里,我们定义了布尔函数“isNewDay”,该函数负责确定在我们的交易策略中新的一天是否已经开始。我们初始化一个布尔变量“newDay”为“false”,用作标志以指示是否已经开始新的一天。为了跟踪当前日期和时间,我们创建了一个类型为MqlDateTime的结构体,名为“Str_DateTime”。我们使用TimeToStruct函数将从当前时间获取的当前时间转换为结构化格式,将相关的日期和时间信息填充到“Str_DateTime”结构体中。
接下来,我们声明一个静态整数变量“prevDay”,初始化为零,用于存储最后记录的日期的天数。然后,我们从“Str_DateTime”结构体中检索当前天数,并将其赋值给整数变量“currDay”。
我们比较“prevDay”和“currDay”。如果它们相等,这意味着仍然处于同一天内,我们将“newDay”设置为“false”。相反,如果“prevDay”与“currDay”不同,我们认识到新的一天已经开始。在这种情况下,我们使用Print函数打印一条消息,指示已过渡到新的一天,并将“prevDay”变量更新为“currDay”的值。然后,我们将“newDay”标志设置为“true”,确认新的一天已经开始。最后,该函数返回“newDay”标志的值,允许我们在交易逻辑中使用这些信息,以确定是否需要根据新的一天的开始采取任何行动。
现在,正是在这个函数中,当新的一天开始时,我们重置一切,以便进行当天的计算和控制逻辑映射,如下所示。
      //--- Reset values for the new day
      midnight = iTime(_Symbol,PERIOD_D1,0);    //--- Get the new midnight time
      sixAM = midnight + 6 * 3600;              //--- Recalculate 6 AM
      scanBarTime = sixAM + 1 * PeriodSeconds(_Period); //--- Recalculate the scan bar time

      validBreakTime_start = scanBarTime;       //--- Update valid breakout start time
      validBreakTime_end = midnight + (6+5) * 3600; //--- Update valid breakout end time to 11 AM

      maximum_price = -DBL_MAX;                 //--- Reset the maximum price for the new day
      minimum_price = DBL_MAX;                  //--- Reset the minimum price for the new day

      isHaveDailyRange_Prices = false;          //--- Reset the daily range flag for the new day
      isHaveRangeBreak = false;                 //--- Reset the breakout flag for the new day
在该函数中,我们在新的一天开始时重置各种变量和参数,以便为新的计算和数据跟踪做好准备。我们首先通过使用函数iTime获取当前日的午夜时间戳,该函数提供当前日线柱的起始时间戳。然后,我们将变量“midnight”更新为这个新的值。
接下来,我们通过将“6 * 3600”(表示6小时)加到新设置的“midnight”变量上,重新计算上午6点的时间。这为我们提供了一个参考点,用于确定早晨交易时段的开始。随后,我们通过将通过PeriodSeconds函数获得的一个周期的持续时间加到上午6点,将“scanBarTime”设置为上午6点后的下一根K线,确保我们的计算与当前图表周期对齐。
然后,我们通过将“validBreakTime_start”设置为新计算的“scanBarTime”,更新有效突破时间窗口。这一调整表明了在交易日中考虑潜在突破的起始点。我们还将“validBreakTime_end”设置为上午11点,通过计算“midnight + (6 + 5) * 3600”来确保我们有一个清晰的突破评估终点。此外,我们重置“maximum_price”和“minimum_price”的值,以便为新的一天跟踪价格走势,将“maximum_price”初始化为-DBL_MAX(可能的最低值),将“minimum_price”初始化为DBL_MAX(可能的最高值)。这一重置使我们能够准确地捕捉一整天内的最高价和最低价。
最后,我们将布尔标志“isHaveDailyRange_Prices”和“isHaveRangeBreak”设置为“false”,表明我们尚未为新的一天确定日波动区间或识别区间突破。这一完整的重置使我们的系统为新的计算做好准备,确保我们能够准确地监控当日的价格走势。现在我们可以进入K线扫描逻辑。我们不需要在每一价格变动上进行扫描,而只需要在生成新的K线时进行扫描。因此,我们需要另一个控制逻辑来处理新K线的识别。
   if (isNewBar()){
        //---

   }
在这里,我们仍然使用if语句,结合“isNewBar”函数来实现新K线生成的逻辑。该函数的代码如下代码片段所示。
bool isNewBar() {
   //--- Static variable to hold the previous number of bars
   static int prevBars = 0;

   //--- Get the current number of bars on the chart
   int currBars = iBars(_Symbol, _Period);

   //--- If the number of bars hasn't changed, return false
   if (prevBars == currBars) return (false);

   //--- Update the previous bar count with the current one
   prevBars = currBars;

   //--- Return true if a new bar has been formed
   return (true);
}
我们首先声明一个名为“prevBars”的静态变量,用于存储图表上显示的前一根K线的数量。静态关键字确保该变量在函数调用之间保留其值,从而能够有效地跟踪K线数量的变化。接下来,我们使用iBars函数获取图表上的当前K线数量,其中_Symbol表示交易品种,_Period表示图表的时间框架。该函数返回指定品种和周期当前可用的K线总数。
然后,我们将存储在变量“currBars”中的当前K线数量与“prevBars”中的前一根K线数量进行比较。如果这两个值相等,表明自上次检查以来没有形成新的K线,因此我们返回“false”,表示我们仍然处于同一根K线上。如果数量不同,意味着已经创建了一根新的K线,这促使我们将“prevBars”更新为“currBars”的值。最后,我们返回“true”,以表明确实形成了一根新的K线。接下来,在函数内部,我们需要在形成新的K线时处理数据,特别关注提取价格数据的特定时间条件。
      //--- If a new bar has been formed, process the data
      datetime currentBarTime = iTime(_Symbol,_Period,0); //--- Get the time of the current bar

      if (currentBarTime == scanBarTime && !isHaveDailyRange_Prices){
         //--- If it's time to scan and the daily range is not yet extracted
         Print("WE HAVE ENOUGH BARS DATA FOR DOCUMENTATION. MAKE THE EXTRACTION"); //--- Log the extraction process
         int total_bars = int((sixAM - midnight)/PeriodSeconds(_Period)) + 1; //--- Calculate total bars between midnight and 6 AM
         Print("Total Bars for scan = ",total_bars); //--- Log the total number of bars for scanning
         int highest_price_bar_index = -1;   //--- Variable to store the bar index of the highest price
         int lowest_price_bar_index = -1;    //--- Variable to store the bar index of the lowest price

         //---

      }
首先,我们使用iTime函数声明一个变量“currentBarTime”,该函数检索图表上当前K线的时间。这有助于我们确定是否处于一天中的某个特定时间点,以便处理某些价格数据。接下来,我们在if语句中检查两个条件。首先,我们验证当前K线的时间是否与扫描K线的时间匹配,这是我们计划分析的时间(在本例中,设置为上午6点)。其次,通过验证标志“isHaveDailyRange_Prices”是否为false,来检查是否尚未提取日波动区间价格。如果这两个条件都为真,这意味着我们处于正确的时间点,并且需要提取价格范围数据。
我们使用Print函数记录一条消息,表明有足够的K线数据可供使用,并且提取过程即将开始。这有助于在执行过程中跟踪触发该过程的时间和原因。我们继续计算午夜到上午6点之间的总K线数量,这对于确定该期间的价格范围至关重要。PeriodSeconds函数给出了每根K线的时间持续长度,我们将“sixAM”和“midnight”之间的时间差除以这个持续长度,以计算总K线数量。我们加1以确保包括该范围内的所有K线。
最后,我们使用另一个Print函数打印用于扫描的总K线数量,并声明两个变量:“highest_price_bar_index”和“lowest_price_bar_index”。我们将这些变量初始化为-1,并将它们用于存储包含最高价和最低价的K线索引,分别在观察范围内。这一设置使我们能够从这些特定的K线中提取价格数据。当运行程序时,我们得到了以下结果。
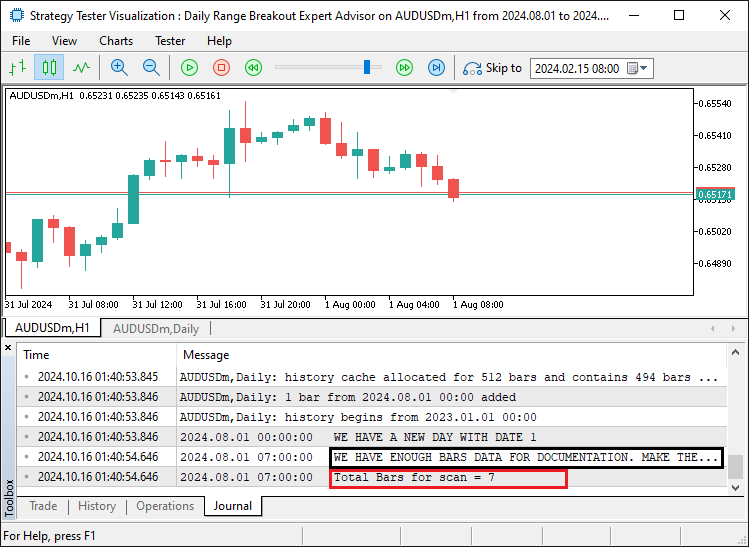
我们可以看到,一旦确定了用于判断区间所需的K线数量,我们就会通知完成状态以及相应区间内的K线数量。此时,我们可以继续从已识别的日区间内提取数据,并建立区间边界。
         for (int i=1; i<=total_bars ; i++){ //--- Loop through all bars within the defined time range
            double open_i = open(i);         //--- Get the opening price of the i-th bar
            double close_i = close(i);       //--- Get the closing price of the i-th bar

            double highest_price_i = (open_i > close_i) ? open_i : close_i; //--- Determine the highest price between open and close
            double lowest_price_i = (open_i < close_i) ? open_i : close_i;  //--- Determine the lowest price between open and close

            if (highest_price_i > maximum_price){
               //--- If the current highest price is greater than the recorded maximum price
               maximum_price = highest_price_i; //--- Update the maximum price
               highest_price_bar_index = i;     //--- Update the index of the highest price bar
               maximum_time = time(i);          //--- Update the time of the highest price
            }
            if (lowest_price_i < minimum_price){
               //--- If the current lowest price is lower than the recorded minimum price
               minimum_price = lowest_price_i;  //--- Update the minimum price
               lowest_price_bar_index = i;      //--- Update the index of the lowest price bar
               minimum_time = time(i);          //--- Update the time of the lowest price
            }
         }
为了提取数据,我们遍历特定时间范围(从午夜到上午6点)内的所有K线,以确定最高价和最低价。目标是在这个区间内找到出现的最高价和最低价,并记录它们发生的时间。我们首先设置一个for循环,语句为“for (int i=1; i<=total_bars ; i++)”。这个语句意味着循环将遍历每一根K线,从第一根(索引1)开始,一直到“total_bars”,这个值之前已经计算过,表示午夜到上午6点之间的K线数量。变量“i”表示循环中每根K线的索引。
在循环内部,我们使用自定义函数“open”和“close”分别检索每根K线的开盘价和收盘价。这两个变量——“open_i”用于开盘价,“close_i”用于收盘价——帮助我们分析每根K线的价格走势。在进一步进行之前,这些自定义函数只是我们在全局范围内定义的工具函数,直接使用它们,其代码片段如下。
//--- Utility functions to retrieve price and time data for a given bar index
double open(int index){return (iOpen(_Symbol,_Period,index));}   //--- Get the opening price
double high(int index){return (iHigh(_Symbol,_Period,index));}   //--- Get the highest price
double low(int index){return (iLow(_Symbol,_Period,index));}     //--- Get the lowest price
double close(int index){return (iClose(_Symbol,_Period,index));} //--- Get the closing price
datetime time(int index){return (iTime(_Symbol,_Period,index));} //--- Get the time of the bar
接下来,我们使用三元运算符来确定每根K线的最高价和最低价。语句“double highest_price_i = (open_i > close_i) ? open_i : close_i;”检查开盘价是否高于收盘价。如果是,该K线的开盘价被设置为最高价。否则,收盘价成为最高价。同样,“double lowest_price_i = (open_i < close_i) ? open_i : close_i;”比较开盘价和收盘价,以确定该K线的最低价。
在计算出当前K线的最高价和最低价后,我们将它们与到目前为止整个期间的最高价和最低价进行比较:
- 如果选定K线的最高价高于记录的最高价,我们将最高价更新为这个新值。我们还将这根K线的索引存储在“highest_price_bar_index”中,并使用“time”函数记录这根K线的时间,该函数检索与第i根K线相关联的时间。这使我们能够跟踪最高价发生的时间。
- 如果“lowest_price_i”低于记录的“minimum_price”,我们将“minimum_price”更新为这个新值。我们还将这根K线的索引存储在“lowest_price_bar_index”中,并使用“time”函数将这根K线的时间记录在“minimum_time”中。
这个过程确保在循环结束时,我们已经确定了从午夜到上午6点时间范围内的最高价和最低价,以及它们发生的时间。我们将稍后使用这些值来设置突破分析的关键价格水平。为了确保获得了价格水平,我们可以记录它们以供确认。
         //--- Log the maximum and minimum prices, along with their respective bar indices and times
         Print("Maximum Price = ",maximum_price,", Bar index = ",highest_price_bar_index,", Time = ",maximum_time);
         Print("Minimum Price = ",minimum_price,", Bar index = ",lowest_price_bar_index,", Time = ",minimum_time);
在这里,我们只是打印出已识别的最高价和最低价,以及它们的K线索引和时间,以供确认。运行程序,我们得到了以下数据:
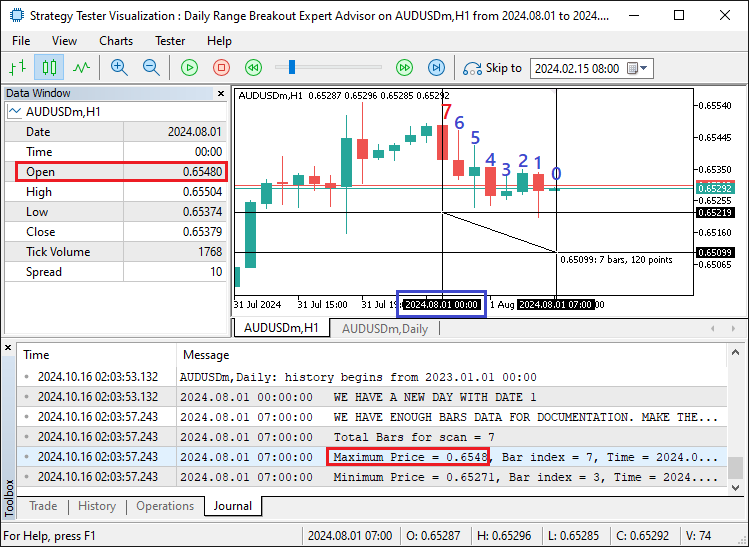
从图像中,我们可以看到我们的最高价位于第7根K线上,其数据从日志中为0.6548,与数据窗口中的开盘价匹配。其时间为午夜,如交叉准线的时间和日期刻度在x轴上所示。因此,我们可以确信已经获得了日价格,可以使用它们进行进一步分析。然而,不需要在当天的任何时间再进行分析,因为我们已经获得了必要的数据。因此,我们可以将价格跟踪变量的布尔标志设置为true,并等待第二天再次获取价格。
isHaveDailyRange_Prices = true; //--- Set the flag indicating daily range prices have been extracted
一旦设置了标志,我们就准备好了。然而,我们无法在图表上直观地看到范围设置。因此,我们可以开发一个模块,用于在图表上绘制范围。为了实现这一点,我们需要创建可以重复使用的函数。第一个函数将创建矩形。
//+------------------------------------------------------------------+
//|       FUNCTION TO CREATE A RECTANGLE                             |
//+------------------------------------------------------------------+
void create_Rectangle(string objName, datetime time1, double price1, datetime time2, double price2, color clr) {
   //--- Check if the object already exists by finding it on the chart
   if (ObjectFind(0, objName) < 0) {
      //--- Create a rectangle object using the defined parameters: name, type, and coordinates
      ObjectCreate(0, objName, OBJ_RECTANGLE, 0, time1, price1, time2, price2);

      //--- Set the time for the first point of the rectangle (start point)
      ObjectSetInteger(0, objName, OBJPROP_TIME, 0, time1);

      //--- Set the price for the first point of the rectangle (start point)
      ObjectSetDouble(0, objName, OBJPROP_PRICE, 0, price1);

      //--- Set the time for the second point of the rectangle (end point)
      ObjectSetInteger(0, objName, OBJPROP_TIME, 1, time2);

      //--- Set the price for the second point of the rectangle (end point)
      ObjectSetDouble(0, objName, OBJPROP_PRICE, 1, price2);

      //--- Enable the fill property for the rectangle, making it filled
      ObjectSetInteger(0, objName, OBJPROP_FILL, true);

      //--- Set the color for the rectangle
      ObjectSetInteger(0, objName, OBJPROP_COLOR, clr);

      //--- Set the rectangle to not appear behind other objects
      ObjectSetInteger(0, objName, OBJPROP_BACK, false);

      //--- Redraw the chart to reflect the new changes
      ChartRedraw(0);
   }
}
在这里,我们创建了一个void函数“create_Rectangle”,它将处理在MetaTrader图表上创建矩形对象。该函数接受六个参数:“objName”(对象的名称)、“time1”和“price1”(矩形第一个角的坐标)、“time2”和“price2”(矩形对角的坐标)以及“clr”(矩形的颜色)。在函数中,我们首先使用ObjectFind函数检查图表上是否已经存在具有给定名称的对象。如果未找到对象(即返回值小于0),我们继续创建矩形。
然后,我们调用ObjectCreate函数来创建矩形对象,提供必要的参数:图表ID(对于当前图表设置为0)、对象名称、对象类型(OBJ_RECTANGLE)以及坐标(由“time1, price1”和“time2, price2”定义)。
接下来,我们使用ObjectSetInteger和ObjectSetDouble函数来设置矩形的各个属性:
- “ObjectSetInteger(0, objName, OBJPROP_TIME, 0, time1)”设置矩形第一个角(起点)的时间。
- “ObjectSetDouble(0, objName, OBJPROP_PRICE, 0, price1)”设置矩形第一个角(起点)的价格。
- “ObjectSetInteger(0, objName, OBJPROP_TIME, 1, time2)”设置矩形第二个角(终点)的时间。
- “ObjectSetDouble(0, objName, OBJPROP_PRICE, 1, price2)”设置矩形第二个角(终点)的价格。
我们还使用OBJPROP_FILL方法为矩形启用填充属性,这使得矩形在图表上被填充显示,而不仅仅是轮廓。之后,我们使用OBJPROP_COLOR方法设置矩形的颜色,应用传递给函数的指定颜色(“clr”)。通过禁用OBJPROP_BACK属性,矩形被进一步配置为显示在其他对象的前面。最后,我们调用ChartRedraw函数来刷新图表,确保新创建的矩形立即显示在图表上。我们需要定义的下一个函数是用于在图表上创建线的函数,以便我们使用它们来显示区间的开始和结束时间。
//+------------------------------------------------------------------+
//|      FUNCTION TO CREATE A TREND LINE                             |
//+------------------------------------------------------------------+
void create_Line(string objName, datetime time1, double price1, datetime time2, double price2, int width, color clr, string text) {
   //--- Check if the line object already exists by its name
   if (ObjectFind(0, objName) < 0) {
      //--- Create a trendline object with the specified parameters
      ObjectCreate(0, objName, OBJ_TREND, 0, time1, price1, time2, price2);

      //--- Set the time for the first point of the trendline
      ObjectSetInteger(0, objName, OBJPROP_TIME, 0, time1);

      //--- Set the price for the first point of the trendline
      ObjectSetDouble(0, objName, OBJPROP_PRICE, 0, price1);

      //--- Set the time for the second point of the trendline
      ObjectSetInteger(0, objName, OBJPROP_TIME, 1, time2);

      //--- Set the price for the second point of the trendline
      ObjectSetDouble(0, objName, OBJPROP_PRICE, 1, price2);

      //--- Set the width for the line
      ObjectSetInteger(0, objName, OBJPROP_WIDTH, width);

      //--- Set the color of the trendline
      ObjectSetInteger(0, objName, OBJPROP_COLOR, clr);

      //--- Set the trendline to not be behind other objects
      ObjectSetInteger(0, objName, OBJPROP_BACK, false);

      //--- Retrieve the current chart scale
      long scale = 0;
      if(!ChartGetInteger(0, CHART_SCALE, 0, scale)) {
         //--- Print an error message if unable to retrieve the chart scale
         Print("UNABLE TO GET THE CHART SCALE. DEFAULT OF ", scale, " IS CONSIDERED");
      }
      //--- Set a default font size based on the chart scale
      int fontsize = 11;
      if (scale == 0) { fontsize = 5; }
      else if (scale == 1) { fontsize = 6; }
      else if (scale == 2) { fontsize = 7; }
      else if (scale == 3) { fontsize = 9; }
      else if (scale == 4) { fontsize = 11; }
      else if (scale == 5) { fontsize = 13; }

      //--- Define the description text to appear near the right price
      string txt = " Right Price";
      string objNameDescr = objName + txt;

      //--- Create a text object next to the line to display the description
      ObjectCreate(0, objNameDescr, OBJ_TEXT, 0, time2, price2);

      //--- Set the color for the text
      ObjectSetInteger(0, objNameDescr, OBJPROP_COLOR, clr);

      //--- Set the font size for the text
      ObjectSetInteger(0, objNameDescr, OBJPROP_FONTSIZE, fontsize);

      //--- Anchor the text to the left of the line
      ObjectSetInteger(0, objNameDescr, OBJPROP_ANCHOR, ANCHOR_LEFT);

      //--- Set the text content to display the specified string
      ObjectSetString(0, objNameDescr, OBJPROP_TEXT, " " + text);

      //--- Set the font of the text to "Calibri"
      ObjectSetString(0, objNameDescr, OBJPROP_FONT, "Calibri");

      //--- Redraw the chart to reflect the changes
      ChartRedraw(0);
   }
}
在这里,我们创建了另一个void函数“create_Line”,并传递必要的参数。该函数接受八个参数:“objName”(线对象的名称)、“time1”和“price1”(起点的坐标)、“time2”和“price2”(终点的坐标)、“width”(线的粗细)、“clr”(线的颜色)以及“text”(将显示在趋势线旁边的描述文本)。我们首先使用ObjectFind检查趋势线是否已经存在于图表上。如果指定名称的趋势线对象不存在(返回值小于0),我们继续创建该线。
为了创建趋势线,我们使用ObjectCreate函数,将对象类型定义为OBJ_TREND,并为趋势线分配起点(“time1, price1”)和终点(“time2, price2”)的坐标。
然后,我们使用ObjectSetInteger和ObjectSetDouble为线的起点和终点分配属性:
- “ObjectSetInteger(0, objName, OBJPROP_TIME, 0, time1)”设置第一个点的时间。
- “ObjectSetDouble(0, objName, OBJPROP_PRICE, 0, price1)”设置第一个点的价格。
- “ObjectSetInteger(0, objName, OBJPROP_TIME, 1, time2)”设置第二个点的时间。
- “ObjectSetDouble(0, objName, OBJPROP_PRICE, 1, price2)”设置第二个点的价格。
接下来,我们通过设置OBJPROP_WIDTH属性来设置线的宽度,该属性控制线的粗细,然后设置线的颜色。接着,我们通过将OBJPROP_BACK属性设置为false,确保线显示在其他对象的前面,这意味着趋势线不会出现在其他图表元素的后面。
为了增强趋势线的显示效果,我们使用ChartGetInteger检索当前图表的缩放比例。如果成功获取缩放比例,我们使用它来设置将显示在趋势线旁边的描述文本的字体大小。根据图表的缩放比例,我们相应地调整字体大小,默认为11。接下来,我们定义一个描述性标签“Right Price”,将其放置在趋势线旁边,并通过在原始对象名称后附加“txt”来生成这个标签的对象名称,形成“objNameDescr”。
然后,我们使用ObjectCreate函数创建文本对象,将其放置在线的终点(“time2, price2”),并设置各种属性:
- “ObjectSetInteger(0, objNameDescr, OBJPROP_COLOR, clr)”将文本颜色设置为与趋势线颜色一致。
- “ObjectSetInteger(0, objNameDescr, OBJPROP_FONTSIZE, fontsize)”根据之前计算的值设置字体大小。
- “ObjectSetInteger(0, objNameDescr, OBJPROP_ANCHOR, ANCHOR_LEFT)”将文本锚定在线的左侧。
- “ObjectSetString(0, objNameDescr, OBJPROP_TEXT, ' ' + text)”将实际文本内容设置为传递给函数的“text”参数。
- “ObjectSetString(0, objNameDescr, OBJPROP_FONT, 'Calibri')”将文本字体设置为“Calibri”,以便清晰易读。
最后,我们通过调用ChartRedraw刷新图表,以确保新创建的趋势线和附带的文本正确显示在图表上。然后,我们可以调用这些函数,并使用它们来绘制区间的详细信息。
         //--- Create visual elements to represent the daily range
         create_Rectangle(RECTANGLE_PREFIX+TimeToString(maximum_time),maximum_time,maximum_price,minimum_time,minimum_price,clrBlue); //--- Create a rectangle for the daily range
         create_Line(UPPER_LINE_PREFIX+TimeToString(midnight),midnight,maximum_price,sixAM,maximum_price,3,clrBlack,DoubleToString(maximum_price,_Digits)); //--- Draw upper range line
         create_Line(LOWER_LINE_PREFIX+TimeToString(midnight),midnight,minimum_price,sixAM,minimum_price,3,clrRed,DoubleToString(minimum_price,_Digits));   //--- Draw lower range line
编译和运行程序得到如下结果:
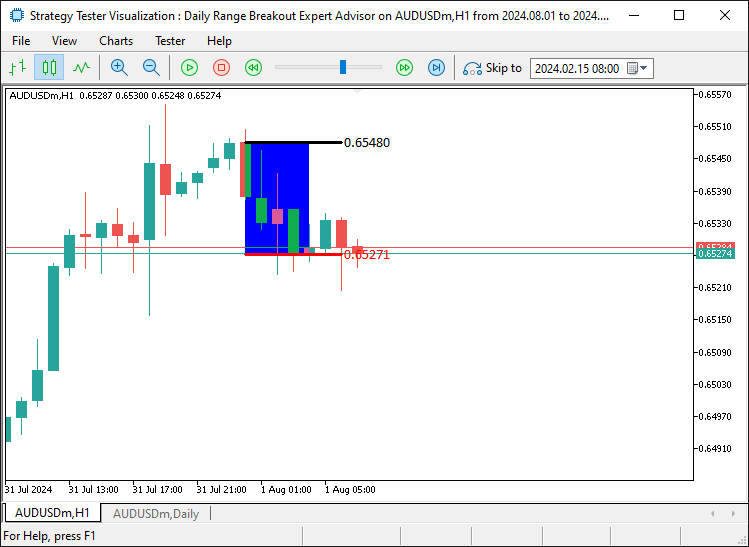
现在,我们在图表上直观地绘制并显示了区间的详细信息,这不仅更具吸引力,而且便于参考和确认价格。接下来,我们需要做的是检查突破情况。这是我们需要在每一个价格变动上进行检查以确定水平突破的点,并且如果条件满足,就启动相应的交易逻辑。对于区间上界的突破,我们有以下逻辑。
   //--- Get the close price and time of the previous bar
   double barClose = close(1);
   datetime barTime = time(1);

   //--- Check for upper range breakout condition
   if (barClose > maximum_price && isHaveDailyRange_Prices && !isHaveRangeBreak
       && barTime >= validBreakTime_start && barTime <= validBreakTime_end){
      Print("CLOSE Price broke the HIGH range. ",barClose," > ",maximum_price); //--- Log the breakout event
      isHaveRangeBreak = true; //--- Set the flag indicating a breakout occurred
      drawBreakPoint(TimeToString(barTime),barTime,barClose,234,clrBlack,-1); //--- Draw a point to mark the breakout
   }
在这里,我们检查前一根K线的收盘价是否超过了当日的最高价,这是区间上界被突破的迹象。首先,我们使用“close”和“time”自定义函数检索前一根K线的收盘价和时间,分别将这些值存储在“barClose”和“barTime”中。这使我们能够引用正在分析的K线的收盘价和时间。
接下来,我们进行一系列检查以确认是否发生了突破。我们检查“barClose”是否大于“maximum_price”,确保收盘价超过了当日记录的最高价。我们还通过“isHaveDailyRange_Prices”标志验证是否已提取日波动区间价格,并通过“!isHaveRangeBreak”标志确认之前未检测到突破。此外,我们通过检查“barTime”是否在“validBreakTime_start”和“validBreakTime_end”之间,确保突破发生在有效突破窗口内。
如果所有条件都满足,通过打印一条消息记录突破事件,表明收盘价已突破上层范围。然后,将“isHaveRangeBreak”设置为true,标记已检测到突破。最后,调用“drawBreakPoint”函数在图表上直观地标记这一突破。该函数使用K线的时间、收盘价、标记大小、颜色和优先级来显示突破的直观表示。以下是该函数的逻辑,与之前的函数类似。
//+------------------------------------------------------------------+
//|       FUNCTION TO CREATE AN ARROW                                |
//+------------------------------------------------------------------+
void drawBreakPoint(string objName, datetime time, double price, int arrCode, color clr, int direction) {
   //--- Check if the arrow object already exists on the chart
   if (ObjectFind(0, objName) < 0) {
      //--- Create an arrow object with the specified time, price, and arrow code
      ObjectCreate(0, objName, OBJ_ARROW, 0, time, price);

      //--- Set the arrow's code (symbol)
      ObjectSetInteger(0, objName, OBJPROP_ARROWCODE, arrCode);

      //--- Set the color for the arrow
      ObjectSetInteger(0, objName, OBJPROP_COLOR, clr);

      //--- Set the font size for the arrow
      ObjectSetInteger(0, objName, OBJPROP_FONTSIZE, 12);

      //--- Set the anchor position for the arrow based on the direction
      if (direction > 0) ObjectSetInteger(0, objName, OBJPROP_ANCHOR, ANCHOR_TOP);
      if (direction < 0) ObjectSetInteger(0, objName, OBJPROP_ANCHOR, ANCHOR_BOTTOM);

      //--- Define a text label for the break point
      string txt = " Break";
      string objNameDescr = objName + txt;

      //--- Create a text object for the break point description
      ObjectCreate(0, objNameDescr, OBJ_TEXT, 0, time, price);

      //--- Set the color for the text description
      ObjectSetInteger(0, objNameDescr, OBJPROP_COLOR, clr);

      //--- Set the font size for the text
      ObjectSetInteger(0, objNameDescr, OBJPROP_FONTSIZE, 12);

      //--- Adjust the text anchor based on the direction of the arrow
      if (direction > 0) {
         ObjectSetInteger(0, objNameDescr, OBJPROP_ANCHOR, ANCHOR_LEFT_UPPER);
         ObjectSetString(0, objNameDescr, OBJPROP_TEXT, " " + txt);
      }
      if (direction < 0) {
         ObjectSetInteger(0, objNameDescr, OBJPROP_ANCHOR, ANCHOR_LEFT_LOWER);
         ObjectSetString(0, objNameDescr, OBJPROP_TEXT, " " + txt);
      }
   }
   //--- Redraw the chart to reflect the new objects
   ChartRedraw(0);
}
检查下边界是否被突破,我们采用同寻找上边界突破相似的逻辑。
   //--- Check for lower range breakout condition
   else if (barClose < minimum_price && isHaveDailyRange_Prices && !isHaveRangeBreak
            && barTime >= validBreakTime_start && barTime <= validBreakTime_end){
      Print("CLOSE Price broke the LOW range. ",barClose," < ",minimum_price); //--- Log the breakout event
      isHaveRangeBreak = true; //--- Set the flag indicating a breakout occurred
      drawBreakPoint(TimeToString(barTime),barTime,barClose,233,clrBlue,1); //--- Draw a point to mark the breakout
   }
编译完成后,我们得到了以下结果。
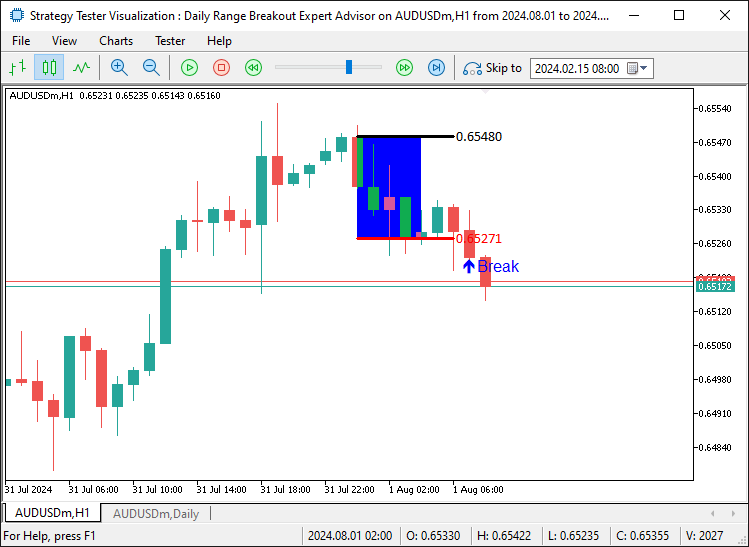
成功了。我们可以看到,一旦发生下边界的突破,图表上会显示一个突破点箭头,直观地指出了发生突破的K线。让我们运行程序,看看相反方向的突破情况。
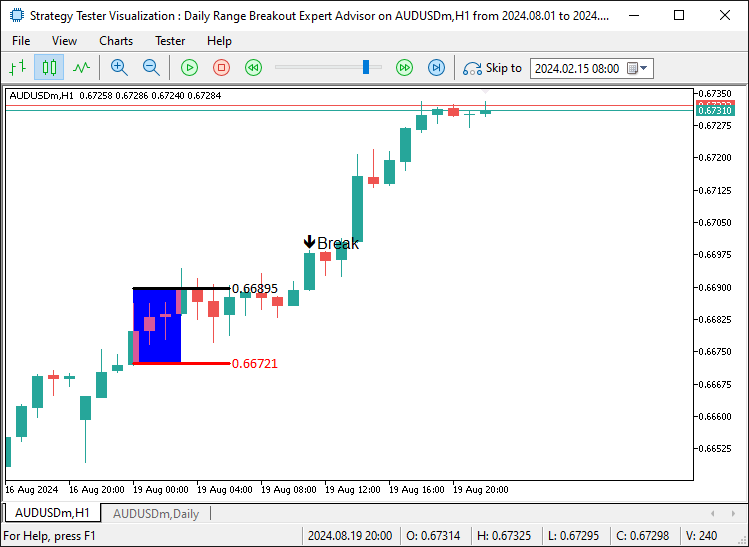
成功了。我们还可以看到,正如预期的那样,上边界也发生了突破。接下来,我们需要在这些突破发生时开仓,这将完成整个流程。
   double Ask = NormalizeDouble(SymbolInfoDouble(_Symbol,SYMBOL_ASK),_Digits);
   double Bid = NormalizeDouble(SymbolInfoDouble(_Symbol,SYMBOL_BID),_Digits);

   //--- Check for upper range breakout condition
   if (barClose > maximum_price && isHaveDailyRange_Prices && !isHaveRangeBreak
       && barTime >= validBreakTime_start && barTime <= validBreakTime_end){
      Print("CLOSE Price broke the HIGH range. ",barClose," > ",maximum_price); //--- Log the breakout event
      isHaveRangeBreak = true; //--- Set the flag indicating a breakout occurred
      drawBreakPoint(TimeToString(barTime),barTime,barClose,234,clrBlack,-1); //--- Draw a point to mark the breakout
      obj_Trade.Buy(0.01,_Symbol,Ask,minimum_price,Bid+(maximum_price-minimum_price)*2);
   }
   //--- Check for lower range breakout condition
   else if (barClose < minimum_price && isHaveDailyRange_Prices && !isHaveRangeBreak
            && barTime >= validBreakTime_start && barTime <= validBreakTime_end){
      Print("CLOSE Price broke the LOW range. ",barClose," < ",minimum_price); //--- Log the breakout event
      isHaveRangeBreak = true; //--- Set the flag indicating a breakout occurred
      drawBreakPoint(TimeToString(barTime),barTime,barClose,233,clrBlue,1); //--- Draw a point to mark the breakout
      obj_Trade.Sell(0.01,_Symbol,Bid,maximum_price,Ask-(maximum_price-minimum_price)*2);
   }
有了这段代码,我们现在就能开仓了。运行程序我们将得到下面的输出。
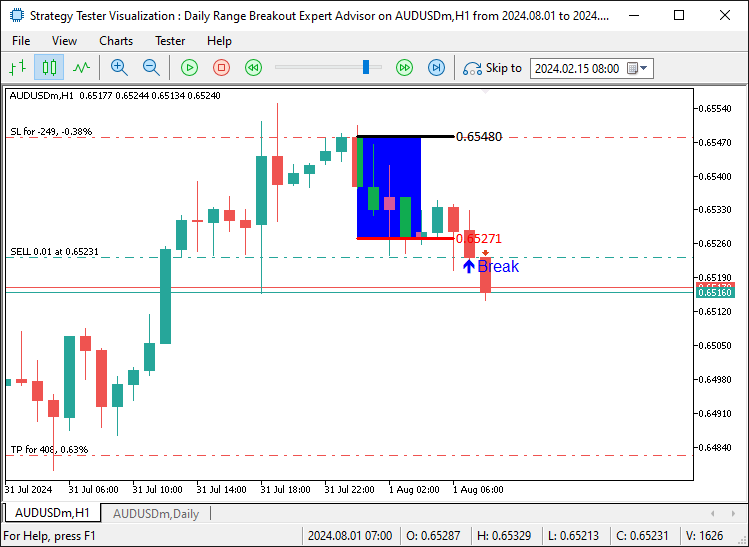
从图像中,我们可以确认我们正确地开仓了,例如,将卖单的止损设置在上层水平,并将获利目标设置在入场点下方两倍范围大小的位置。在下一部分,我们将专注于测试程序,评估其表现,并微调参数以获得最佳结果。
回测与优化
在完成实现之后,下一步关键步骤是对专EA进行彻底测试,以评估其性能并优化其参数。有效的测试可以确保该策略在各种市场条件下表现如预期,最小化交易过程中出现意外问题的风险。在这里,我们将使用MetaTrader 5策略测试器进行回测和优化,以找到策略的最佳输入参数。
为了进行优化,我们需要在设置部分输入参数。我们将考虑风险与回报比率、突破的有效时间(以小时为单位)以及突破发生后的交易方向,来优化我们的策略。也就是说,当发生下边界被突破时,可以选择做多而不是做空,仅此而已。就这么简单。以下是我们的逻辑代码。
enum trade_direction {Default_Trade_Directions,Invert_Trade_Directions};

input int r2r = 2;
input int hoursValidity = 5;
input trade_direction direction_of_trade = Default_Trade_Directions;
在这里,我们定义了一个枚举类型,并初始化了一些输入变量,用于控制交易行为和策略参数。首先,我们声明了一个名为“trade_direction”的枚举,它定义了两个可能的值:“Default_Trade_Directions”和“Invert_Trade_Directions”。枚举(enum)是MQL5中的一种用户定义的数据类型,允许我们为整数常量分配名称,从而使代码更具可读性和易于管理。在这种情况下,“trade_direction”将帮助控制交易是否遵循默认的交易方向,或者是否根据特定条件反转方向。
接下来,我们定义了三个输入变量,允许用户直接从EA的设置中修改这些值,而无需编辑代码本身,但在优化程序时它们将更有用。第一个变量是“r2r”,默认设置为2,我们将用它来控制策略的风险与回报方面。input关键字表示用户可以在外部调整此变量。第二个输入是“hoursValidity”,默认值为5。这个变量将控制突破交易条件或信号的有效时间,以小时为单位。
最后,第三个输入是“direction_of_trade”,它是之前定义的“trade_direction”类型(枚举)。默认情况下,我们将其设置为“Default_Trade_Directions”,但用户可以将其更改为“Invert_Trade_Directions”,如果他们希望交易朝相反方向进行。此输入提供了在不修改EA核心逻辑的情况下决定交易方向的灵活性。考虑到这一点,我们只需要在代码中替换相应的静态参数,以增加动态性。
   static datetime midnight = iTime(_Symbol,PERIOD_D1,0);  //--- Get the time of midnight (start of the day) for daily chart
   static datetime sixAM = midnight + 6 * 3600;            //--- Calculate 6 AM based on midnight time
   static datetime scanBarTime = sixAM + 1 * PeriodSeconds(_Period); //--- Set scan time for the next bar after 6 AM

   static datetime validBreakTime_start = scanBarTime;     //--- Set the start of valid breakout time
   static datetime validBreakTime_end = midnight + (6+hoursValidity) * 3600; //--- Set the end of valid breakout time to 11 AM

   if (isNewDay()){
      //--- Reset values for the new day
      midnight = iTime(_Symbol,PERIOD_D1,0);    //--- Get the new midnight time
      sixAM = midnight + 6 * 3600;              //--- Recalculate 6 AM
      scanBarTime = sixAM + 1 * PeriodSeconds(_Period); //--- Recalculate the scan bar time

      validBreakTime_start = scanBarTime;       //--- Update valid breakout start time
      validBreakTime_end = midnight + (6+hoursValidity) * 3600; //--- Update valid breakout end time to 11 AM

      maximum_price = -DBL_MAX;                 //--- Reset the maximum price for the new day
      minimum_price = DBL_MAX;                  //--- Reset the minimum price for the new day

      isHaveDailyRange_Prices = false;          //--- Reset the daily range flag for the new day
      isHaveRangeBreak = false;                 //--- Reset the breakout flag for the new day
   }

   //---

   //--- Check for upper range breakout condition
   if (barClose > maximum_price && isHaveDailyRange_Prices && !isHaveRangeBreak
       && barTime >= validBreakTime_start && barTime <= validBreakTime_end){
      Print("CLOSE Price broke the HIGH range. ",barClose," > ",maximum_price); //--- Log the breakout event
      isHaveRangeBreak = true; //--- Set the flag indicating a breakout occurred
      drawBreakPoint(TimeToString(barTime),barTime,barClose,234,clrBlack,-1); //--- Draw a point to mark the breakout

      if (direction_of_trade == Default_Trade_Directions){
         obj_Trade.Buy(0.01,_Symbol,Ask,minimum_price,Bid+(maximum_price-minimum_price)*r2r);
      }
      else if (direction_of_trade == Invert_Trade_Directions){
         obj_Trade.Sell(0.01,_Symbol,Bid,Ask+(maximum_price-minimum_price),Ask-(maximum_price-minimum_price)*r2r);
      }
   }
   //--- Check for lower range breakout condition
   else if (barClose < minimum_price && isHaveDailyRange_Prices && !isHaveRangeBreak
            && barTime >= validBreakTime_start && barTime <= validBreakTime_end){
      Print("CLOSE Price broke the LOW range. ",barClose," < ",minimum_price); //--- Log the breakout event
      isHaveRangeBreak = true; //--- Set the flag indicating a breakout occurred
      drawBreakPoint(TimeToString(barTime),barTime,barClose,233,clrBlue,1); //--- Draw a point to mark the breakout

      if (direction_of_trade == Default_Trade_Directions){
         obj_Trade.Sell(0.01,_Symbol,Bid,maximum_price,Ask-(maximum_price-minimum_price)*r2r);
      }
      else if (direction_of_trade == Invert_Trade_Directions){
         obj_Trade.Buy(0.01,_Symbol,Ask,Bid-(maximum_price-minimum_price),Bid+(maximum_price-minimum_price)*r2r);
      }
   }
我们现在已经添加了更改,并突出显示了特定部分以便更清晰。如果进行编译,我们可以在输入部分找到这些输入项,如下所示,我们可以从中选择来进行优化,以找到程序的最佳交易参数。
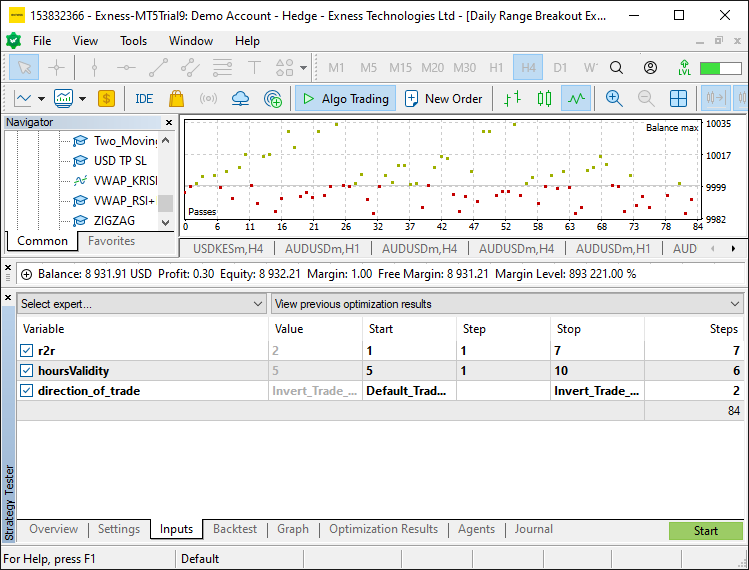
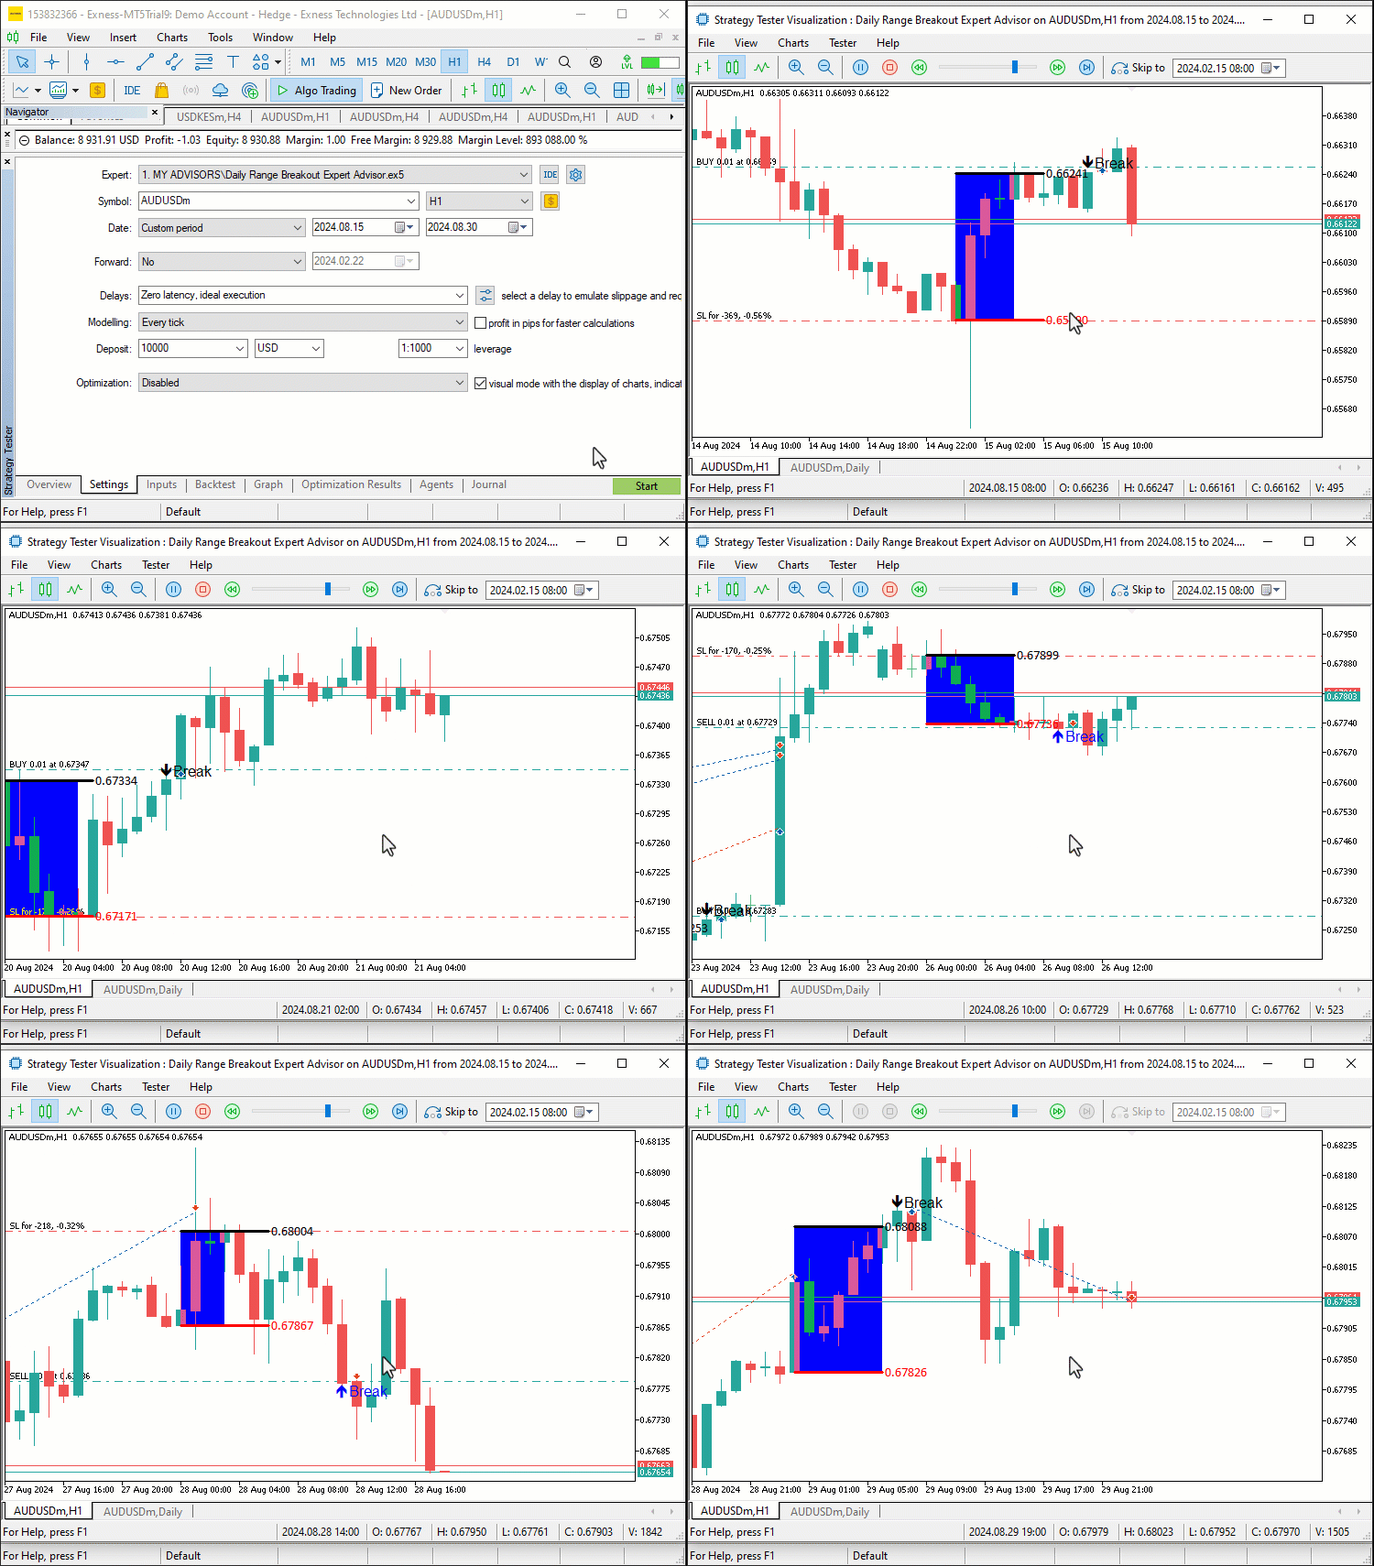
从图像中,我们可以看到有优化输入参数项,只需点击开始按钮即可执行优化。在这种情况下,我们只选择了一个月的时间范围,以避免程序过度优化。完成后,我们为程序设置最佳参数,并将其用于回测。以下是回测结果。
//+------------------------------------------------------------------+
//|                          Daily Range Breakout Expert Advisor.mq5 |
//|      Copyright 2024, ALLAN MUNENE MUTIIRIA. #@Forex Algo-Trader. |
//|                                     https://forexalg0-trader.com |
//+------------------------------------------------------------------+
#property copyright "Copyright 2024, ALLAN MUNENE MUTIIRIA. #@Forex Algo-Trader"
#property link      "https://forexalg0-trader.com"
#property description "Daily Range Breakout Expert Advisor"
#property version   "1.00"

#include <Trade/Trade.mqh>
CTrade obj_Trade;

enum trade_direction {Default_Trade_Directions,Invert_Trade_Directions};

input int r2r = 2;
input int hoursValidity = 5;
input trade_direction direction_of_trade = Default_Trade_Directions;

double maximum_price = -DBL_MAX;  //--- Initialize the maximum price with the smallest possible value
double minimum_price = DBL_MAX;   //--- Initialize the minimum price with the largest possible value
datetime maximum_time, minimum_time; //--- Declare variables to store the time of the highest and lowest prices
bool isHaveDailyRange_Prices = false; //--- Boolean flag to check if daily range prices are extracted
bool isHaveRangeBreak = false;        //--- Boolean flag to check if a range breakout has occurred

#define RECTANGLE_PREFIX "RANGE RECTANGLE " //--- Prefix for naming range rectangles
#define UPPER_LINE_PREFIX "UPPER LINE "     //--- Prefix for naming upper range line
#define LOWER_LINE_PREFIX "LOWER LINE "     //--- Prefix for naming lower range line

//+------------------------------------------------------------------+
//| Expert initialization function                                   |
//+------------------------------------------------------------------+
int OnInit(){
   //--- Initialization code can be placed here if needed

   //---
   return(INIT_SUCCEEDED); //--- Return successful initialization
}
//+------------------------------------------------------------------+
//| Expert deinitialization function                                 |
//+------------------------------------------------------------------+
void OnDeinit(const int reason){
   //--- Deinitialization code can be placed here if needed
}
//+------------------------------------------------------------------+
//| Expert tick function                                             |
//+------------------------------------------------------------------+
void OnTick(){
   //---
   static datetime midnight = iTime(_Symbol,PERIOD_D1,0);  //--- Get the time of midnight (start of the day) for daily chart
   static datetime sixAM = midnight + 6 * 3600;            //--- Calculate 6 AM based on midnight time
   static datetime scanBarTime = sixAM + 1 * PeriodSeconds(_Period); //--- Set scan time for the next bar after 6 AM

   static datetime validBreakTime_start = scanBarTime;     //--- Set the start of valid breakout time
   static datetime validBreakTime_end = midnight + (6+hoursValidity) * 3600; //--- Set the end of valid breakout time to 11 AM

   if (isNewDay()){
      //--- Reset values for the new day
      midnight = iTime(_Symbol,PERIOD_D1,0);    //--- Get the new midnight time
      sixAM = midnight + 6 * 3600;              //--- Recalculate 6 AM
      scanBarTime = sixAM + 1 * PeriodSeconds(_Period); //--- Recalculate the scan bar time

      validBreakTime_start = scanBarTime;       //--- Update valid breakout start time
      validBreakTime_end = midnight + (6+hoursValidity) * 3600; //--- Update valid breakout end time to 11 AM

      maximum_price = -DBL_MAX;                 //--- Reset the maximum price for the new day
      minimum_price = DBL_MAX;                  //--- Reset the minimum price for the new day

      isHaveDailyRange_Prices = false;          //--- Reset the daily range flag for the new day
      isHaveRangeBreak = false;                 //--- Reset the breakout flag for the new day
   }

   if (isNewBar()){
      //--- If a new bar has been formed, process the data
      datetime currentBarTime = iTime(_Symbol,_Period,0); //--- Get the time of the current bar

      if (currentBarTime == scanBarTime && !isHaveDailyRange_Prices){
         //--- If it's time to scan and the daily range is not yet extracted
         Print("WE HAVE ENOUGH BARS DATA FOR DOCUMENTATION. MAKE THE EXTRACTION"); //--- Log the extraction process
         int total_bars = int((sixAM - midnight)/PeriodSeconds(_Period)) + 1; //--- Calculate total bars between midnight and 6 AM
         Print("Total Bars for scan = ",total_bars); //--- Log the total number of bars for scanning
         int highest_price_bar_index = -1;   //--- Variable to store the bar index of the highest price
         int lowest_price_bar_index = -1;    //--- Variable to store the bar index of the lowest price

         for (int i=1; i<=total_bars ; i++){ //--- Loop through all bars within the defined time range
            double open_i = open(i);         //--- Get the opening price of the i-th bar
            double close_i = close(i);       //--- Get the closing price of the i-th bar

            double highest_price_i = (open_i > close_i) ? open_i : close_i; //--- Determine the highest price between open and close
            double lowest_price_i = (open_i < close_i) ? open_i : close_i;  //--- Determine the lowest price between open and close

            if (highest_price_i > maximum_price){
               //--- If the current highest price is greater than the recorded maximum price
               maximum_price = highest_price_i; //--- Update the maximum price
               highest_price_bar_index = i;     //--- Update the index of the highest price bar
               maximum_time = time(i);          //--- Update the time of the highest price
            }
            if (lowest_price_i < minimum_price){
               //--- If the current lowest price is lower than the recorded minimum price
               minimum_price = lowest_price_i;  //--- Update the minimum price
               lowest_price_bar_index = i;      //--- Update the index of the lowest price bar
               minimum_time = time(i);          //--- Update the time of the lowest price
            }
         }
         //--- Log the maximum and minimum prices, along with their respective bar indices and times
         Print("Maximum Price = ",maximum_price,", Bar index = ",highest_price_bar_index,", Time = ",maximum_time);
         Print("Minimum Price = ",minimum_price,", Bar index = ",lowest_price_bar_index,", Time = ",minimum_time);

         //--- Create visual elements to represent the daily range
         create_Rectangle(RECTANGLE_PREFIX+TimeToString(maximum_time),maximum_time,maximum_price,minimum_time,minimum_price,clrBlue); //--- Create a rectangle for the daily range
         create_Line(UPPER_LINE_PREFIX+TimeToString(midnight),midnight,maximum_price,sixAM,maximum_price,3,clrBlack,DoubleToString(maximum_price,_Digits)); //--- Draw upper range line
         create_Line(LOWER_LINE_PREFIX+TimeToString(midnight),midnight,minimum_price,sixAM,minimum_price,3,clrRed,DoubleToString(minimum_price,_Digits));   //--- Draw lower range line

         isHaveDailyRange_Prices = true; //--- Set the flag indicating daily range prices have been extracted
      }
   }

   //--- Get the close price and time of the previous bar
   double barClose = close(1);
   datetime barTime = time(1);

   double Ask = NormalizeDouble(SymbolInfoDouble(_Symbol,SYMBOL_ASK),_Digits);
   double Bid = NormalizeDouble(SymbolInfoDouble(_Symbol,SYMBOL_BID),_Digits);

   //--- Check for upper range breakout condition
   if (barClose > maximum_price && isHaveDailyRange_Prices && !isHaveRangeBreak
       && barTime >= validBreakTime_start && barTime <= validBreakTime_end){
      Print("CLOSE Price broke the HIGH range. ",barClose," > ",maximum_price); //--- Log the breakout event
      isHaveRangeBreak = true; //--- Set the flag indicating a breakout occurred
      drawBreakPoint(TimeToString(barTime),barTime,barClose,234,clrBlack,-1); //--- Draw a point to mark the breakout

      if (direction_of_trade == Default_Trade_Directions){
         obj_Trade.Buy(0.01,_Symbol,Ask,minimum_price,Bid+(maximum_price-minimum_price)*r2r);
      }
      else if (direction_of_trade == Invert_Trade_Directions){
         obj_Trade.Sell(0.01,_Symbol,Bid,Ask+(maximum_price-minimum_price),Ask-(maximum_price-minimum_price)*r2r);
      }
   }
   //--- Check for lower range breakout condition
   else if (barClose < minimum_price && isHaveDailyRange_Prices && !isHaveRangeBreak
            && barTime >= validBreakTime_start && barTime <= validBreakTime_end){
      Print("CLOSE Price broke the LOW range. ",barClose," < ",minimum_price); //--- Log the breakout event
      isHaveRangeBreak = true; //--- Set the flag indicating a breakout occurred
      drawBreakPoint(TimeToString(barTime),barTime,barClose,233,clrBlue,1); //--- Draw a point to mark the breakout

      if (direction_of_trade == Default_Trade_Directions){
         obj_Trade.Sell(0.01,_Symbol,Bid,maximum_price,Ask-(maximum_price-minimum_price)*r2r);
      }
      else if (direction_of_trade == Invert_Trade_Directions){
         obj_Trade.Buy(0.01,_Symbol,Ask,Bid-(maximum_price-minimum_price),Bid+(maximum_price-minimum_price)*r2r);
      }
   }
}

//--- Utility functions to retrieve price and time data for a given bar index
double open(int index){return (iOpen(_Symbol,_Period,index));}   //--- Get the opening price
double high(int index){return (iHigh(_Symbol,_Period,index));}   //--- Get the highest price
double low(int index){return (iLow(_Symbol,_Period,index));}     //--- Get the lowest price
double close(int index){return (iClose(_Symbol,_Period,index));} //--- Get the closing price
datetime time(int index){return (iTime(_Symbol,_Period,index));} //--- Get the time of the bar

//+------------------------------------------------------------------+
//|       FUNCTION TO CREATE A RECTANGLE                             |
//+------------------------------------------------------------------+
void create_Rectangle(string objName, datetime time1, double price1, datetime time2, double price2, color clr) {
   //--- Check if the object already exists by finding it on the chart
   if (ObjectFind(0, objName) < 0) {
      //--- Create a rectangle object using the defined parameters: name, type, and coordinates
      ObjectCreate(0, objName, OBJ_RECTANGLE, 0, time1, price1, time2, price2);

      //--- Set the time for the first point of the rectangle (start point)
      ObjectSetInteger(0, objName, OBJPROP_TIME, 0, time1);

      //--- Set the price for the first point of the rectangle (start point)
      ObjectSetDouble(0, objName, OBJPROP_PRICE, 0, price1);

      //--- Set the time for the second point of the rectangle (end point)
      ObjectSetInteger(0, objName, OBJPROP_TIME, 1, time2);

      //--- Set the price for the second point of the rectangle (end point)
      ObjectSetDouble(0, objName, OBJPROP_PRICE, 1, price2);

      //--- Enable the fill property for the rectangle, making it filled
      ObjectSetInteger(0, objName, OBJPROP_FILL, true);

      //--- Set the color for the rectangle
      ObjectSetInteger(0, objName, OBJPROP_COLOR, clr);

      //--- Set the rectangle to not appear behind other objects
      ObjectSetInteger(0, objName, OBJPROP_BACK, false);

      //--- Redraw the chart to reflect the new changes
      ChartRedraw(0);
   }
}
//+------------------------------------------------------------------+
//|      FUNCTION TO CREATE A TREND LINE                             |
//+------------------------------------------------------------------+
void create_Line(string objName, datetime time1, double price1, datetime time2, double price2, int width, color clr, string text) {
   //--- Check if the line object already exists by its name
   if (ObjectFind(0, objName) < 0) {
      //--- Create a trendline object with the specified parameters
      ObjectCreate(0, objName, OBJ_TREND, 0, time1, price1, time2, price2);

      //--- Set the time for the first point of the trendline
      ObjectSetInteger(0, objName, OBJPROP_TIME, 0, time1);

      //--- Set the price for the first point of the trendline
      ObjectSetDouble(0, objName, OBJPROP_PRICE, 0, price1);

      //--- Set the time for the second point of the trendline
      ObjectSetInteger(0, objName, OBJPROP_TIME, 1, time2);

      //--- Set the price for the second point of the trendline
      ObjectSetDouble(0, objName, OBJPROP_PRICE, 1, price2);

      //--- Set the width for the line
      ObjectSetInteger(0, objName, OBJPROP_WIDTH, width);

      //--- Set the color of the trendline
      ObjectSetInteger(0, objName, OBJPROP_COLOR, clr);

      //--- Set the trendline to not be behind other objects
      ObjectSetInteger(0, objName, OBJPROP_BACK, false);

      //--- Retrieve the current chart scale
      long scale = 0;
      if(!ChartGetInteger(0, CHART_SCALE, 0, scale)) {
         //--- Print an error message if unable to retrieve the chart scale
         Print("UNABLE TO GET THE CHART SCALE. DEFAULT OF ", scale, " IS CONSIDERED");
      }
      //--- Set a default font size based on the chart scale
      int fontsize = 11;
      if (scale == 0) { fontsize = 5; }
      else if (scale == 1) { fontsize = 6; }
      else if (scale == 2) { fontsize = 7; }
      else if (scale == 3) { fontsize = 9; }
      else if (scale == 4) { fontsize = 11; }
      else if (scale == 5) { fontsize = 13; }

      //--- Define the description text to appear near the right price
      string txt = " Right Price";
      string objNameDescr = objName + txt;

      //--- Create a text object next to the line to display the description
      ObjectCreate(0, objNameDescr, OBJ_TEXT, 0, time2, price2);

      //--- Set the color for the text
      ObjectSetInteger(0, objNameDescr, OBJPROP_COLOR, clr);

      //--- Set the font size for the text
      ObjectSetInteger(0, objNameDescr, OBJPROP_FONTSIZE, fontsize);

      //--- Anchor the text to the left of the line
      ObjectSetInteger(0, objNameDescr, OBJPROP_ANCHOR, ANCHOR_LEFT);

      //--- Set the text content to display the specified string
      ObjectSetString(0, objNameDescr, OBJPROP_TEXT, " " + text);

      //--- Set the font of the text to "Calibri"
      ObjectSetString(0, objNameDescr, OBJPROP_FONT, "Calibri");

      //--- Redraw the chart to reflect the changes
      ChartRedraw(0);
   }
}

bool isNewBar() {
   //--- Static variable to hold the previous number of bars
   static int prevBars = 0;

   //--- Get the current number of bars on the chart
   int currBars = iBars(_Symbol, _Period);

   //--- If the number of bars hasn't changed, return false
   if (prevBars == currBars) return (false);

   //--- Update the previous bar count with the current one
   prevBars = currBars;

   //--- Return true if a new bar has been formed
   return (true);
}

bool isNewDay() {
   //--- Flag to indicate if a new day has started
   bool newDay = false;

   //--- Structure to hold the current date and time
   MqlDateTime Str_DateTime;

   //--- Convert the current time to a structured format
   TimeToStruct(TimeCurrent(), Str_DateTime);

   //--- Static variable to store the previous day
   static int prevDay = 0;

   //--- Get the current day from the structured time
   int currDay = Str_DateTime.day;

   //--- If the previous day is the same as the current day, we're still on the same day
   if (prevDay == currDay) {
      newDay = false;
   }
   //--- If the current day differs from the previous one, we have a new day
   else if (prevDay != currDay) {
      //--- Print a message indicating the new day
      Print("WE HAVE A NEW DAY WITH DATE ", currDay);

      //--- Update the previous day to the current day
      prevDay = currDay;

      //--- Set the flag to true, indicating a new day has started
      newDay = true;
   }

   //--- Return whether a new day has started
   return (newDay);
}
//+------------------------------------------------------------------+
//|       FUNCTION TO CREATE AN ARROW                                |
//+------------------------------------------------------------------+
void drawBreakPoint(string objName, datetime time, double price, int arrCode, color clr, int direction) {
   //--- Check if the arrow object already exists on the chart
   if (ObjectFind(0, objName) < 0) {
      //--- Create an arrow object with the specified time, price, and arrow code
      ObjectCreate(0, objName, OBJ_ARROW, 0, time, price);

      //--- Set the arrow's code (symbol)
      ObjectSetInteger(0, objName, OBJPROP_ARROWCODE, arrCode);

      //--- Set the color for the arrow
      ObjectSetInteger(0, objName, OBJPROP_COLOR, clr);

      //--- Set the font size for the arrow
      ObjectSetInteger(0, objName, OBJPROP_FONTSIZE, 12);

      //--- Set the anchor position for the arrow based on the direction
      if (direction > 0) ObjectSetInteger(0, objName, OBJPROP_ANCHOR, ANCHOR_TOP);
      if (direction < 0) ObjectSetInteger(0, objName, OBJPROP_ANCHOR, ANCHOR_BOTTOM);

      //--- Define a text label for the break point
      string txt = " Break";
      string objNameDescr = objName + txt;

      //--- Create a text object for the break point description
      ObjectCreate(0, objNameDescr, OBJ_TEXT, 0, time, price);

      //--- Set the color for the text description
      ObjectSetInteger(0, objNameDescr, OBJPROP_COLOR, clr);

      //--- Set the font size for the text
      ObjectSetInteger(0, objNameDescr, OBJPROP_FONTSIZE, 12);

      //--- Adjust the text anchor based on the direction of the arrow
      if (direction > 0) {
         ObjectSetInteger(0, objNameDescr, OBJPROP_ANCHOR, ANCHOR_LEFT_UPPER);
         ObjectSetString(0, objNameDescr, OBJPROP_TEXT, " " + txt);
      }
      if (direction < 0) {
         ObjectSetInteger(0, objNameDescr, OBJPROP_ANCHOR, ANCHOR_LEFT_LOWER);
         ObjectSetString(0, objNameDescr, OBJPROP_TEXT, " " + txt);
      }
   }
   //--- Redraw the chart to reflect the new objects
   ChartRedraw(0);
}
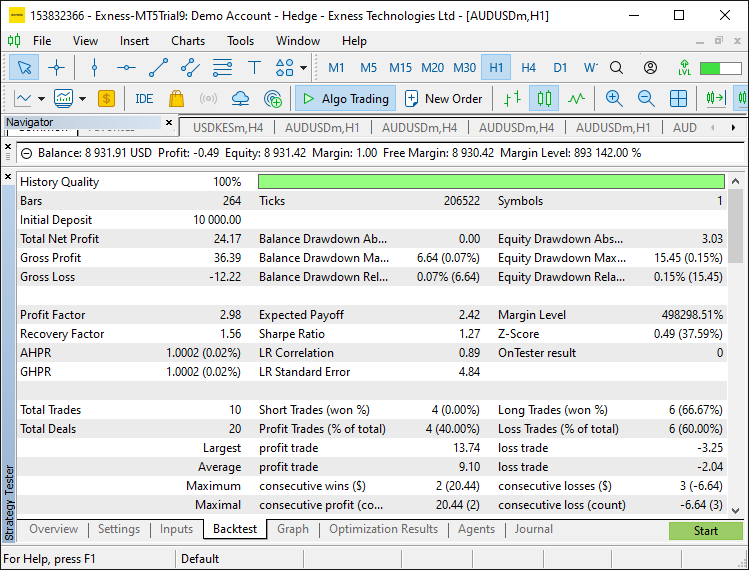
回测结果:
回测结果图形:
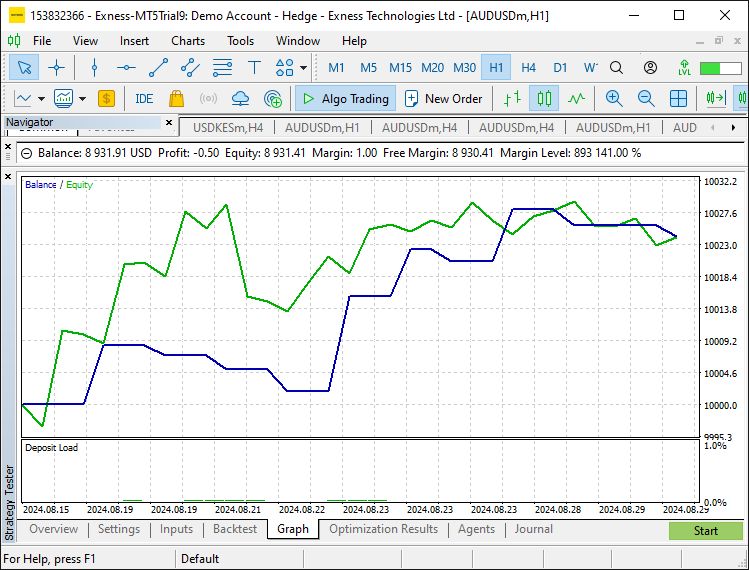
在测试阶段,我们对输入参数进行了优化,并使用策略测试器验证了该策略的表现。我们对输入参数所做的调整使交易策略更具灵活性。我们已经确认,在回测和优化该策略时,它能按照预期运行并取得良好的结果。
结论
总之,本文详细阐述了在MQL5中创建交易每日区间突破EA的分步方法。我们从EA的核心部分入手,使其能够计算每日价格区间并设定突破水平。这些核心部分对于确定价格可能突破当日区间的临界时刻(即突破前后的时刻)至关重要。
此外,我们还研究了如何实现各种 MQL5 函数,以监控市场状况、进行必要的价格比较,并在突破发生时立即采取行动执行交易。为了帮助交易者快速查看该策略所需的关键价位,我们在图表上添加了一些可视化工具——矩形和趋势线。在编写这些工具的代码时,我们确保它们具有一定的灵活性,因为该策略需要对输入参数进行大量调整。
我们使用MetaTrader 5的策略测试器对该策略进行了测试,评估其表现并进行调整,以便在我们的交易条件下使其运行得更好。祝编程愉快,交易成功!
本文由MetaQuotes Ltd译自英文
原文地址: https://www.mql5.com/en/articles/16135
注意: MetaQuotes Ltd.将保留所有关于这些材料的权利。全部或部分复制或者转载这些材料将被禁止。
本文由网站的一位用户撰写,反映了他们的个人观点。MetaQuotes Ltd 不对所提供信息的准确性负责,也不对因使用所述解决方案、策略或建议而产生的任何后果负责。
 交易中的神经网络:场景感知物体检测(HyperDet3D)
 让新闻交易轻松上手(第4部分):性能增强
 交易中的神经网络:探索局部数据结构
 开发回放系统(第 64 部分):玩转服务(五)
它看起来像一个众所周知的 "早晨平突破",而不是 "每日范围突破"(这是不同的),因此标题有误导性。
另外,我没有看到时区处理代码,因为根据服务器的格林尼治标准时间偏移量,定义突破范围的 "晨间平盘 "应从午夜 00:00 开始跟踪,而不是从偏移量开始跟踪。
它看起来像是众所周知的 "晨间平突破",而不是 "每日范围突破"(两者不同),因此标题具有误导性。
另外,我没有看到时区处理代码,因为根据服务器的格林尼治标准时间偏移量,定义突破范围的 "晨间平盘 "应从午夜 00:00 开始跟踪,而不是从偏移量开始跟踪。
感谢您的回复。这取决于使用的策略。我们使用的是每日范围突破,基本上从午夜运行到早上 6 点,当然也可以调整。谢谢。