Master Calendar Osw
- 지표
-
William Oswaldo Mayorga Urduy
 MQL4 and MQL5 trader and developer since February 2019, delivering projects in under one day and providing post-delivery technical support.
Optimized code, advanced logic, and high-quality code. - 버전: 2.1
- 업데이트됨: 9 11월 2024
- 활성화: 5
전문가용 사용자 설명서: Master Calendar OSW
본 설명서는 Master Calendar OSW의 작동 방식을 완벽하게 이해할 수 있도록 제작되었습니다. Master Calendar OSW는 경제 캘린더를 MetaTrader 플랫폼에 직접 통합한 고성능 펀더멘털 분석 콘솔입니다. 이 시스템은 데이터 표시뿐 아니라 통화 건전성 및 기관 유동성 주기 분석까지 제공합니다.
1. 소개 및 시스템 목적
Master Calendar OSW는 시장 상황 분석 도구입니다. 거시 경제 이벤트에 대한 맹목적인 거래를 방지하고 주요 금융 시장 개장 시 발생하는 확장 움직임을 활용할 수 있도록 지원합니다.
다른 지표와 달리, 이 시스템은 고급 차트 엔진을 사용하여 기술적 가격 분석을 방해하지 않고 정보를 이동, 축소 및 관리할 수 있습니다.
2. 매개변수 안내 (입력 메뉴)
지표를 로드하면 거래 환경을 사용자 지정할 수 있는 다음과 같은 옵션이 표시됩니다.
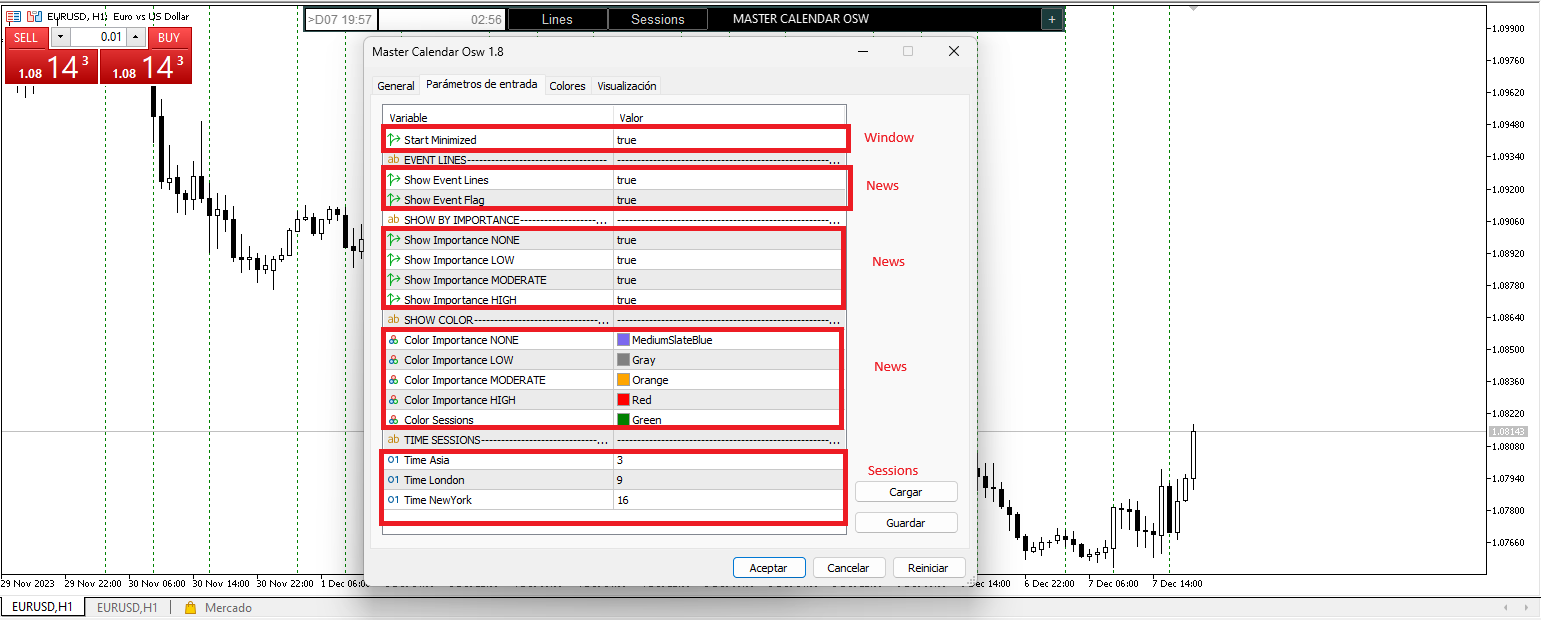
표시 및 이벤트 설정
InitMIN (최소화 시작): 시작 시 패널이 축소된 상태로 표시될지 여부를 정의합니다. 차트를 처음부터 깔끔하게 유지하는 데 이상적입니다.
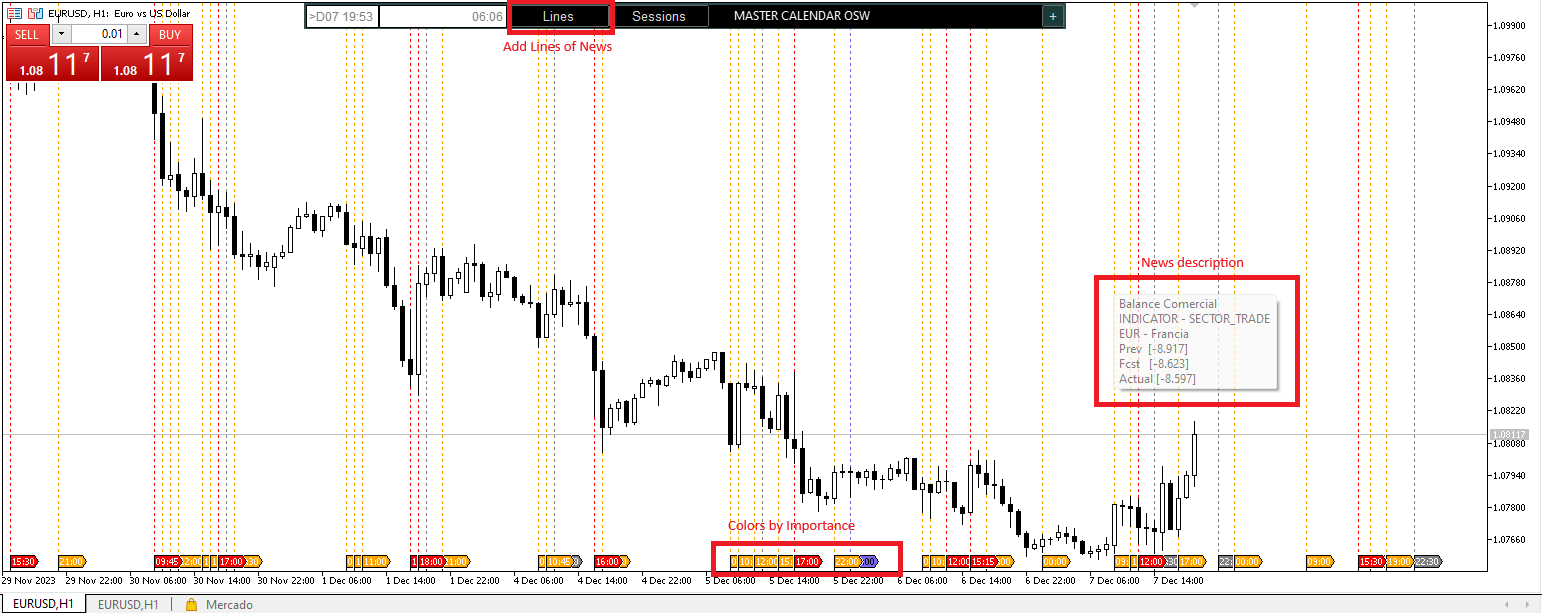
이벤트 라인 표시: 경제 지표 발표 시점을 정확하게 표시하는 자동 수직선을 활성화합니다.
플래그 이벤트 표시: 차트 하단에 유용한 아이콘 또는 "플래그"를 표시합니다.
중요도 및 색상 필터
예상 영향도(없음, 낮음, 보통, 높음)에 따라 표시할 뉴스를 필터링할 수 있습니다.
색상 중요도: 각 영향도 수준에 따라 색상을 사용자 지정할 수 있습니다. 기본적으로 빨간색(높음)은 최대 변동성을 나타내는 이벤트(예: 금리 결정 또는 고용 데이터)를 나타냅니다.
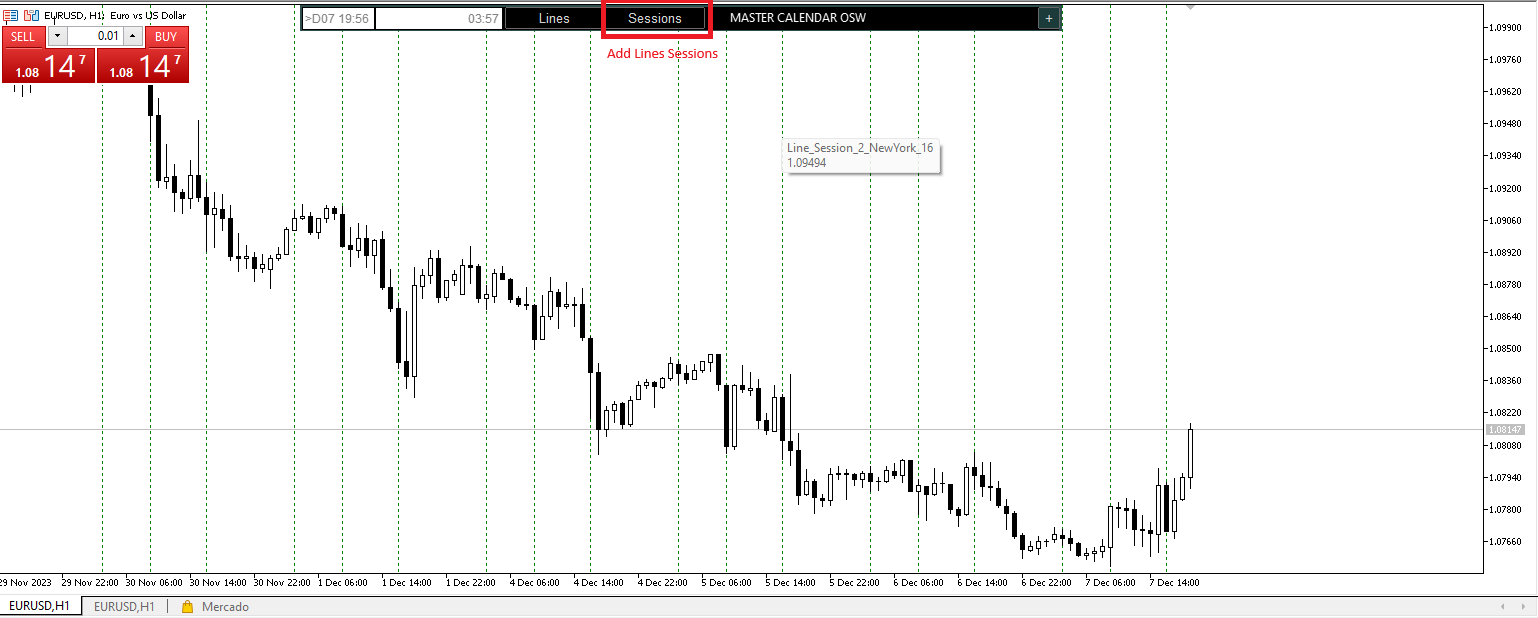
세션 색상: 거래일을 구분하는 선의 색상을 정의합니다.
시간 세션 관리
아시아/런던/뉴욕 시간: 브로커의 시계(Market Watch)에 따라 각 세션의 시작 시간을 설정합니다. 이는 "변곡점"을 파악하고 전문적인 거래량 진입을 하는 데 매우 중요합니다.
3. 그래픽 인터페이스 및 제어판
이 패널은 부드러운 상호 작용을 가능하게 하는 동적 렌더링 기술을 특징으로 합니다.
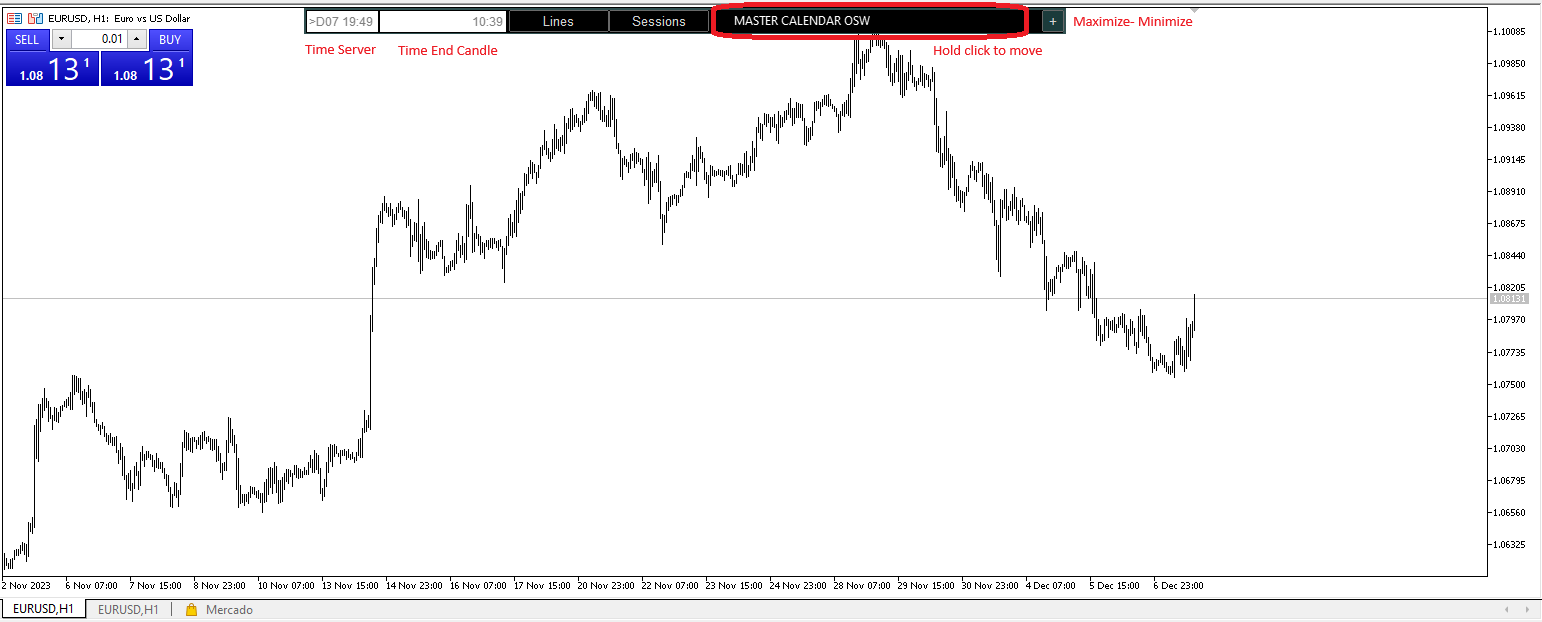
제목 표시줄 및 창 관리
자유로운 이동: 상단 막대("MASTER CALENDAR OSW")를 클릭하고 드래그하여 화면의 원하는 위치에 패널을 배치할 수 있습니다.
최소화(-): 패널을 축소하여 제목 표시줄과 시계만 표시합니다.
닫기(X): 현재 차트에서 지표와 모든 그래픽 개체를 제거합니다.
시계 및 시간 표시
패널의 왼쪽 상단에는 다음 정보가 표시됩니다.
서버 날짜: 거래 플랫폼의 정확한 날짜입니다.
캔들 시계: 현재 캔들이 마감될 때까지 남은 시간을 표시합니다(M15 또는 H1과 같은 시간 프레임에서 진입을 확인하는 데 필수적입니다).
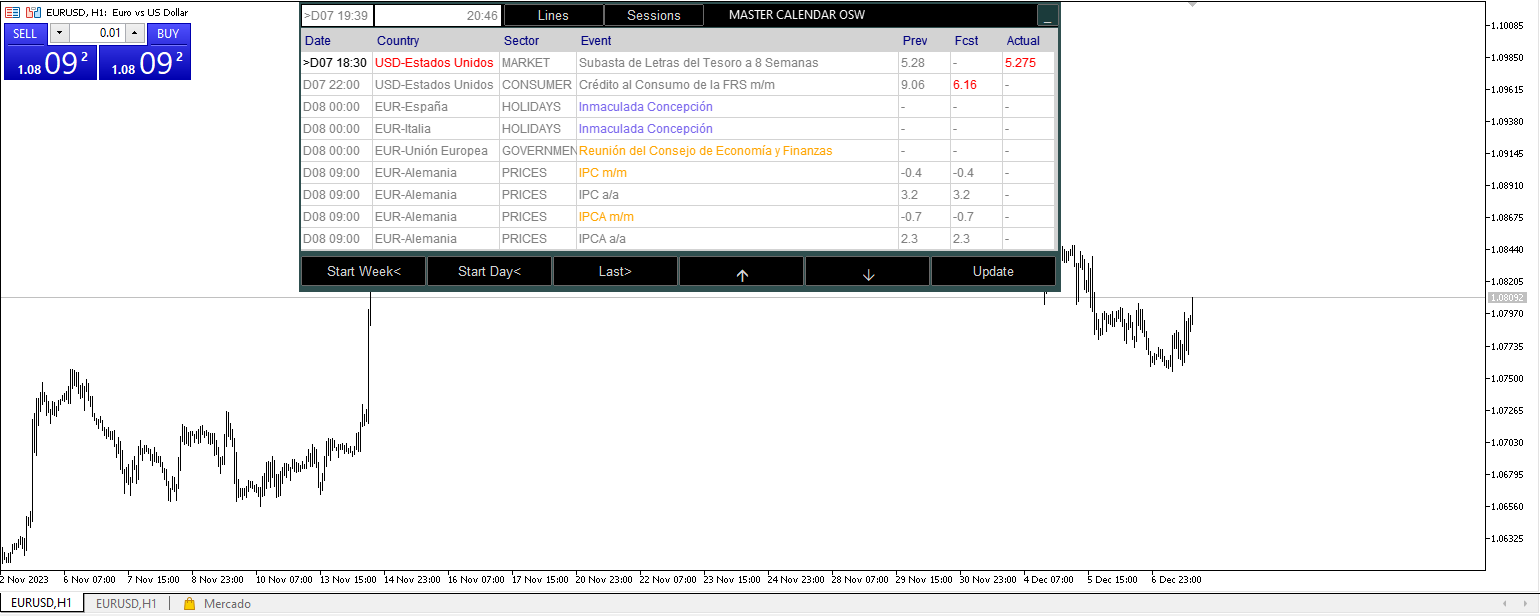
4. 표 해석 및 색상 논리
이 지표의 핵심은 자동 색상 변화를 통해 즉각적인 시각적 분석을 제공하는 기능입니다.
경제 데이터 논리(이전/예상/실제)
시스템은 현재 결과를 이전 데이터와 비교하여 통화의 건전성을 측정합니다.
파란색(긍정적): 현재 값이 이전 값보다 높습니다. 이는 잠재적인 강세를 나타냅니다.
빨간색(부정적): 현재 값이 이전 값보다 낮습니다. 이는 잠재적인 약세를 나타냅니다.
회색(중립): 큰 변화가 없거나 데이터가 이전 값과 일치합니다.
통화 및 국가 식별
뉴스로 인해 특정 통화가 강세를 보이면 국가 및 통화 이름이 파란색으로 표시됩니다. 약세를 보이면 빨간색으로 표시됩니다. 이를 통해 뉴스 제목을 읽지 않고도 거래 중인 통화쌍에 미치는 영향을 파악할 수 있습니다.
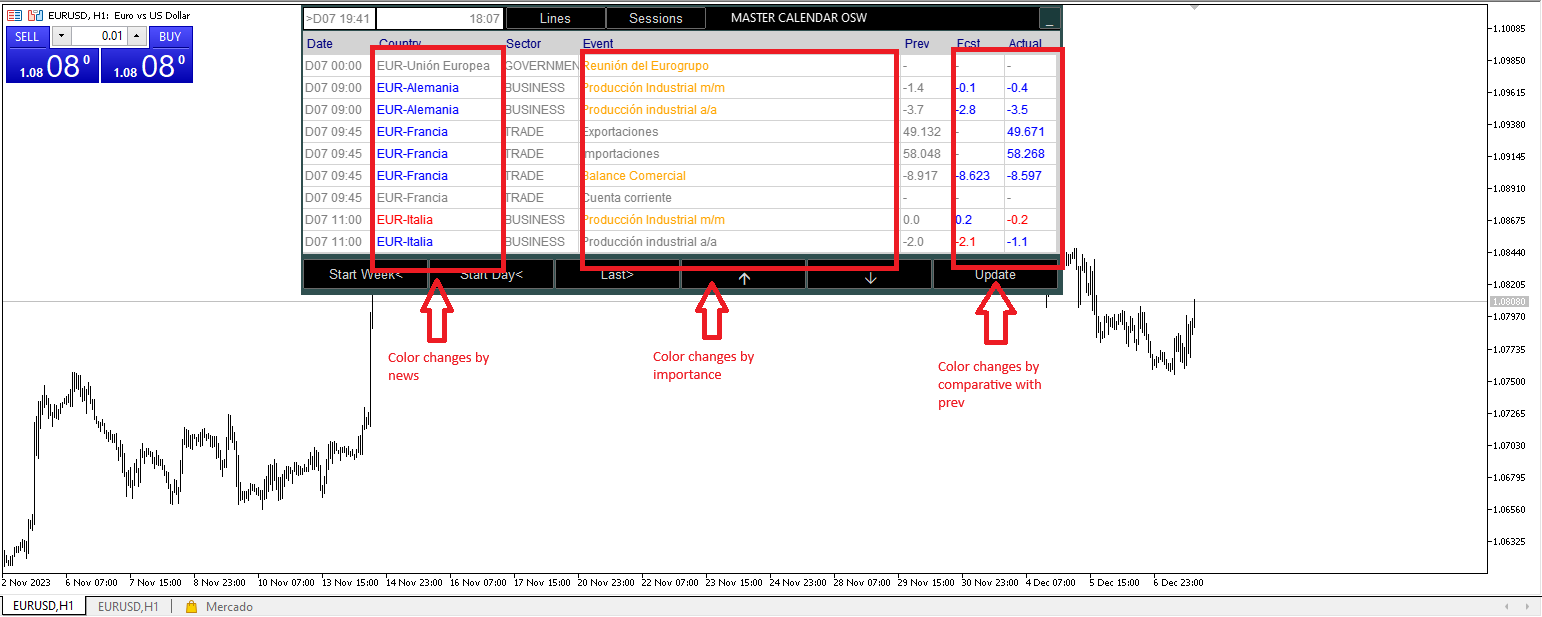
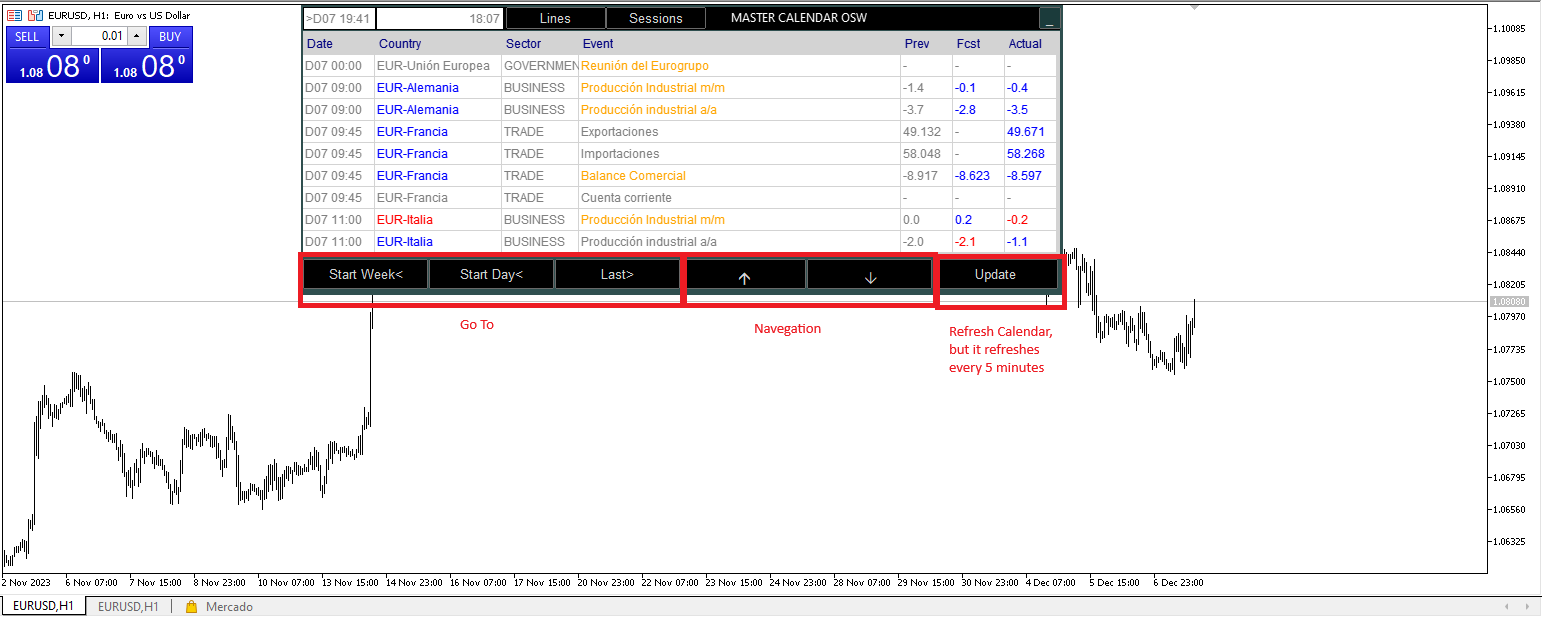
5. 버튼 및 사용 안내
패널 하단에는 시장 내역 및 향후 데이터를 탐색할 수 있는 버튼 모음이 있습니다.
라인: 차트에 세로 뉴스 라인을 표시/숨깁니다. 마우스 커서를 올리면 모든 이벤트 세부 정보가 포함된 툴팁이 표시됩니다.
세션: 아시아, 런던, 뉴욕 시장의 시가 라인을 표시/숨깁니다.
화살표: 시각적 가격 신호를 활성화합니다. 데이터가 매우 긍정적이면 매수 화살표가, 매우 부정적이면 매도 화살표가 표시됩니다.
주 시작/일 시작: 해당 주의 첫 번째 이벤트 또는 현재 날짜의 첫 번째 이벤트로 자동 이동합니다.
최근: 가장 최근 뉴스 항목으로 이동합니다.
위/아래: 행 단위로 스크롤하여 과거 또는 미래 이벤트를 살펴볼 수 있습니다.
업데이트: 서버에서 데이터를 수동으로 업데이트합니다(시스템은 기본적으로 5분마다 자동으로 업데이트됩니다).
6. 거래 추천
세션 컨플루언스: 런던 또는 뉴욕 개장 시간에 발생하는 영향력 높은 뉴스(빨간색)를 활용하여 거래하세요. 이 시간대가 성공 확률이 가장 높습니다.
팝업 도움말 활용: 뉴스 항목에 대해 궁금한 점이 있으면 차트의 세로선 위에 마우스를 올려놓으세요. 시스템에서 팝업 창을 통해 해당 국가, 중요도, 그리고 값(이전/예상/실제)을 보여줍니다.
템