Ticks and Points Candles MT4
- Indicators
- Version: 4.12
- Updated: 24 April 2020
- Activations: 5

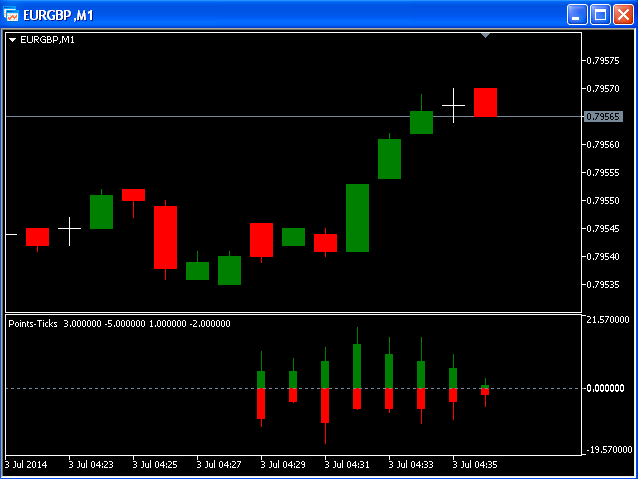
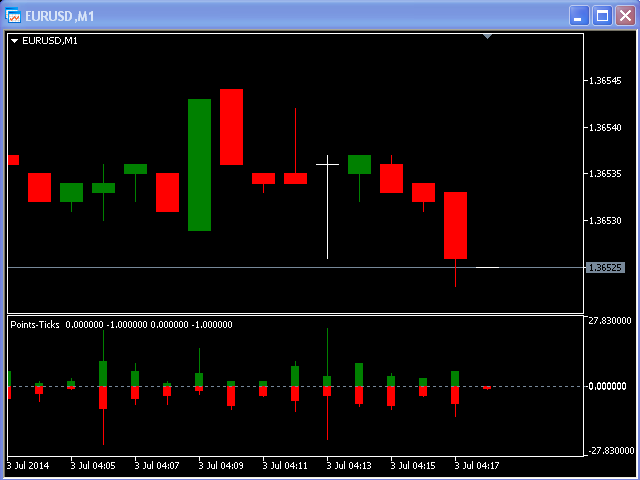
This indicator is designed for M1 time-frame and shows:
- Sum of ticks when the price goes up (color Green -The major component of a candlestick = the body).
- Sum of points when the price goes up (color Green -The extension lines at the top of the candle).
- Sum of points when the price goes down (color Red -The major component of a candlestick = the body).
- Sum of points when the price goes down (color Red -The extension lines at the lower end of the candle).
Keep in mind that Sum of Points will be greater or equal to Sum of Ticks.