Ticks and Points Candles MT4
- Indikatoren
- Version: 4.12
- Aktualisiert: 24 April 2020
- Aktivierungen: 5

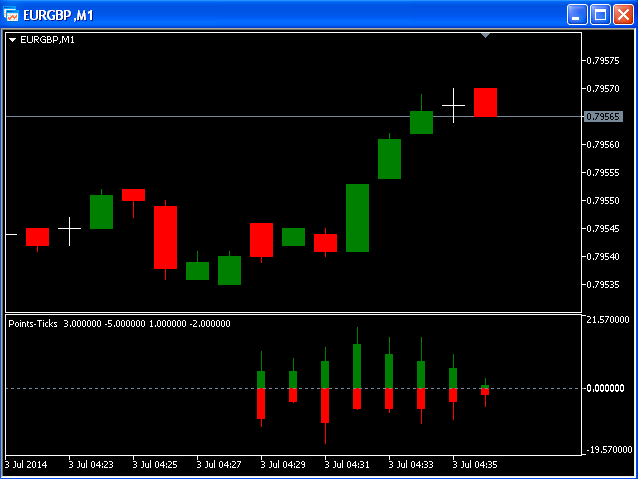
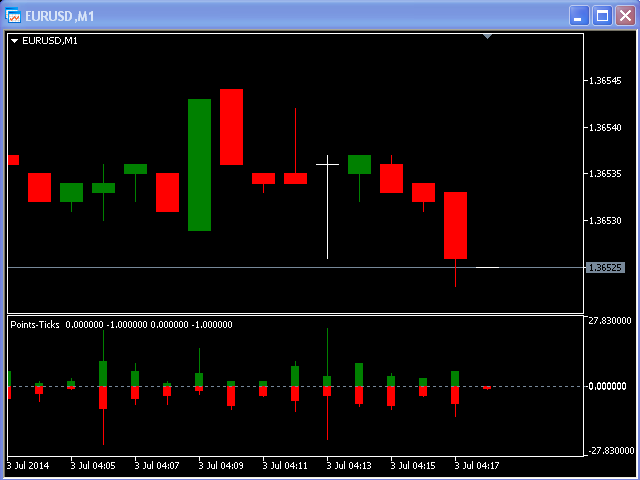
Dieser Indikator ist für den M1-Zeitrahmen konzipiert und zeigt an:
- Die Summe der Ticks, wenn der Preis steigt (Farbe Grün - Die Hauptkomponente einer Kerze = der Körper).
- Summe der Punkte, wenn der Preis steigt (Farbe Grün - Die Verlängerungslinien am oberen Ende der Kerze).
- Summe der Punkte, wenn der Kurs sinkt (Farbe Rot -Die Hauptkomponente einer Kerze = der Körper).
- Summe der Punkte, wenn der Preis nach unten geht (Farbe Rot - Die Verlängerungslinien am unteren Ende der Kerze).
Beachten Sie, dass die Summe der Punkte größer oder gleich der Summe der Ticks ist.