Ticks and Points Candles MT4
- Indicadores
- Versión: 4.12
- Actualizado: 24 abril 2020
- Activaciones: 5

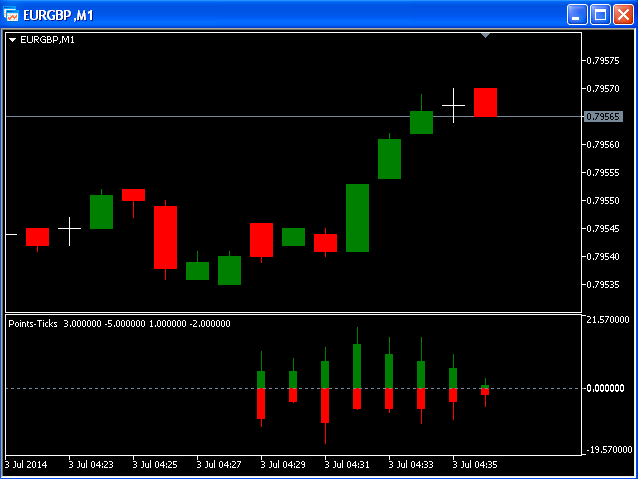
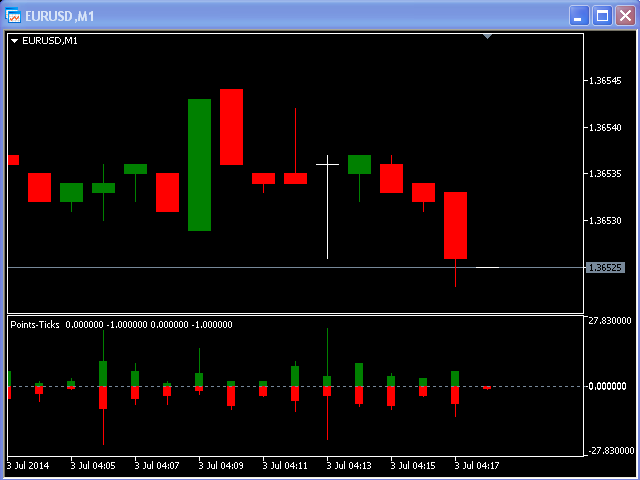
Este indicador está diseñado para el marco de tiempo M1 y muestra:
- Suma de ticks cuando el precio sube (color Verde -El componente principal de una vela = el cuerpo).
- Suma de puntos cuando el precio sube (color Verde - Las líneas de extensión en la parte superior de la vela).
- Suma de puntos cuando el precio baja (color Rojo -El componente principal de una vela = el cuerpo).
- Suma de puntos cuando el precio baja (color Rojo -Las líneas de extensión en el extremo inferior de la vela).
Tenga en cuenta que la Suma de Puntos será mayor o igual a la Suma de Ticks.