Alert Wick Scanner and Dashboard
- Indicators
- Version: 1.0
- Activations: 5

WICK BAR ALERT!!!! WICK BAR ALERT!!!
Now you dont have to worry about going through each currency pair, your favorite
stocks watch list or crypto to find
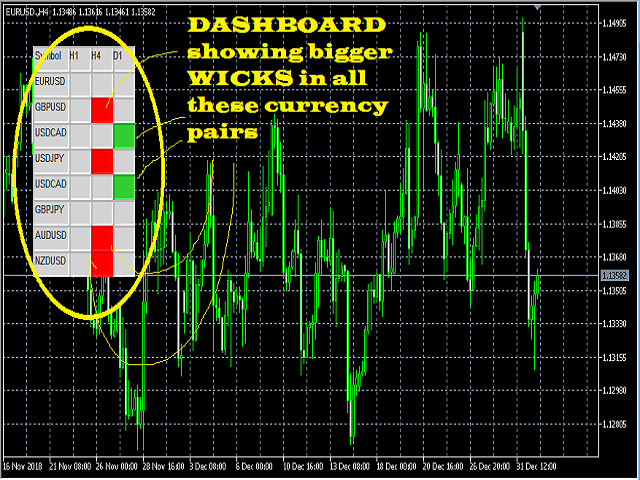
WICK BAR CANDLES (also called LONG TAIL BARS). This indicator does everything for you.
This
indicator has the capability to
SCAN different CURRENCY PAIRS and TIMEFRAMES to give you LONG TAIL
CANDLE (LONG WICK BAR) information through ALERT (MOBILE NOTIFICATION, EMAIL AND PUSH NOTIFICATION)
NOTE:
If you are willing to scan more currency pairs along with many timeframes, you need to have a heavy system because the indicator would have to
go through all the combinations to find you your preferred LONG TAIL CANDLE (WICK BAR) settings
PARAMETERS:
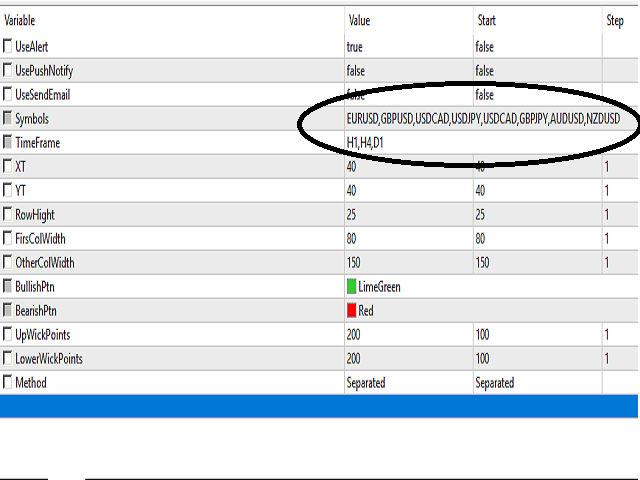
UseAlert: true/false
USEPushNptifify: true/false
UseSendEmail: true/false
SYMBOLS: You
can add as many symbols as you want
NOTE: You have to add symbols along with a comma , in between each currency pair like GBPUSD,EURUSD,USDJPY.
If your broker uses symbols in currency pairs, for example if the broker offers symbols EURUSD# and GBPUSD#, you can add like
this
EURUSD#,GBPUSD#,USDJPY#
TIMEFRAME: You can add as many timeframes as you want on which you want to check LONG
WICK BAR of your symbols
NOTE: You have to add symbols with a comma , in between each timeframe alloted for example m15,m30,h1,h4
XT: Horizontal
Position of the dashboard
YT: Vertical Position of the dashboard
Row Height: The height of the Dashboard
FirstColWidth: The
width of the Column
OtherColWidth: The width of the Color of currency pair (Bearish or Bullish)
BULLISHPTN: The
bullish pattern color. Default as
LIMEGREEN
BEARISHPTN: The bearish pattern color. Default as RED
WICK BAR SETTINGS
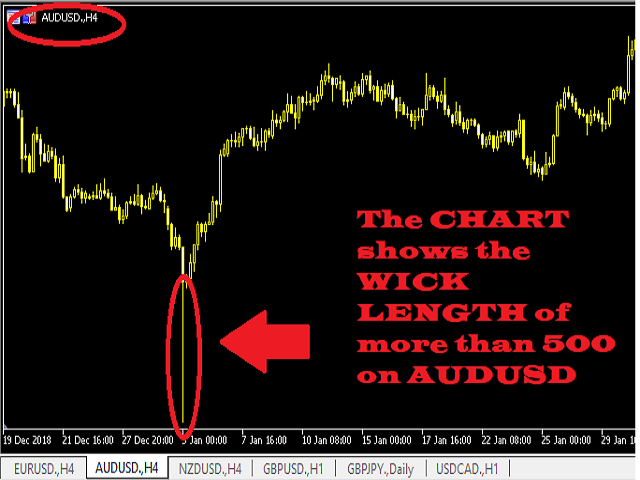
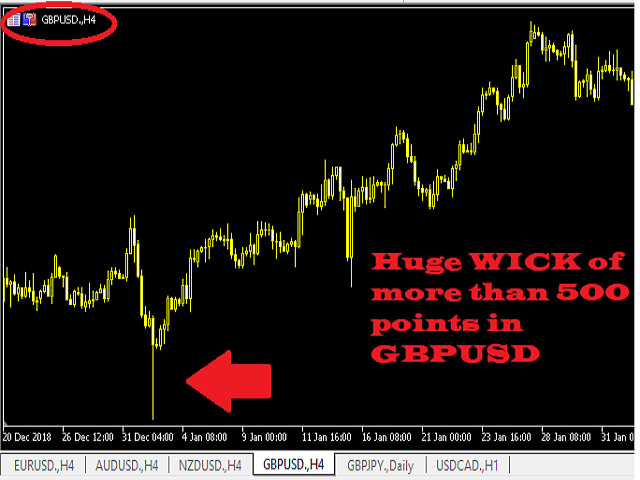
UPWICK
POINTS: The Amount in Points you want the candles to be filtered. If set to 200, candle with larger than 200 points in form of WICK will be
highlighted
LOWERWICK POINTS: The Amount in Points you want the candles to be filtered. If set to 200, candle with larger than 200 points
in form of
WICK will be highlighted
METHOD: Keep this default settings to Separated
Absolutely not to be used. The signal is not supplied after candle closure. You don't get an answer either. Do not buy and save money is useful here. Too bad for my money.