MTF Trend Map
- Indicators
- Version: 1.0
- Activations: 5
"Switching timeframes just to check the higher trend direction is such a hassle..."
This product is made for you!!
Trend Map
- Product Overview
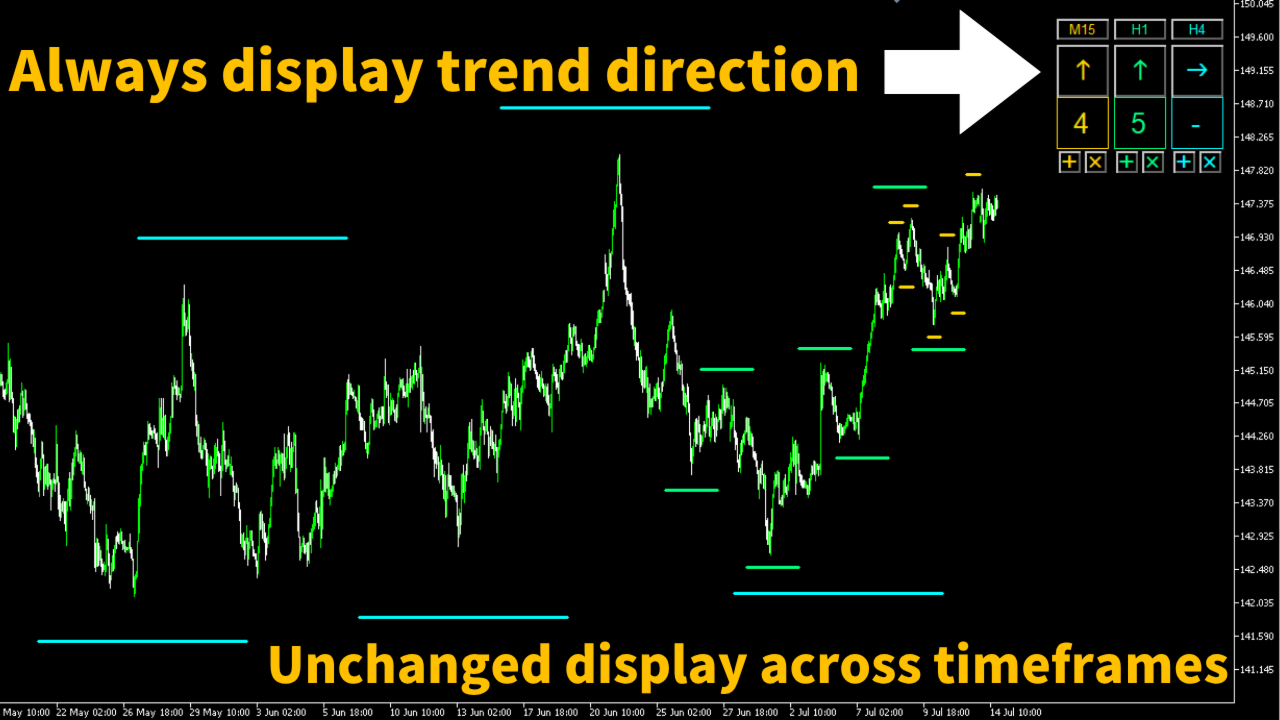
This tool records and displays the trend direction of each timeframe (or fractal structure) directly on your chart. The panel remains visible even when you switch timeframes, making it ideal for traders who frequently change timeframes. With quick trend recognition, you can trade with less stress. Additionally, with just one click, you can create or delete high/low lines for each timeframe. This is not an automated trading system; it’s a support tool for manual trading.
- Feature Description
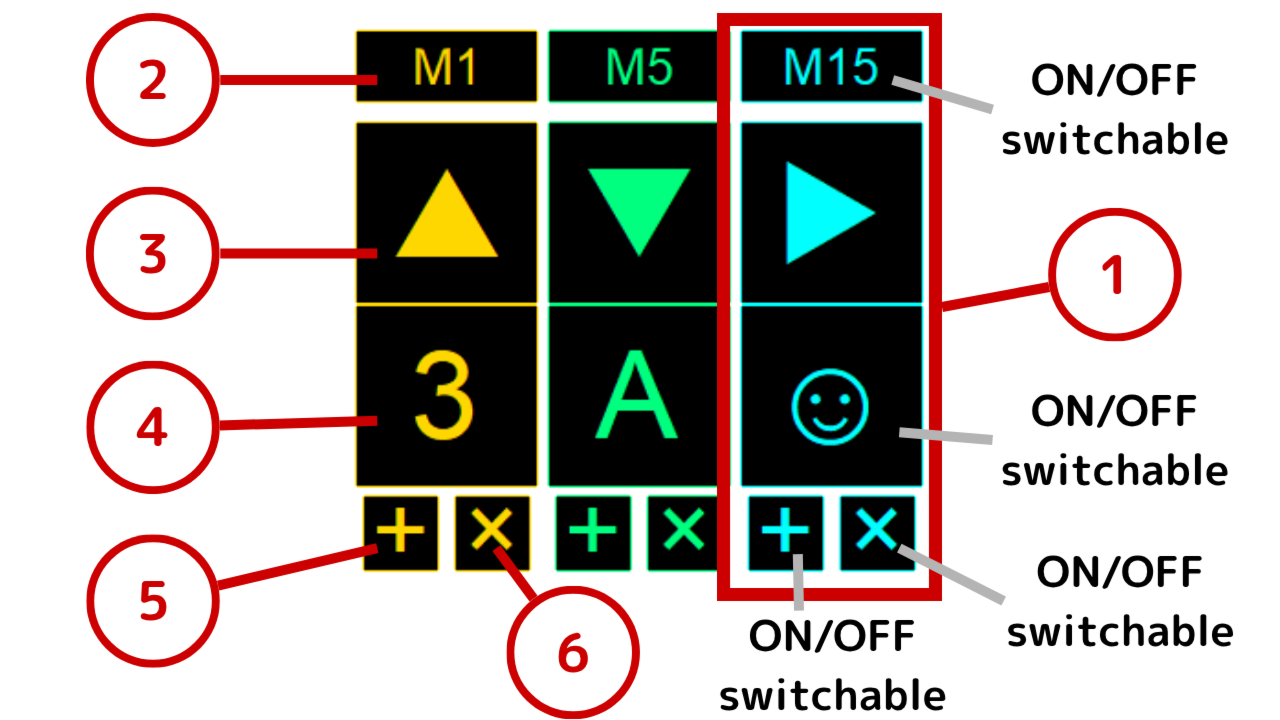
1. Panel Unit
A vertical unit in the panel UI. You can display up to 10 units. Each unit can have its own theme color.
2. Description Label
The top label in each panel unit. You can set any text such as timeframe names. You can also turn it off via settings.
3. Arrow Button
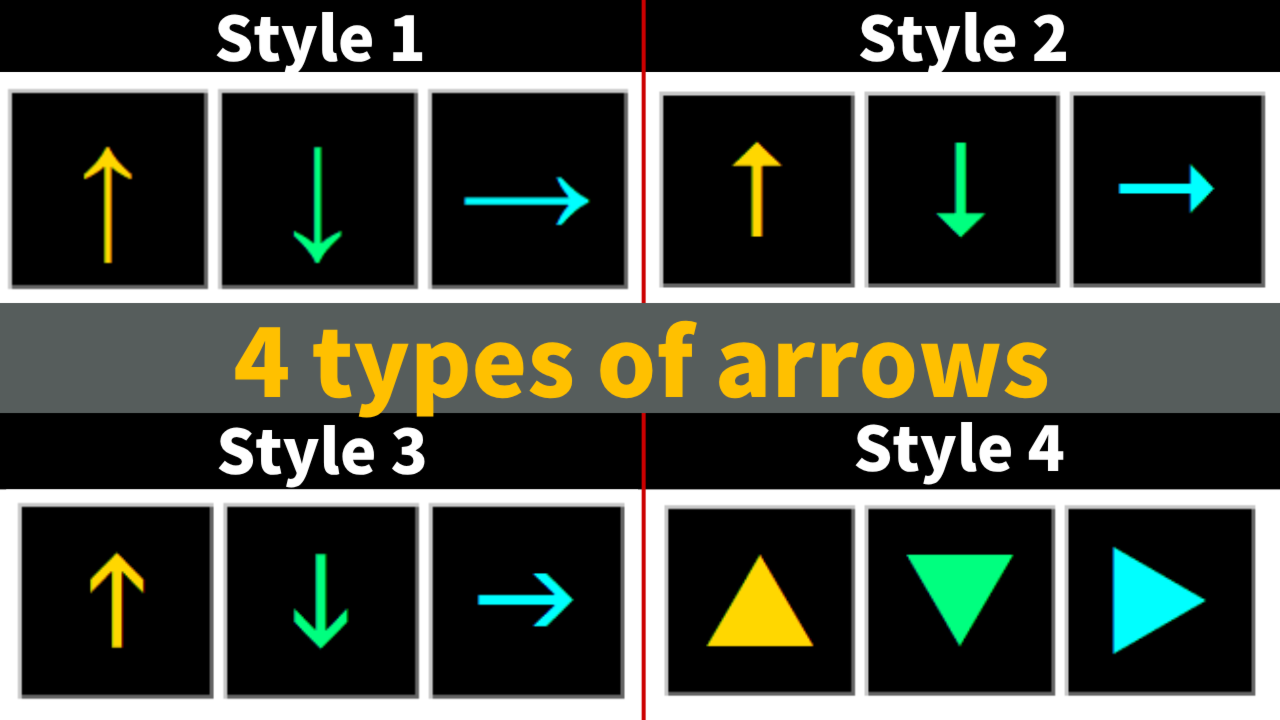
Displays arrows representing the trend direction: Uptrend (↑), Downtrend (↓), or Range (→). You can toggle these by clicking the button. There are four arrow styles available, selectable in settings.
4. Text Box
A free text input field. You can use it for wave counts in Elliott Wave Theory or anything else. Display can be toggled in settings.
5. Add Line Button
Each panel unit has a “+” button to create lines in the unit’s theme color. Display can be toggled in settings.
6. Delete Line Button
Each panel unit also has a “×” button. When clicked, a confirmation dialog appears, and pressing “Yes” will delete all lines created by the Add Line button in that unit. Display can be toggled in settings.
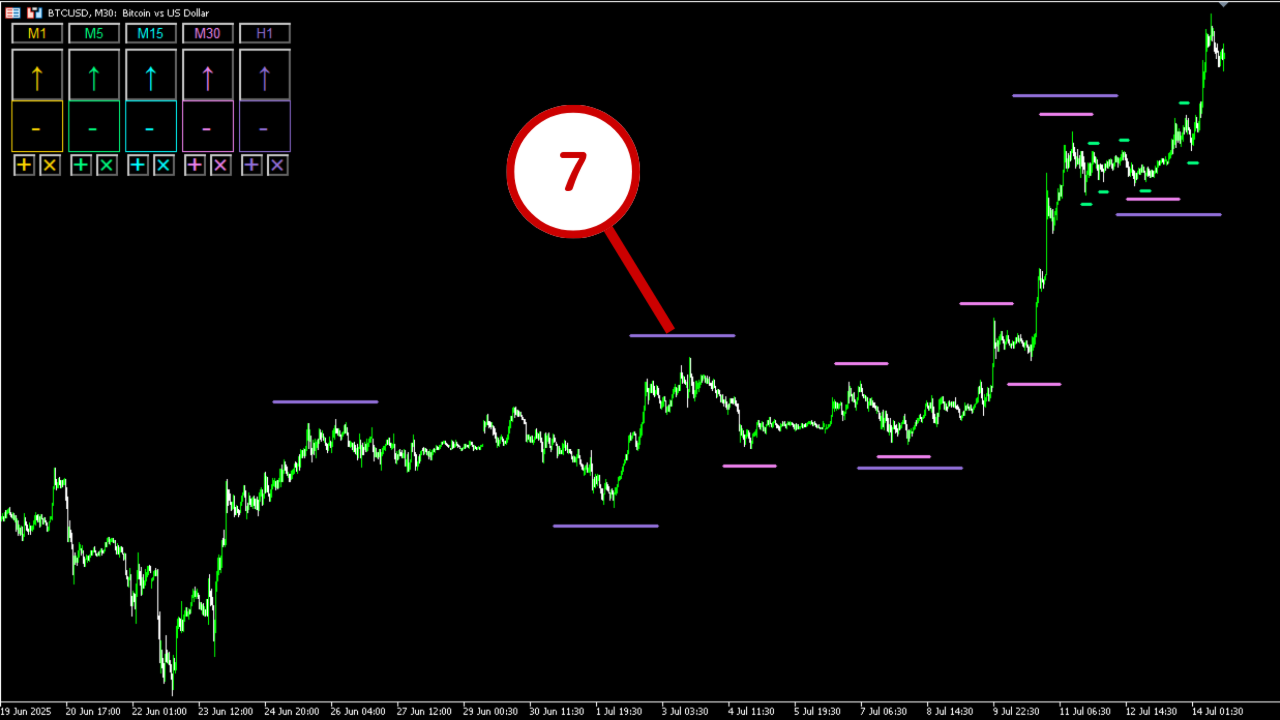
7. Line
Parallel trendlines created via the Add Line button. By placing them on highs/lows, you can visually confirm your market structure understanding. Line length and thickness are adjustable in settings.
- Supported Environments
Platform: MetaTrader 5 (MT4 is not supported)
Timeframes: All timeframes supported
Symbols: All currency pairs supported
- Parameter Settings
・Panel Settings
Set the number of panel units (up to 10) and their display position.
・Display Settings
Choose from 4 arrow styles. Toggle visibility for labels, text boxes, add/delete line buttons.
※ Style 1 uses the "Arial" font. Styles 2–4 use "Wingdings 3", which is standard on Windows but not on macOS. Mac users need to install "Wingdings 3" manually if they want to use these styles.
・Panel Unit Settings
Adjust the width of each panel unit and the height of each component.
・Label Text
You can set custom text for each description label. Variables are numbered from left to right (e.g., LabelText2 sets the second panel from the left).
・Theme Color
Set the theme color for each panel unit. This color is also used for the lines created by the Add Line button.
・Sub Colors
Set up to 5 additional sub-colors aside from the theme color. They can be used similarly in UI elements.
・Font Size
Set font size for each component individually (label, arrow button, text box, etc.).
・Text Color Type
Choose text colors for each element from among the theme and sub-colors. Arrow buttons can have individual colors for up/down/side (e.g., green up, red down, gray side).
・Background Color Type
Set background colors for each component from among theme and sub-colors.
・Border Color Type
Set border colors for each component from among theme and sub-colors.
・Line Settings
Set the length (in candle count) and thickness of the lines generated by the Add Line button.
- Notes
・This is an indicator, not an Expert Advisor (EA).
・Arrow styles 2–4 use “Wingdings 3.” Mac users must install this font manually to use these styles.
・No refunds are provided. Please purchase carefully.
- Future Plans
We plan to enhance functionality and release other helpful tools and indicators. Feel free to follow us if you’re interested!
※ Price and availability are subject to change.
- FAQ
Q1. Can I add unlimited lines?
A1. There’s no fixed limit, but too many objects on the chart can cause MT5 to slow down or behave unstably.
Q2. I clicked the Add Line button, but no line appeared. Why?
A2. If the right edge of the line would be off-screen, it won’t be drawn. In this case, zoom out the chart and try again.
Q3. I clicked the Delete Line button, but the line wasn’t removed. Why?
A3. Lines are only deleted if they were:
・Created by the same unit’s Add Line button
・Matching the theme color of the unit
If either condition is not met, the line won’t be removed. Also, copied lines cannot be deleted.
Q4. Can I use this with other indicators or EAs?
A4. Generally yes, but conflicts may occur if other tools use the same resources. Check settings to avoid conflicts.
- Support
Please leave comments in the community if you have any questions.
We’ll respond to requests and bug reports as quickly as possible.