Volume Profile POC
- Indicators
- Version: 1.5
- Updated: 11 September 2026
- Activations: 10

Volume Profile POC
POC stands for Point of Control: the price level where the highest volume was traded within the analyzed period — the region that most interested buyers and sellers, and which frequently acts as a price magnet, support or resistance.
Real-Time Volume Profile, Adapted to Every Timeframe
Volume Profile POC calculates and draws the volume profile directly on your chart, showing exactly at which price levels the market traded the most. Unlike generic indicators, it automatically adapts to the timeframe you're using, following the same reference logic as MetaTrader 5 itself:
- M1 to M30 → calculation based on the start of the current day.
- H1 to H4 → calculation based on the start of the current week.
- D1 → calculation based on the start of the current month.
- W1 and MN1 → calculation based on the start of the current year.
This ensures the volume shown always makes sense for the period being analyzed, with no "cluttered" bars or inconsistent ranges when switching timeframes.
Historical Volume Profiles
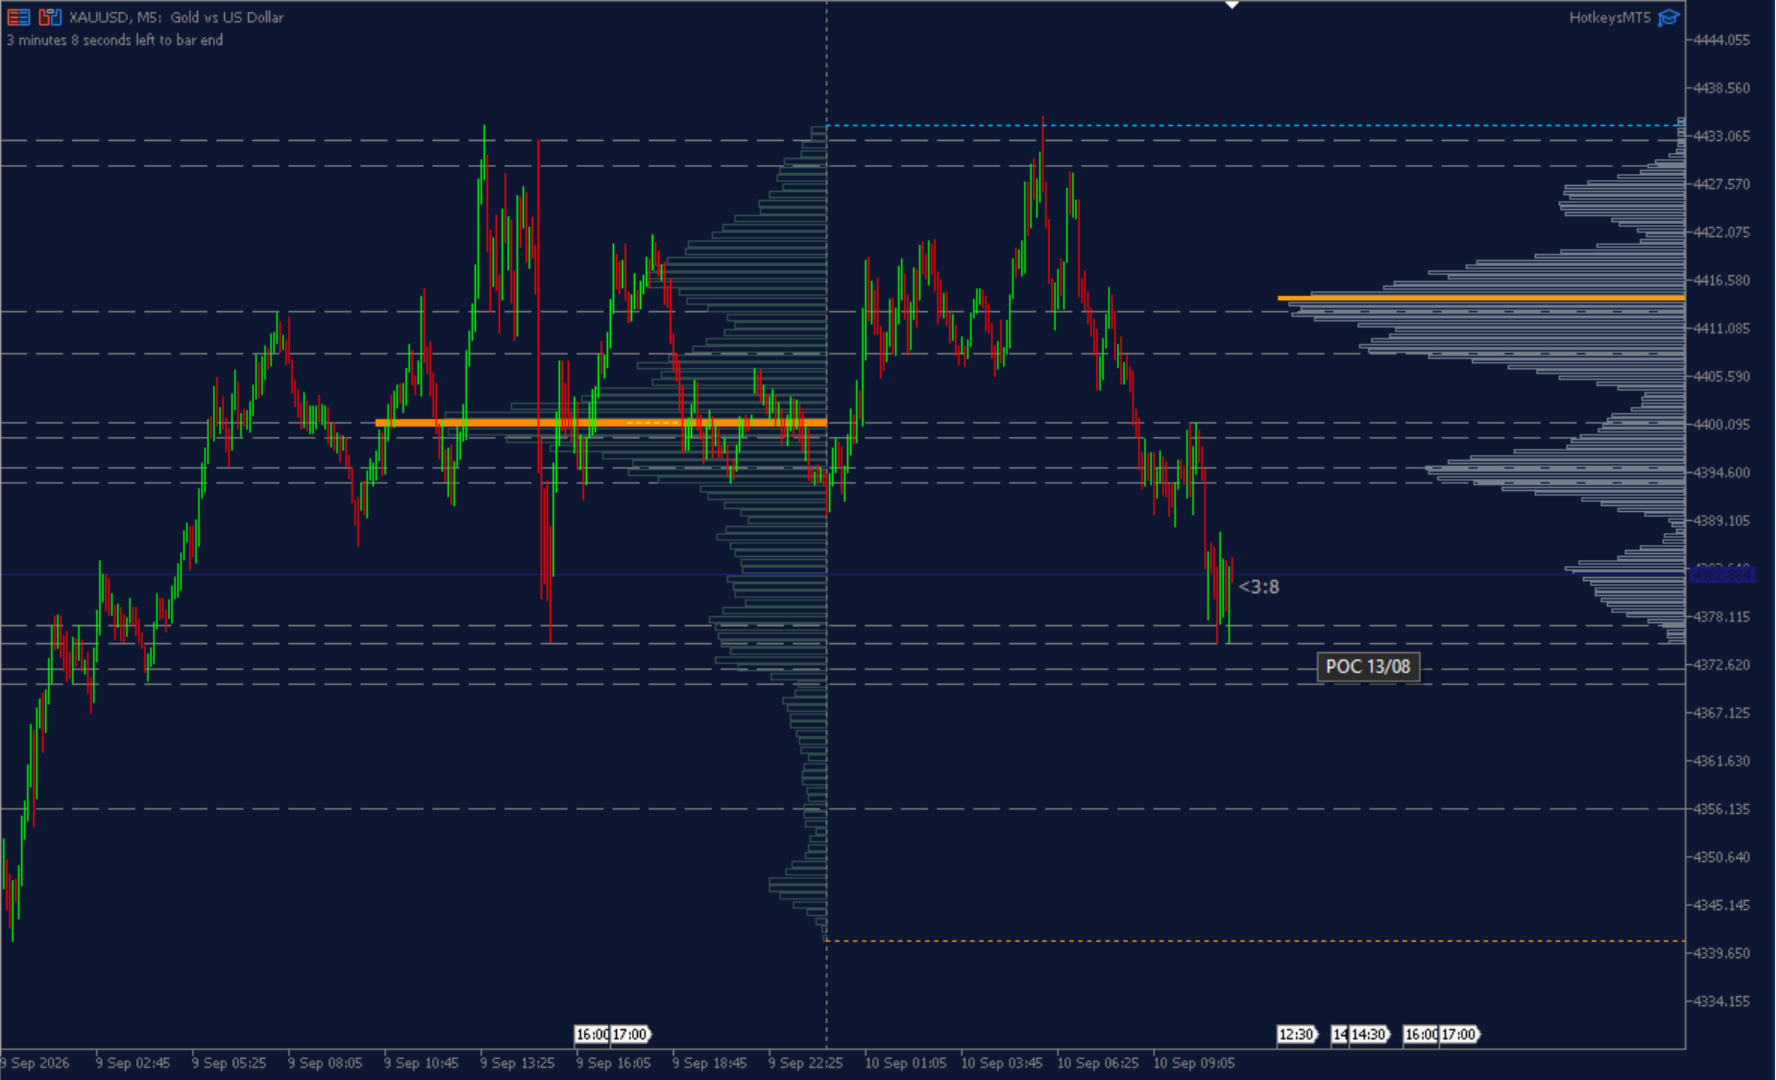
In addition to the current period, the indicator can also plot the volume profile of previous periods directly on the chart, letting you compare where volume concentrated in past sessions against the current one — each historical profile keeps its own POC clearly highlighted.
POC Reference Levels (Horizontal Lines)
For traders who work with levels rather than full profile shapes, the indicator can also draw simple horizontal lines marking the POC of previous days. You choose how many days back to display, and freely customize the color, style, and thickness of each line — with a tooltip showing the corresponding date when you hover over it. This feature works independently from the historical volume profile display above, so you can use either one, both, or neither.
Instant Updates, No Freezing
The indicator was built to stay always in sync with the market:
- Recalculates the volume profile on every tick, avoiding any delay during fast price moves.
- Updates automatically when you switch timeframes, without needing to wait for a new tick.
- Smart retry system: if the symbol's history is still synchronizing, the indicator waits and tries again on its own, without freezing or displaying incomplete data.
Two Display Modes: Manual or Automatic
You choose how you want to control the "stretch" (maximum length) of the volume bars on screen:
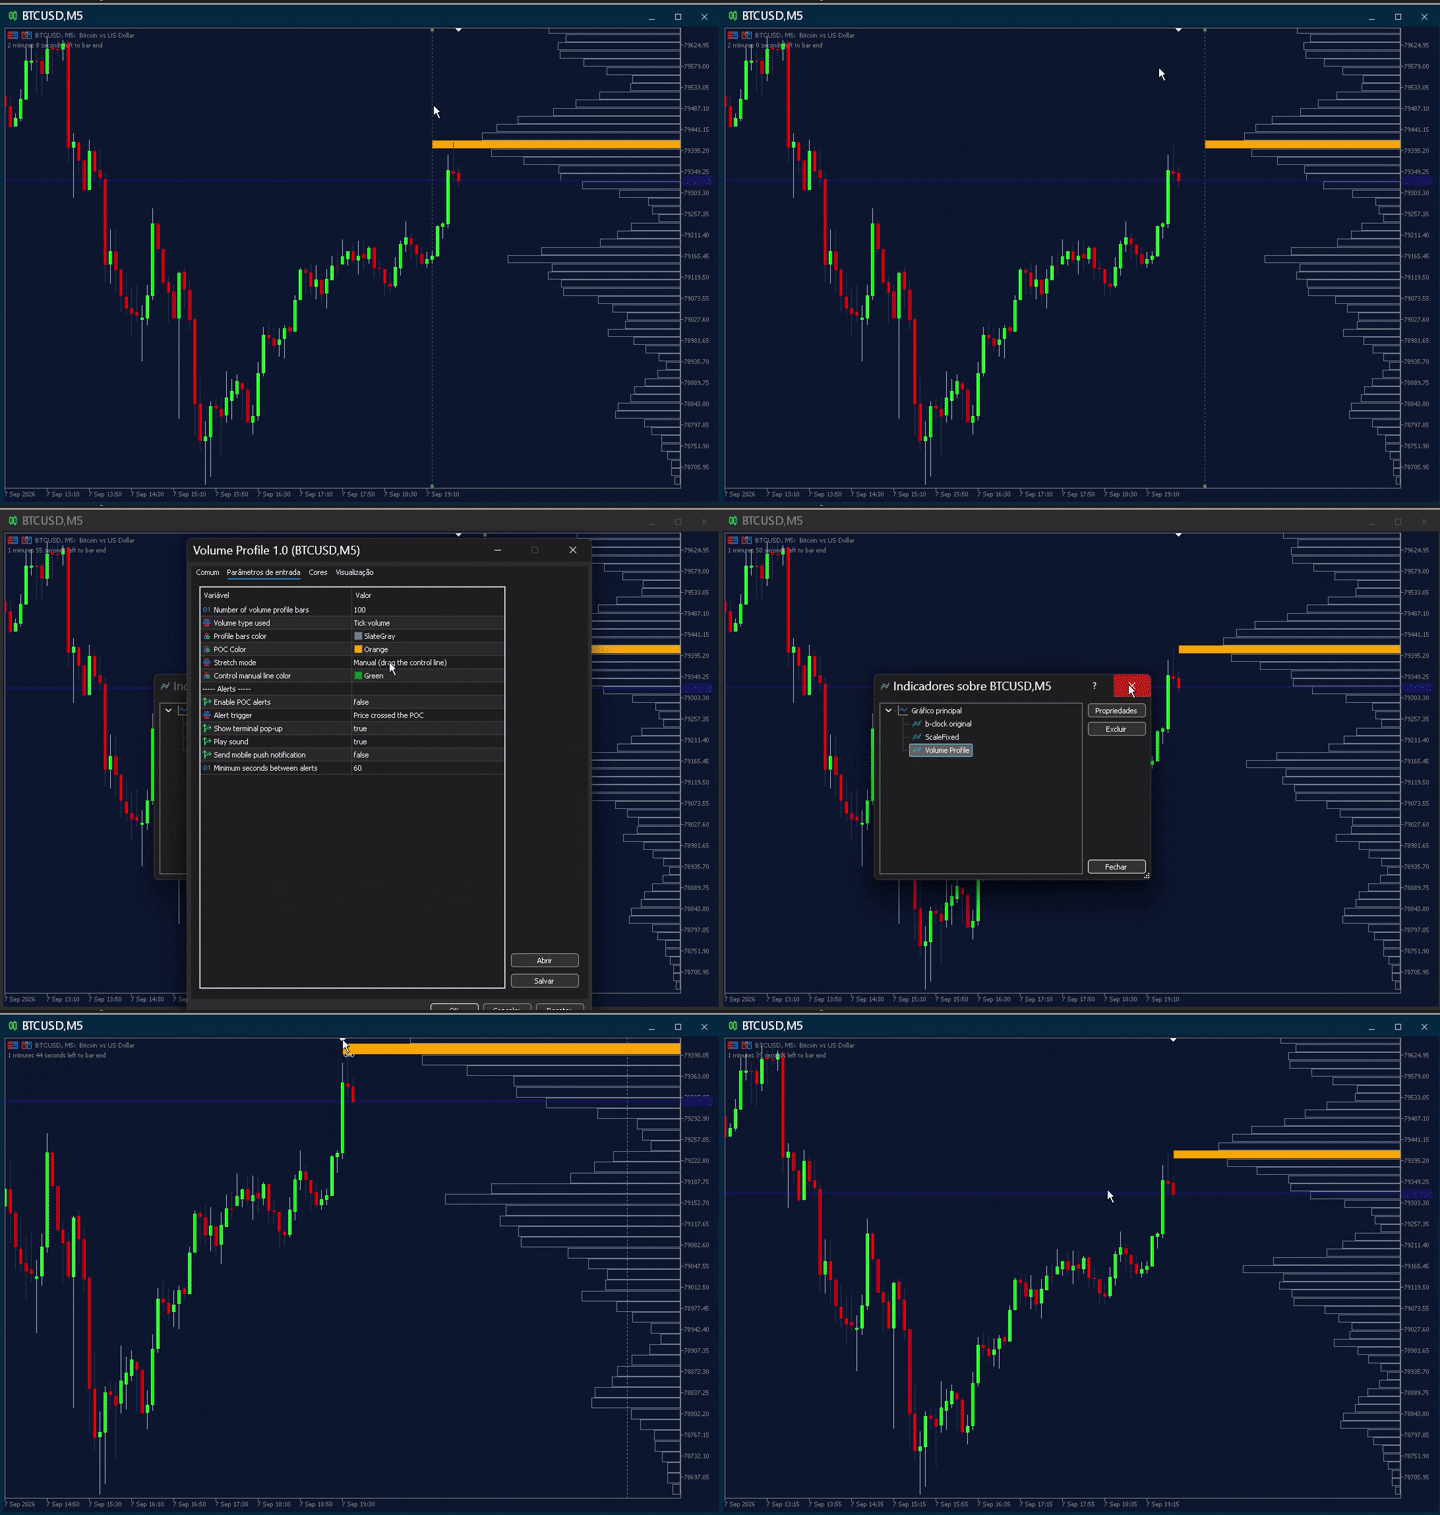
Manual Mode (Stretch Mode = Manual): A draggable vertical line appears on the chart. By moving it left or right, you freely control how much the volume bars stretch, exactly the way you prefer.
Automatic Mode (Stretch Mode = Automatic): The indicator enables MT5's "Chart Shift" space and uses that reserved area as a fixed limit. The volume bars automatically stretch up to that point — no manual line needed, and no risk of candles invading the volume area or vice versa.
Mirrored and Anchored Volume
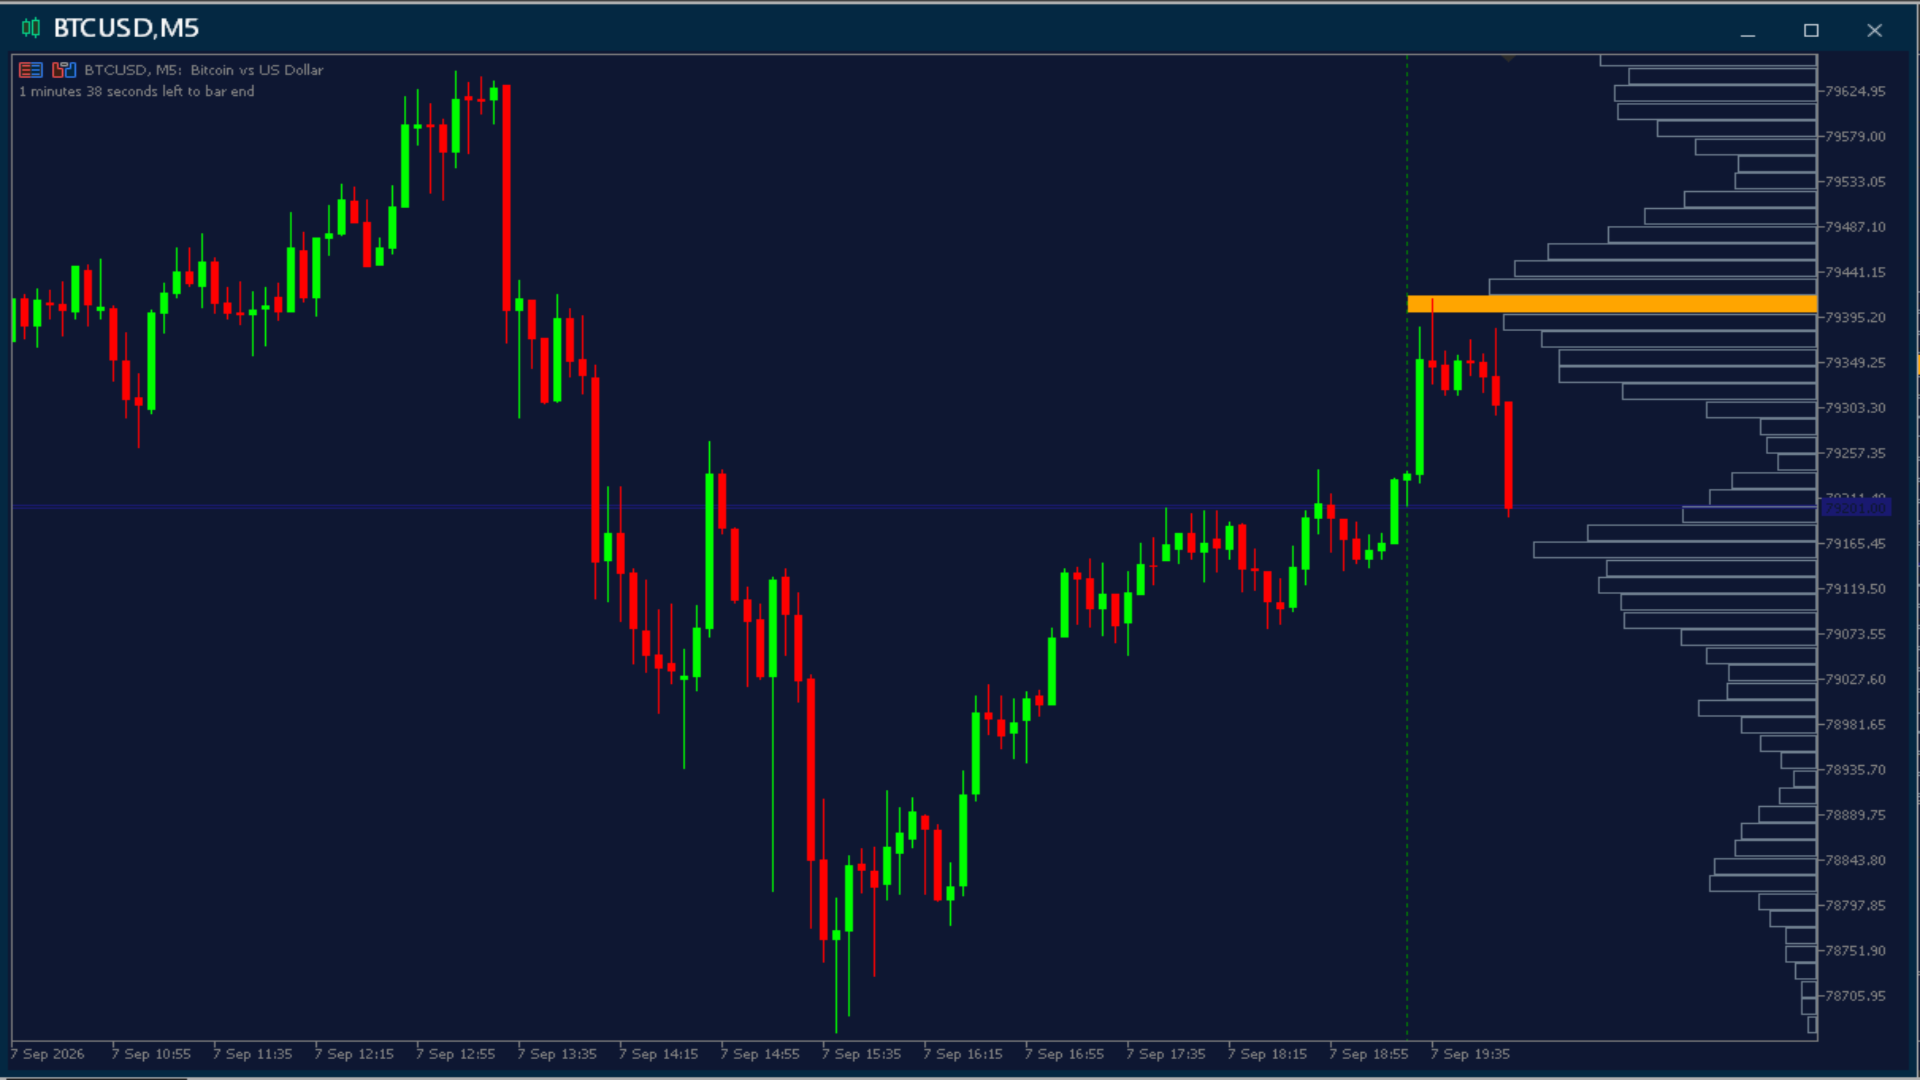
The volume profile is always drawn anchored to the right edge of the chart, growing to the left (mirrored effect). This keeps the visualization clean and organized, with the Point of Control (POC) always highlighted in a distinct color.
POC Alerts: Never Miss an Important Move
Enable alerts to be automatically notified whenever something relevant happens at the Point of Control. You choose exactly which behavior to monitor:
- Price crossed the POC: notifies you whenever price crosses from one side to the other of the highest-volume level.
- POC changed level: notifies you when the Point of Control migrates to a new price range, signaling a shift in market interest.
- Price left the POC zone: notifies you when price moves away from the highest-traded region, indicating a possible breakout.
Notifications can be freely combined between terminal pop-up, sound, and mobile push notification (via the MetaTrader Mobile app), with a configurable minimum time between alerts to avoid repeated warnings during choppy price action. Note: push notifications require the MetaQuotes ID to be configured in the terminal's options (Tools → Options → Notifications).
Features and Customization
Customizable calculation timeframe: use the chart's own timeframe or a lower one for more precise volume calculation.
Adjustable precision: define how many price levels the volume will be divided into (more levels = more detail).
Volume type: choose between real volume (tick volume or contract volume, depending on the asset) or tick volume.
Fully customizable colors: bar color, Point of Control (POC) color, and control line color.
Compatible with any asset: Forex, cryptocurrencies, indices, stocks, gold, silver – works on demo or real accounts.
Advantages of Volume Profile POC for Your Trading
Identify support and resistance zones based on real volume, not just price.
Instantly find the Point of Control (POC), the region of greatest market interest in the analyzed period.
Receive automatic alerts on the terminal and on your phone without needing to watch the chart all day.
Adapt your analysis to any trading style: from scalping on M1 to swing trading on D1 or W1, without switching indicators.
Lightweight and efficient: runs in the background with no noticeable impact on terminal performance.