OrderFlux Footprint Orderflow
- Indicators
- Simon Draxler
- Version: 1.32
- Updated: 9 July 2026
- Activations: 10
OrderFlux – Order Flow and Footprint Indicator for MetaTrader 5
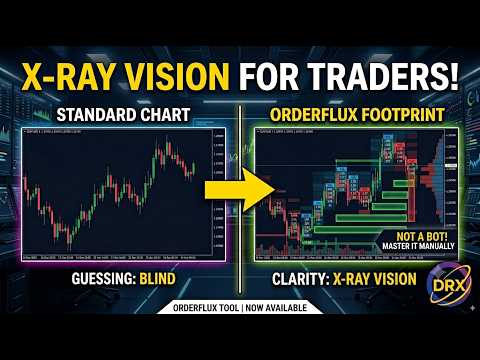
OrderFlux is a professional order flow and footprint indicator for MetaTrader 5. It opens up each individual candle and reveals what is happening inside: traded volume at every price level, separated into aggressive buyers and sellers. From this tick data, a complete Footprint Chart is built in real time, including Delta, Imbalance, Volume Profile, and Market Profile.
A standard chart only shows Open, High, Low, and Close. That is the result of a movement, not its cause. OrderFlux makes the microstructure of every candle visible and answers the one question that matters: Who actually drove the move? This allows support and resistance to be read from real traded volume instead of guessing based on candle shape alone.
What the Footprint Shows
At every price level, two numbers are displayed. On the left is the volume traded at Bid, on the right the volume traded at Ask. The relationship between both sides creates Delta — the net pressure from buyers or selle
- Imbalances: Levels with a strong imbalance toward one side are highlighted. If three or more imbalances stack on top of each other, they create a stacked zone that often acts later as support or resistance.
- Point of Control (POC): The highest-volume level inside a candle is distinctly emphasized.
- Candle Anatomy: The candle body itself remains clearly visible from open to close, including the wick.
- Volume Bubbles & Badges: Unusually aggressive volume is marked as a Bubble, and a compact badge beneath each candle summarizes time, Delta, and total volume. This allows traders to instantly identify whether a move was backed by real pressure or occurred on thin participation.
The Five Footprint Modes
- Bid × Ask: Displays complete volume per side and price level.
- Delta: Visualizes buyer and seller pressure as opposing histograms.
- Heatmap: Colors price levels according to volume and highlights strong and weak zones (HVN and LVN).
- Profile: Extends the footprint with a volume bar for each price level.
- TPO: Displays Market Profile across multiple trading sessions.
Order Flow Signals
OrderFlux identifies the key patterns that order flow traders focus on:
- Absorption: Occurs when large volume is traded at a high or low but price fails to continue because a large passive order absorbs the aggression.
- Unfinished Auctions: An extreme that often acts as a magnet that price later revisits.
- Single Prints: Reveal areas where price moved very quickly and frequently returns afterward.
- Stacked Imbalances: Mark institutional walls where support and resistance tend to develop.
Volume Profile and Market Profile
Volume Profile distributes traded volume across all prices within a session and provides Point of Control, Value Area High, and Value Area Low. This reveals where the market accepts fair value and where it rejects it. High and low volume nodes (HVN/LVN) separate fair-value zones from liquidity vacuums.
Market Profile in TPO format displays multiple trading sessions side by side. Instead of individual letters, OrderFlux uses clean and readable blocks and draws a price path through each session. Each day includes POC, Value Area, Session High/Low, Initial Balance, and untouched POCs that may later serve as targets. Volume is clearly separated between buyers and sellers.
Cumulative Delta (CVD)
Cumulative Delta tracks net pressure throughout the entire session. If price moves in one direction while CVD moves in the opposite direction, a divergence appears. OrderFlux automatically highlights these divergences, turning points, and moments where dominance shifts from buyers to sellers.
The price line is displayed directly above the CVD line so divergence becomes immediately visible, acting as an early warning signal for potential reversals.
Flow and Analysis
A dedicated panel combines the live analysis tools:
- Order Flow Ladder: Displays Bid and Ask for the active candle in real time, alongside a pressure bar showing the balance between buying and selling.
- Time and Sales: Lists individual ticks together with price and direction.
- Market Depth (DOM): Displayed for brokers with depth feeds.
- Market Summary Tab: Summarizes market direction, session Delta, current volume versus average, position relative to VWAP, important levels, and active supply/demand zones.
Intelligence Panel and Smart Analysis
A movable Intelligence Panel displays sentiment, momentum, and tape speed — indicating whether institutional activity is present or if the market is simply producing noise. A compact history of price and VWAP is included as well.
Above the raw numbers sits a plain-language analysis engine:
- It identifies acceptance and rejection at key levels based on time spent and traded volume.
- It evaluates the 80% Rule of the Value Area (when price opens outside, returns inside, and targets the opposite boundary).
- It tracks the lifecycle of a zone from fresh, to first test, to tested, or broken.
- Confluence Score: By combining divergence, levels, absorption, and exhaustion, it calculates a score for possible reversals and suggests potential stop and target areas.
Hovering over any price level additionally reveals contextual information such as POC, Value Area, Single Print, or support.
Levels, VWAP, and Custom Price Scale
OrderFlux draws VWAP and Session POC directly onto the chart and detects support and resistance based on price structure across multiple timeframes. An independent price scale and subtle grid can be enabled, allowing the chart to remain visually independent from the standard MetaTrader presentation.
Economic Calendar
Important events appear as vertical lines at their exact release time directly on the chart, filtered according to the currencies of the traded symbol. A compact panel displays upcoming events together with a countdown timer so no major release catches you off guard.
Visualization and Controls
- Three color themes are available: Dark, Calm Monochrome, and Light.
- Direct chart interaction via a slim sidebar for modes and layers, plus keyboard shortcuts.
- Smooth mouse wheel zooming for both chart detail and timeframe.
- Focus Mode: Hides everything except the pure footprint view.
- Settings are automatically saved across timeframe changes and restarts.
Technical Details & First Launch
- Platform: Runs exclusively on MetaTrader 5 (Not compatible with MT4).
- Compatibility: Works across all symbols and all timeframes.
- Performance: Custom rendering engine ensures smooth performance even with a large number of price levels.
- Data Dependency: Based on the broker’s real tick history. Market Depth requires a broker depth feed. Real traded volume requires actual volume data (e.g., futures). For Forex, CFDs, and demo accounts, analysis is based on tick feed data (standard for all order flow tools).
Note: If little data appears after the first load, download historical price data inside MT5. Real Tick Mode is recommended for testing. Short timeframes (M1, M5) with recent data work best for getting started.
Important to Know
OrderFlux does not trade automatically and is not a signal service. The indicator does not open or close positions. Its purpose is to visualize Order Flow, Footprint, Volume Profile, and Market Profile. All trading decisions remain entirely with the trader.
A detailed illustrated manual introduces the OrderFlux system step by step.
Read the full guide here ---> Click
Risk Warning: Trading involves risk. Past market reactions do not guarantee future results.