Fabii Yang Zhang Volatility Filter
- Indicators
-
Fabien Georges Andre Guillemaud
 I develop custom indicators and trading tools for MetaTrader 5.
 - Version: 1.10
- Updated: 9 October 2026
- Activations: 20
Know when volatility is enough to trade — live, no repaint, on any pair.
Any pair, any timeframe. Lines lock on bar close.
Free demo in the Strategy Tester.
>> Get more free and premium indicators here
Baseline, volatility, oscillators and more.
No repainting. No guessing. Just clean signals.
▬▬▬ THE PROBLEM ▬▬▬
Your entry can be right and still go nowhere. When the market is quiet, price drifts, stops get tagged by noise and targets take forever.
Every bar you trade in a quiet market is a trade that ties up your risk for little movement.
▬▬▬ THE SOLUTION ▬▬▬
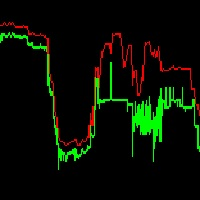
You see at a glance whether the market has enough movement to be worth your time. One line, two colours: green means go, grey means wait. You decide with a clear yes or no before you look for your entry.
▬▬▬ WHY YANG-ZHANG ▬▬▬
Yang-Zhang is a volatility estimator that uses open, high, low and close, and accounts for the gap between one bar and the next. A close-to-close measure ignores part of that movement. Yang-Zhang includes it.
▬▬▬ HOW IT WORKS ▬▬▬
Two Yang-Zhang lines are drawn in a separate window:
- Fast line (default 3 bars): the current volatility. Green when it is at or above the slow line, grey when it is below.
- Slow line (default 21 bars): the reference level, dotted. It adapts to each instrument, so you set no threshold by hand.
Optional band: a two-colour band under the oscillator shows the same state on a higher timeframe. Each bar shows the last closed higher-timeframe bar.
▬▬▬ KEY FEATURES ▬▬▬
- No repaint — signals are final on bar close, which means you can trust what you see on history.
- Self-adjusting reference line, which means no threshold to tune per pair.
- Two colours only, which means you read the state in one second.
- Higher timeframe band, which means you check the bigger picture without switching charts.
- Popup, sound and push alerts on colour change, which means you do not have to watch the chart.
- Status panel on the chart, which means the state is readable even with the oscillator window closed.
- Readable by an Expert Advisor through iCustom, which means you can use it as a filter in your own EA.
- Bars limit option, which means long histories stay fast.
▬▬▬ INPUTS ▬▬▬
| Parameter | Description | Default |
|---|---|---|
| Fast window (raw intensity) | Fast Yang-Zhang period: the current volatility | 3 |
| Slow window (reference level) | Slow Yang-Zhang period: the reference line | 21 |
| Fast >= slow (sufficient) | Colour of the fast line when volatility is sufficient | LimeGreen |
| Fast < slow (insufficient) | Colour of the fast line when volatility is insufficient | Gray |
| Slow reference line | Colour of the slow line | DimGray |
| Fast line width | Thickness of the fast line | 2 |
| Slow line width | Thickness of the slow line | 1 |
| Which colour shift alerts | Alert on both shifts, only on expansion, or only on insufficient | ALERT_BOTH |
| Popup alert on shift | Show a popup when the colour changes | false |
| Play sound on shift | Play a sound when the colour changes | false |
| Push notification on shift | Send a push notification to your phone | false |
| Sound file name | Sound file used by the sound alert | alert.wav |
| Limit to the N most recent bars | Calculate only the latest bars to keep charts fast | true |
| Bars to compute (min 50) | Number of bars calculated when the limit is on | 500 |
| Higher timeframe | Timeframe shown in the band. Current timeframe means no band | Current |
| Higher timeframe band width | Thickness of the band | 3 |
| Status panel | Show the status panel on the chart | false |
▬▬▬ HOW TO USE IT ▬▬▬
- Attach the indicator to any chart. The oscillator opens in its own window.
- Grey: wait. Volatility is below its own reference.
- Green: the market is moving enough. Look for your usual entry.
- Optional: set a higher timeframe and take entries only when the band is green too.
- Optional: turn on an alert and let the terminal tell you when the colour changes.
The indicator measures how much the market moves, not which way. It gives no buy or sell signal.
▬▬▬ WHY TRUST IT ▬▬▬
No repaint: values are final on bar close, and the live bar is drawn separately so you can tell it apart.
Free demo: you can run it before you buy.
Support: I answer within 24h.
To test it: click Free Demo, then run it in the Strategy Tester in visual mode on your pair and timeframe.
▬▬▬ PART OF THE FABII SUITE ▬▬▬
Fabii Volatility Acceleration Index: shows when volatility is speeding up or fading, with a higher timeframe confirmation band.
All of them are on my seller page (link at the top of this page).
▬▬▬ SUPPORT ▬▬▬
Question or issue? Message me FIRST — I answer within 24h and fix fast. If it saved you time on a few trades, a short review — even one line, say which pair and timeframe you use it on — helps other traders find it.
▬▬▬ GET IT ▬▬▬
Get it, and see the green and grey on your own charts in 2 minutes. Test it free in the Strategy Tester first.
Launch price is $30 and rises to $49 after the first 20 sales.
I answer within 24h. (This indicator is a tool, not financial advice. Trading carries risk.)