Fabii Memory Baseline
- Indicators
-
Fabien Georges Andre Guillemaud
 I develop custom indicators and trading tools for MetaTrader 5.
 - Version: 1.32
- Updated: 6 October 2026
- Activations: 20
Read the trend and its higher timeframe on one chart, with a line that holds its level. No repaint.
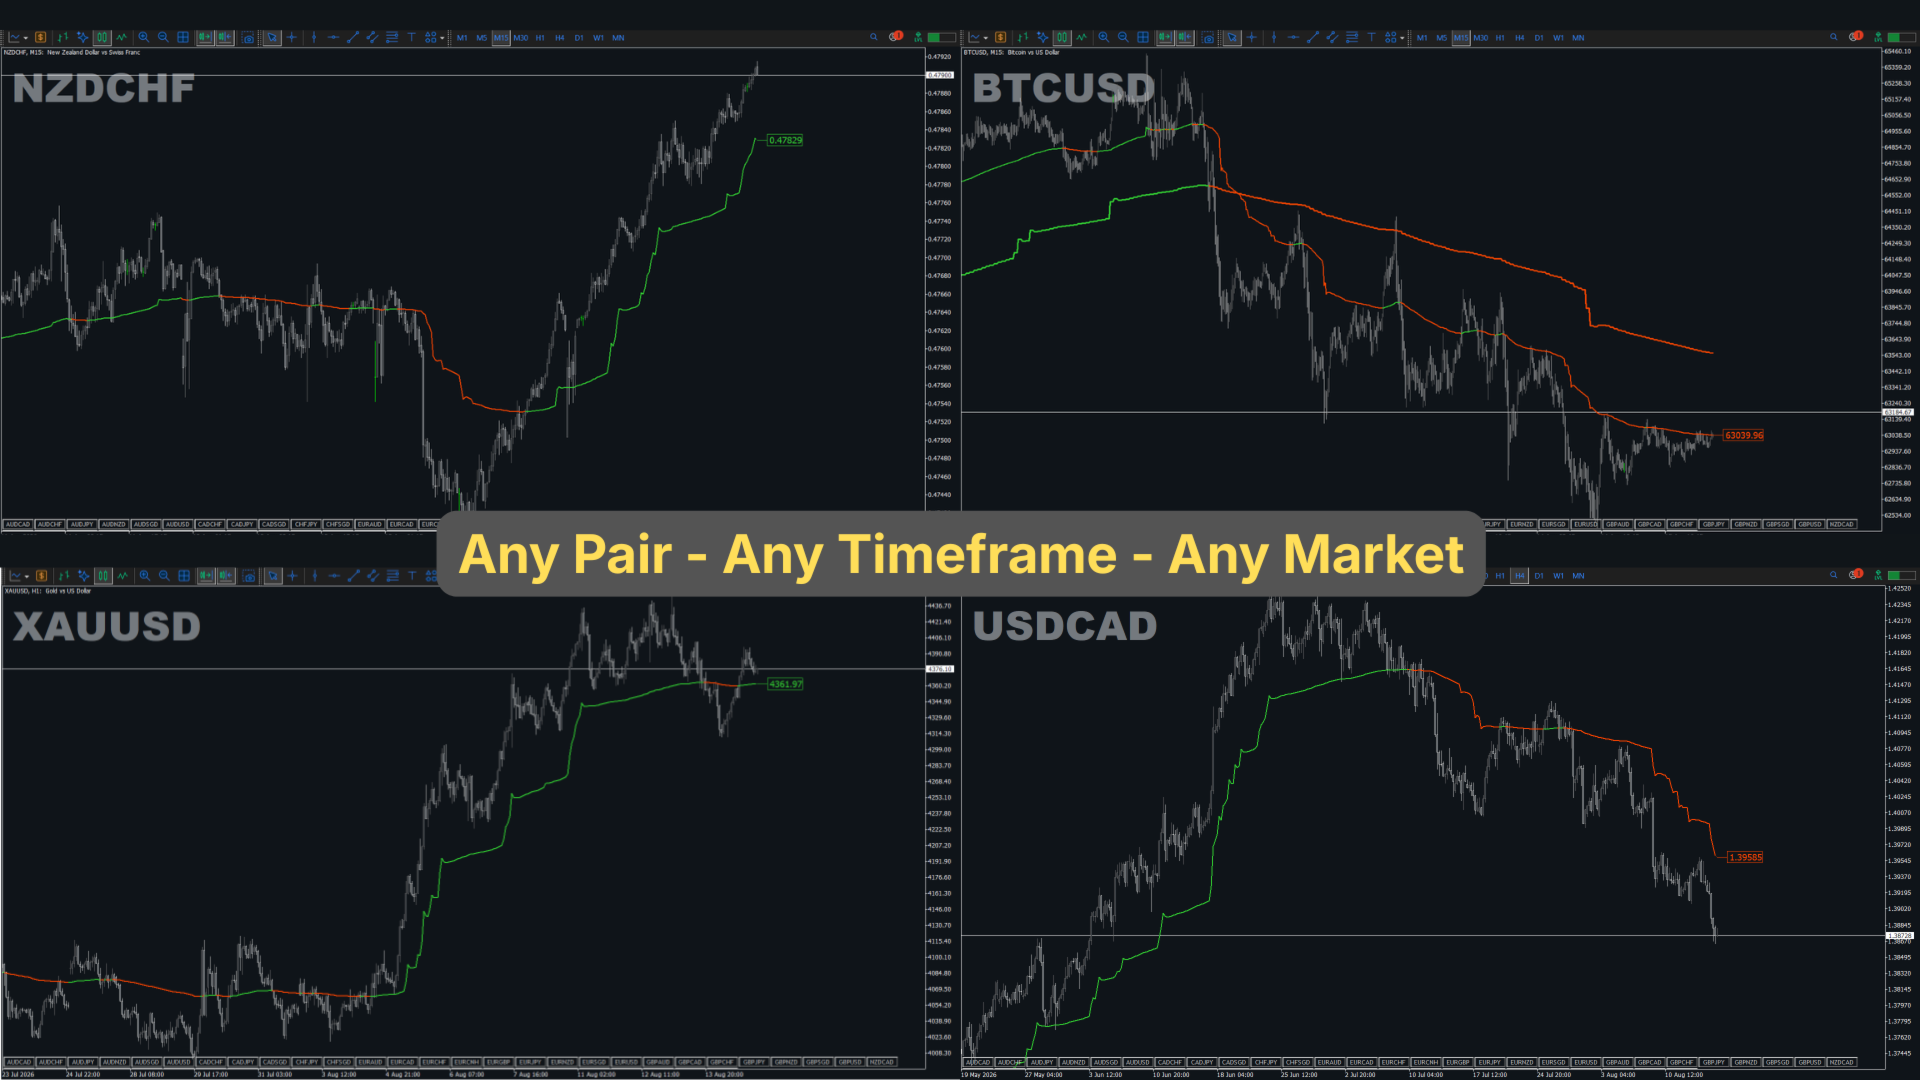
Any pair, any timeframe. On your chart in 2 minutes. Free demo in the Strategy Tester.
Get more indicators here
Baselines, volatility filters and oscillators. No repaint.
Why you need it
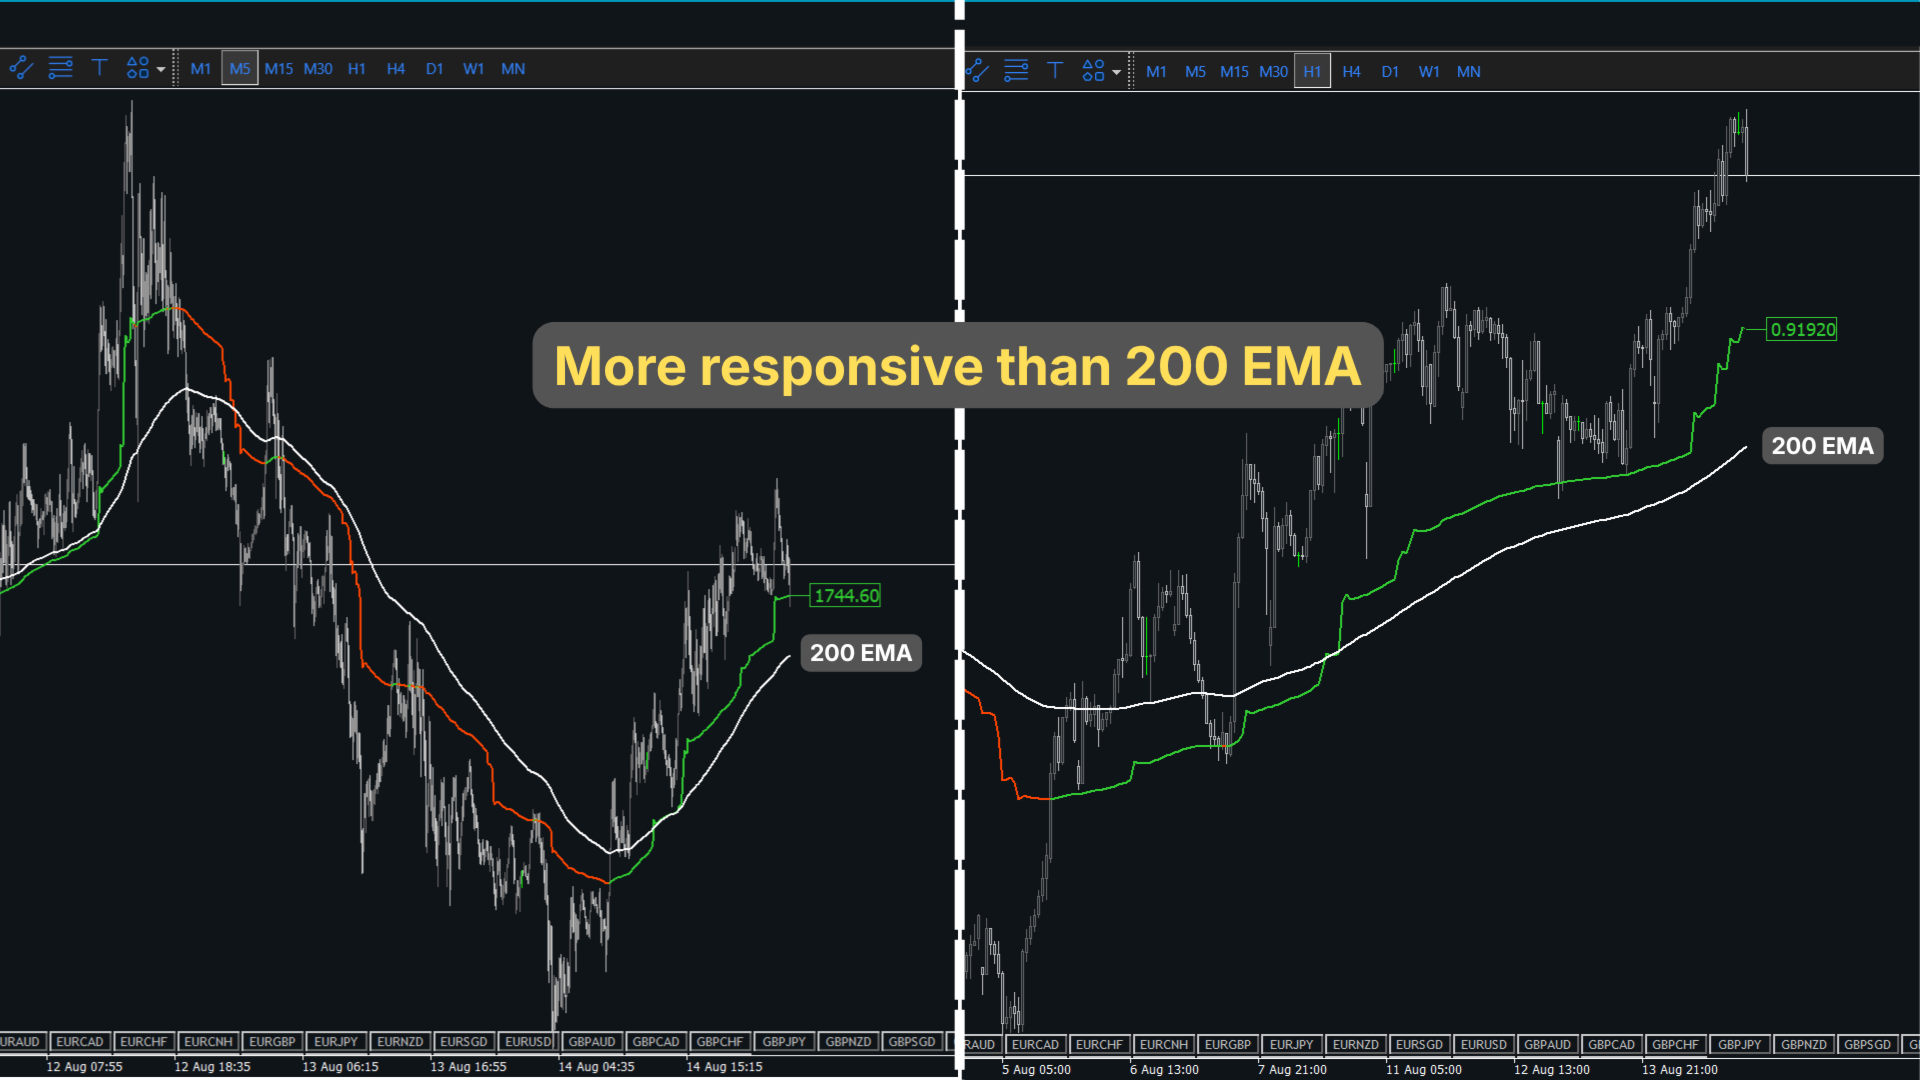
A plain moving average falls behind price. After a strong move, the line stays far from price and gives you a level that no longer matters. To check the higher timeframe, you switch charts and lose the picture you were reading.
You place the trade against a level that price left several bars ago.
What you get
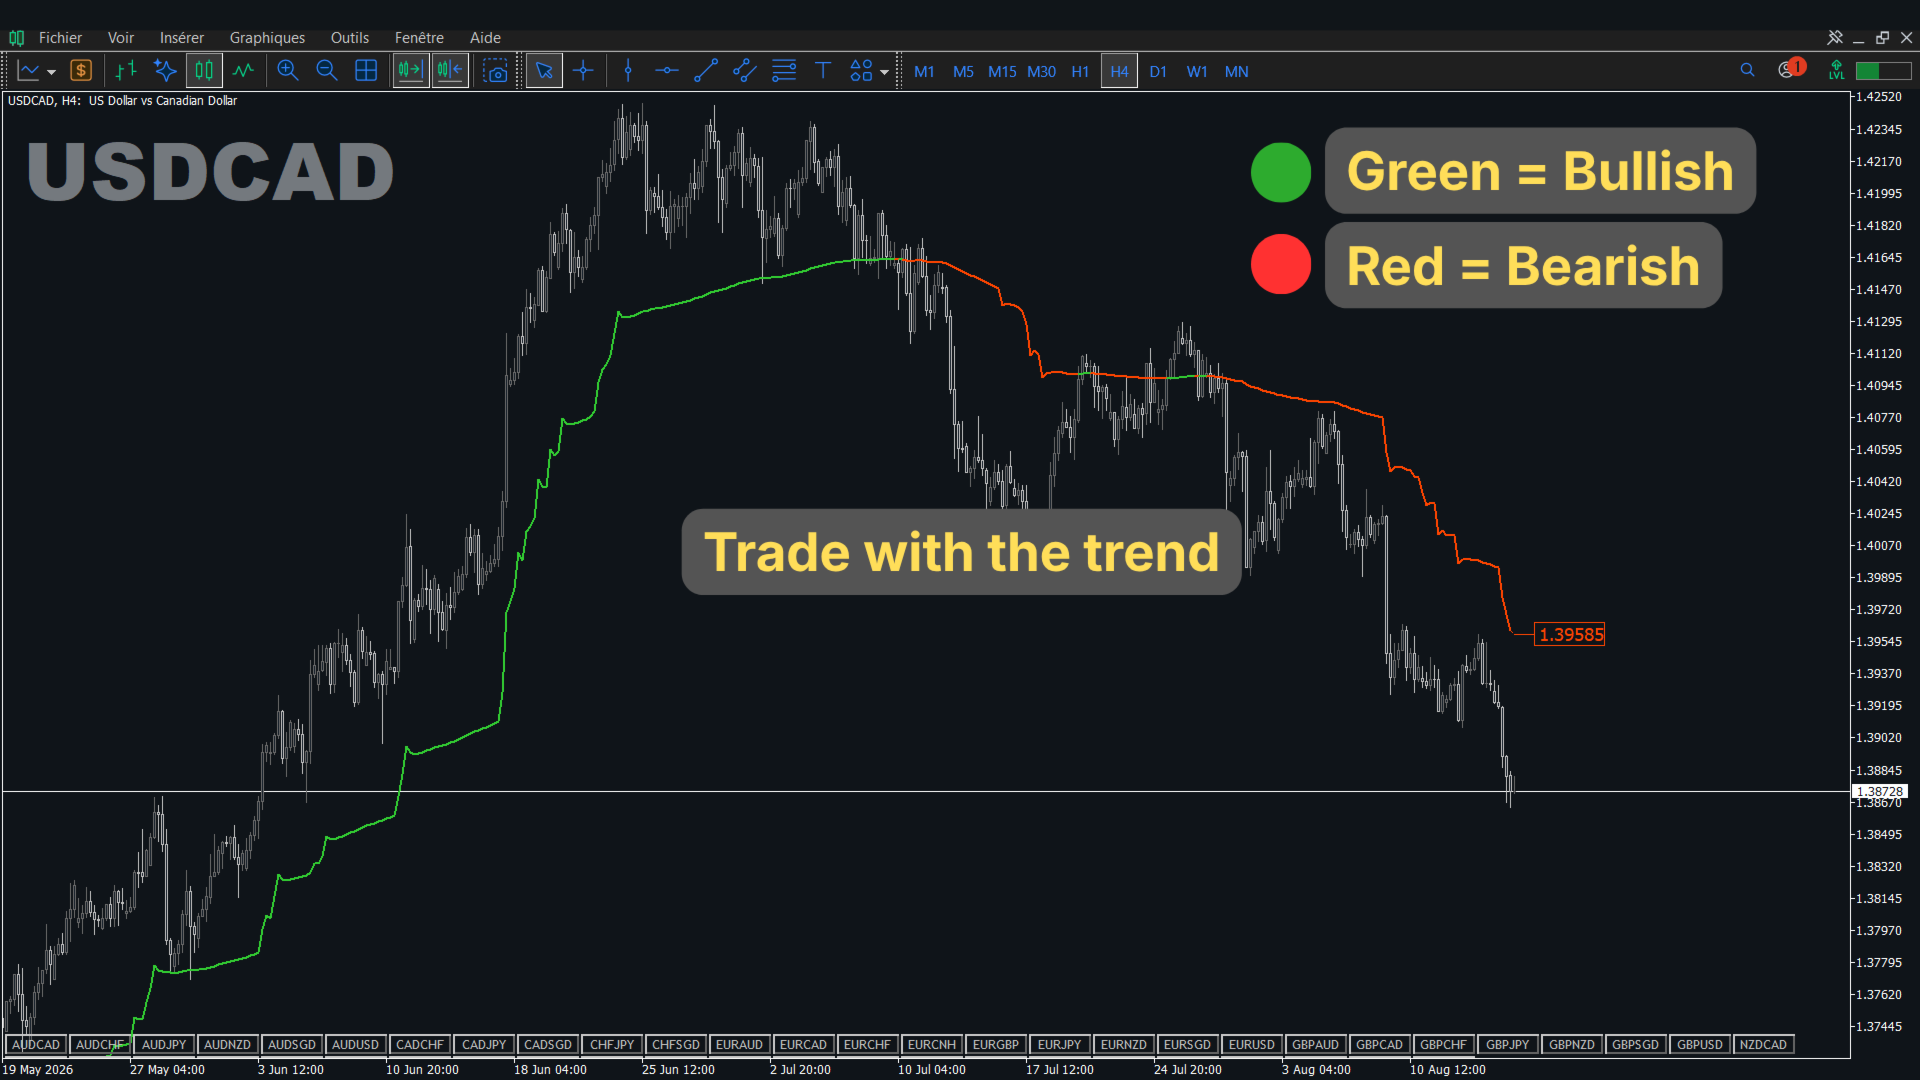
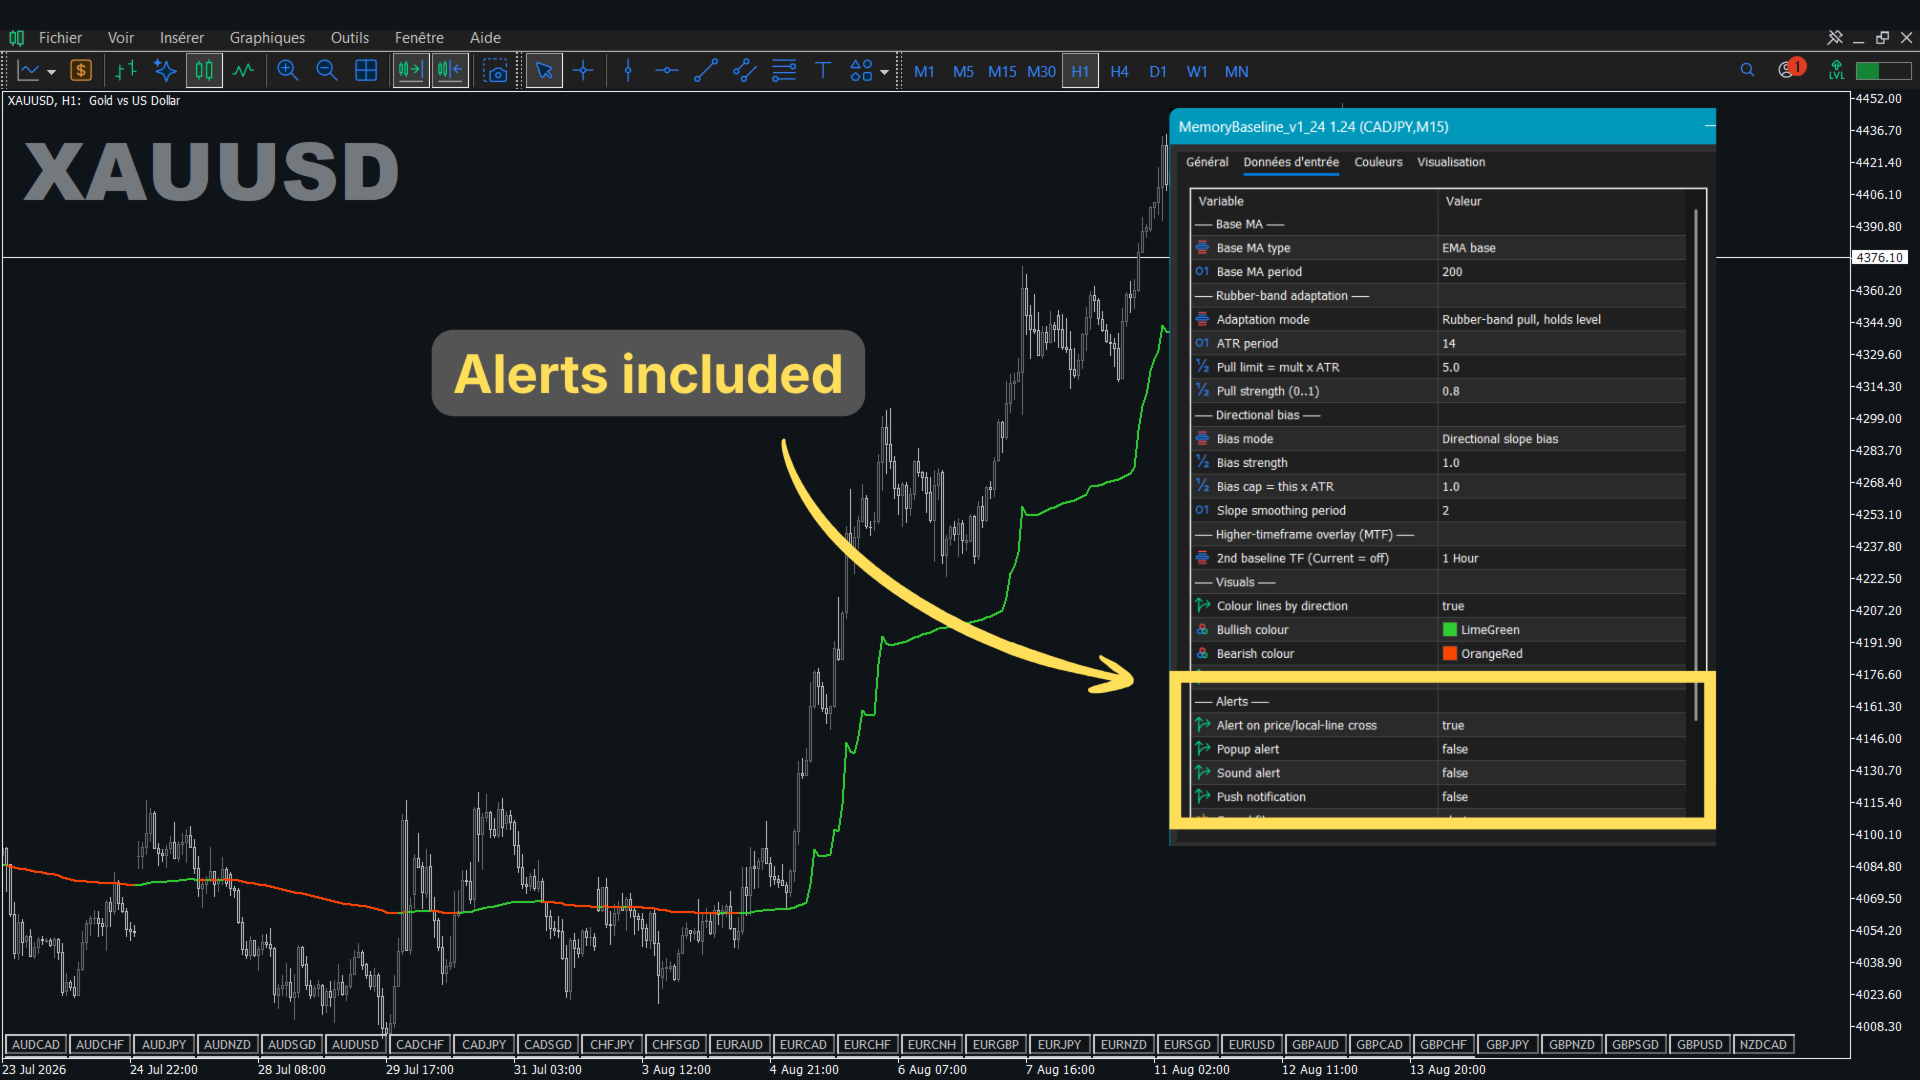
Fabii Memory Baseline is a moving average that follows price in strong moves and keeps the level it reached, so you read trend and distance from one line.
- A line that moves toward price when a move stretches and holds the level it reached, so you keep a usable reference after a spike.
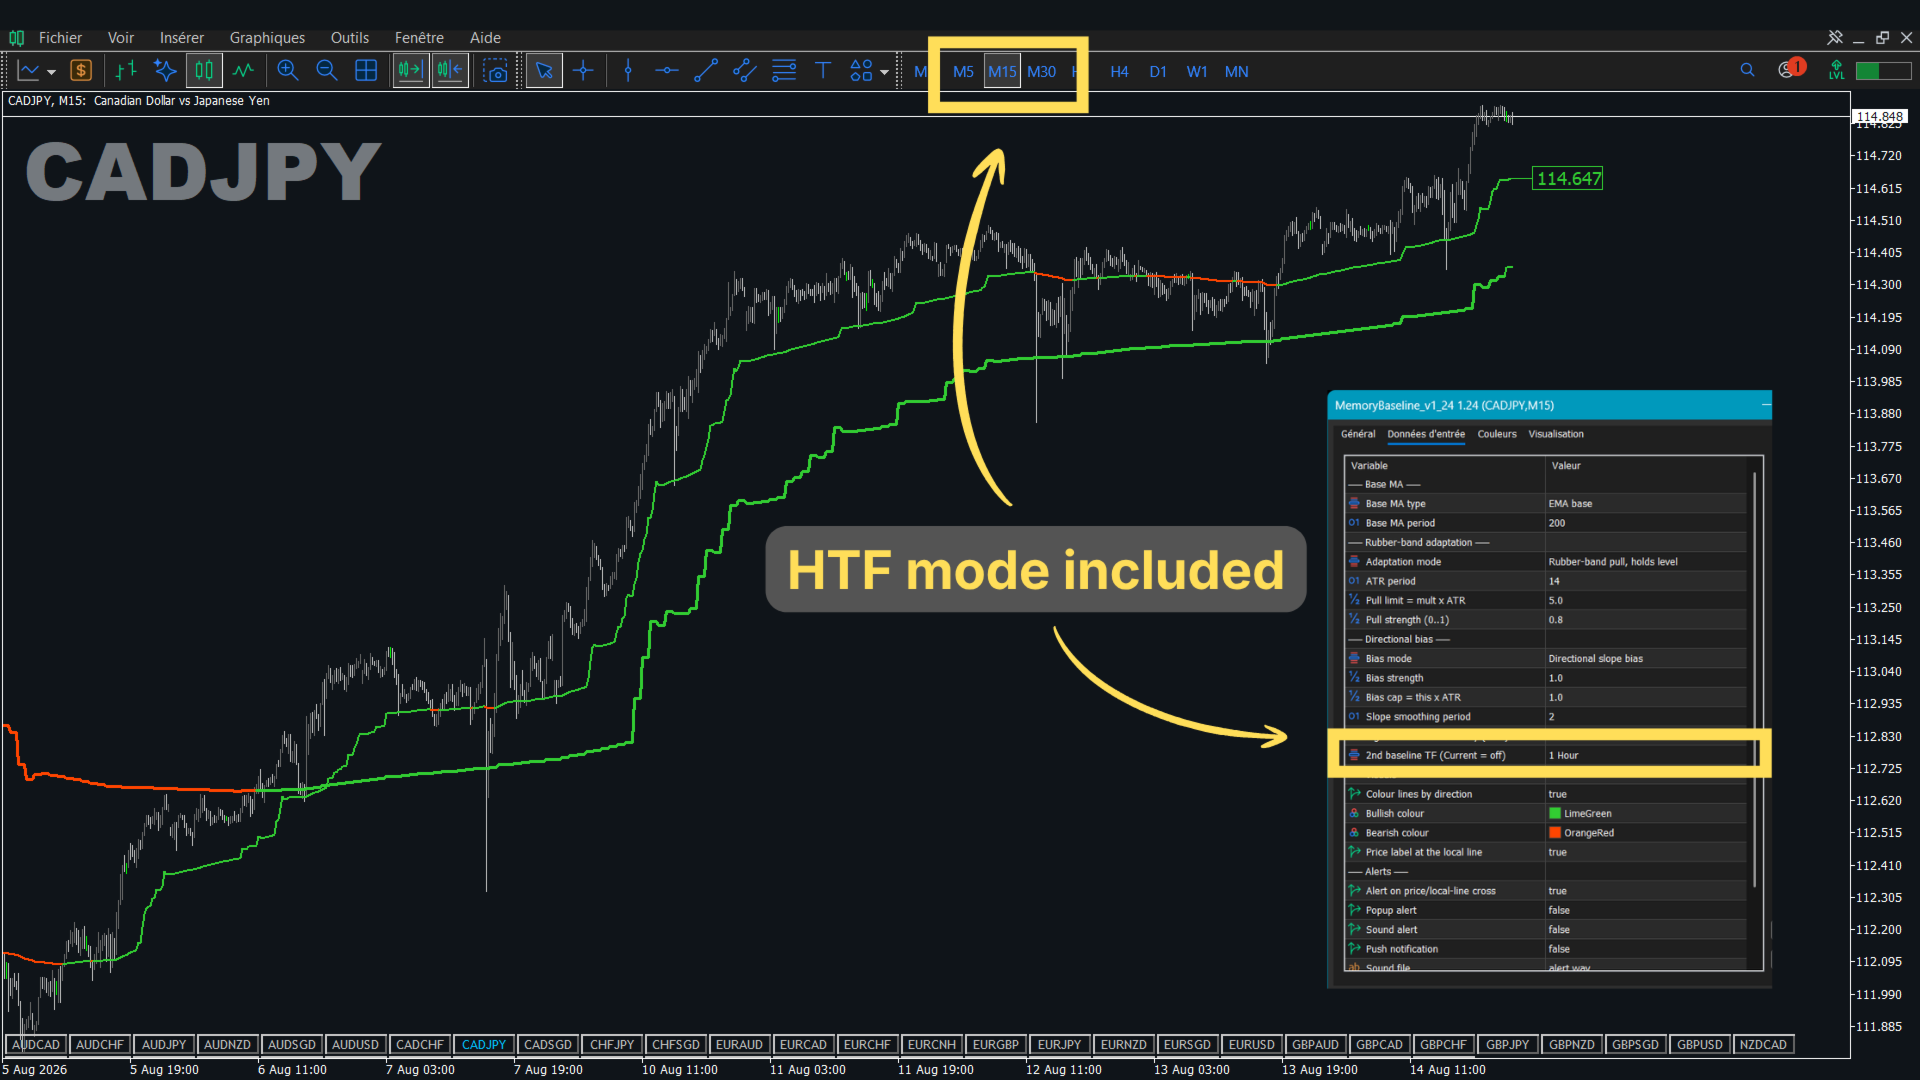
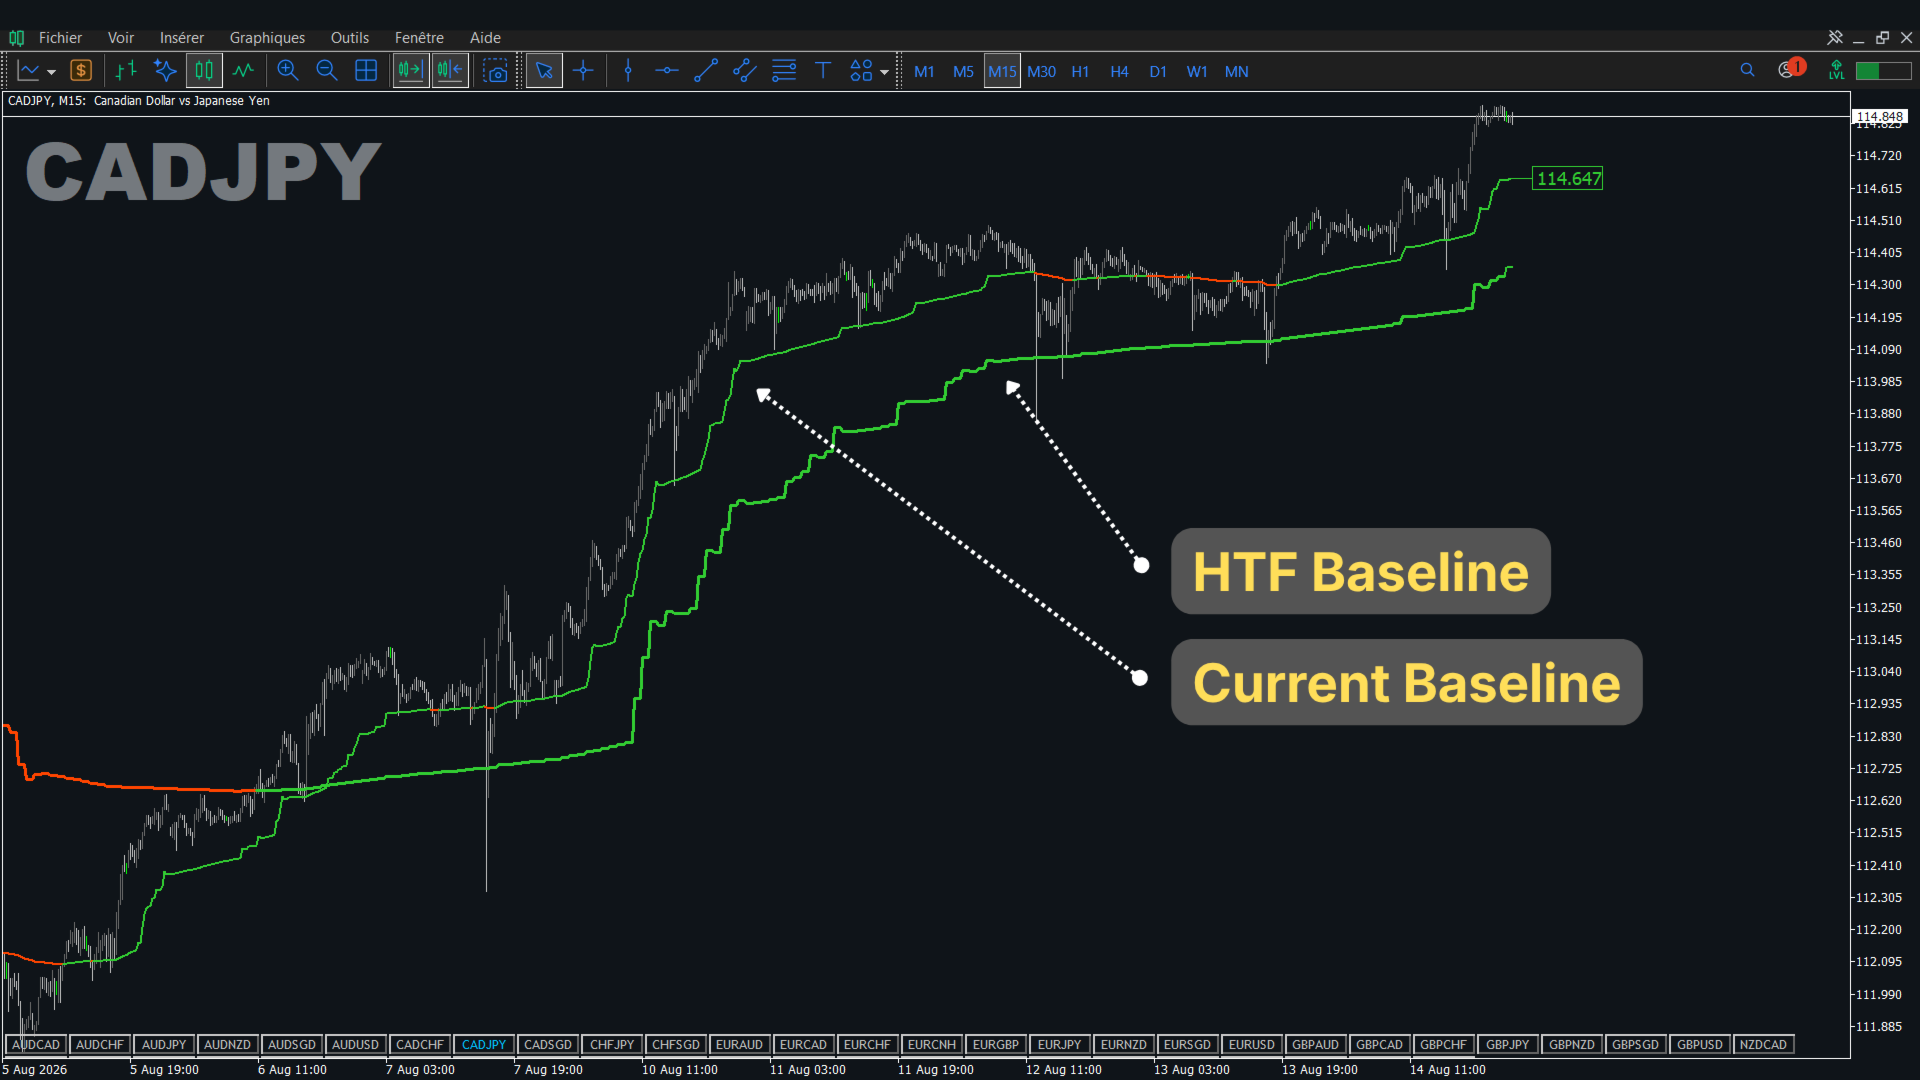
- A second baseline from a higher timeframe on the same chart, so you read the top-down trend without switching charts.
- Green for an up direction and red for a down direction on both lines, so you read the bias at a glance.
- Optional colouring of the candles with the direction of the local line, so you see the bias on the price itself.
- Alerts for a price cross, a colour change and an alignment of both lines, so you do not have to watch the chart.
- A price label at the current level of the line, so you read the value without moving the cursor.
How it works
The line starts from a moving average, either an Exponential Moving Average (EMA) or a Simple Moving Average (SMA), with a period of 200 by default. The Average True Range (ATR) measures the normal size of price movement. When price moves further from the average than a set number of ATR, the line is pulled toward price by a share of the extra distance, and each new bar starts from that pulled value. This is how the line holds its level. A directional bias is then added from the smoothed slope of the line, limited to a multiple of the ATR so it cannot run away. The colour follows the direction of that slope. Values are calculated on closed bars, and the forming bar is shown as a dotted provisional line until it closes. The second baseline uses the same calculation on the higher timeframe you choose, and it changes only when a bar of that timeframe closes.
How to use it
- Attach the indicator to any chart.
- Choose a timeframe for the second baseline that is higher than your chart, for example H4 on an M15 chart.
- Look for entries in the direction of both lines when they show the same colour.
- Turn on candle colouring if you want the bias drawn on the price.
- Turn on popup, sound or push alerts, so you are notified of a cross, a colour change or an alignment.
Key settings
| Setting | What it does | Default |
|---|---|---|
| Base MA type | Starting average, EMA or SMA | EMA base |
| Base MA period | Length of the starting average | 200 |
| Pull limit = mult x ATR | Distance from price, in ATR, beyond which the line is pulled toward price | 5.0 |
| Pull strength (0..1) | Share of the extra distance that the line recovers | 0.8 |
| Bias strength, Bias cap = this x ATR | Weight of the directional bias and its largest size, in ATR | 1.0, 1.0 |
| 2nd baseline TF (Current = off) | Higher timeframe of the second baseline | Current (off) |
| Colour candles by local direction | Colours the candles with the direction of the local line | false |
| Alerts | Price cross, colour change and alignment alerts; popup, sound and push delivery | Events on; popup, sound, push off |
Other settings control colors, the price label, the sound file and the number of bars calculated.
Test it before you decide
You can check no repaint yourself. Let a bar close, then check that the value in the Data Window does not change. To test it: click Free Demo, then run it in the Strategy Tester in visual mode on your pair and timeframe.
Updates are free and included. Every release is listed in the What's new section of this page, so you always know what changed.
More indicators in the same family are in preparation. Follow my profile to be notified when they are published.
Get it and have it on your charts in 2 minutes.
Comments and reviews
Questions? Post a comment on this page or message me and you get an answer within 24 hours.
If this saves you time, a short review that says which pair and timeframe you use helps other traders find it.
Past results do not predict future results. This indicator does not provide financial advice.