Fabii Coral Trend

Know your trend bias on two timeframes at once — no repaint, signals final on bar close.
Any pair, any timeframe, any market. Free demo in the Strategy Tester.


>> Get more free and premium indicators here
Baseline, volatility, oscillators & more.
No repainting. No guessing. Just clean signals.


▬▬▬ THE PROBLEM ▬▬▬

You know the chart-timeframe trend. But you do not know whether the higher timeframe agrees — until you flip to it, then flip back, and the moment is gone. Entering with the short-term trend against a hidden higher-timeframe reversal is how clean setups turn into unexpected losers. Every bar you misread the bias is a trade you size wrong.


▬▬▬ THE SOLUTION ▬▬▬

Fabii Coral Trend Baseline puts both timeframes on the same chart at the same time. One smooth line for your chart timeframe, one staircase baseline for the higher timeframe. Green means rising, red means falling, blue means flat — both lines, same palette, same glance.


▬▬▬ HOW IT WORKS ▬▬▬

The indicator runs a six-pole recursive filter on the closing price — a mathematically smooth curve that removes noise without lagging behind sharp moves. The same filter runs independently on the higher timeframe you choose, displayed as a staircase that updates only on closed higher-timeframe bars. When both lines point the same way, the bias is clear. A buy or sell arrow appears at each confirmed flip on the chart-timeframe baseline, anchored to the line itself. Optional trend-coloured candles (full body, thin wicks) reinforce the current direction directly on the price chart.


▬▬▬ KEY FEATURES ▬▬▬

  • Six-pole recursive trend filter — which means you get a smooth, readable line even on noisy pairs like XAUUSD or crypto.
  • Direction colouring: green / red / blue — which means you read bias in under a second without checking numbers.
  • Higher-timeframe baseline (any TF you choose) — which means you see short-term and long-term bias on one chart, which removes one chart-switching step from every trade decision.
  • Buy / sell arrows on confirmed trend flips — which means you never miss a direction change while watching another instrument.
  • Optional trend-coloured candles — which means confluence between the line, the arrows and the bars is visible at a glance.
  • Popup, sound and push alerts on flip — which means you get notified even when MetaTrader is in the background.
  • No repaint — signals are final on bar close. The live bar always shows a provisional dotted line, clearly separate from the confirmed signal.
  • Works on any pair, any timeframe, any market (forex, indices, metals, crypto, stocks).
  • No DLL, no external dependency.
  • EA-readable: the chart-TF baseline value and the HTF baseline value are both accessible from buffer 0 and buffer 4.


▬▬▬ INPUTS ▬▬▬

Parameter Description Default
Smoothing Period Controls how smooth the baseline is. Higher = smoother, more lag. 21
Damping Constant Controls the filter damping (0 to 1). Affects curve shape. 0.4
Color Up Colour of the rising baseline, arrows and candles. LimeGreen
Color Down Colour of the falling baseline, arrows and candles. Red
Color Flat Colour when direction is neutral. RoyalBlue
Higher Timeframe Timeframe for the second baseline. PERIOD_CURRENT = off. PERIOD_CURRENT
Show Arrows Enable buy/sell arrows on confirmed flips. true
Arrow Offset ATR Distance between the baseline and the arrow, in ATR units. 0.5
ATR Period Period of the internal ATR used for arrow spacing. 14
Color Candles Colour candles with the trend direction (full body, thin wicks). false
Alert Popup Show a popup alert on trend flip. false
Alert Sound Play a sound on trend flip. false
Alert Push Send a push notification on trend flip. false
Sound File Name of the sound file for alerts. alert.wav
Use Bars Limit Restrict computation to the N most recent bars. true
Max Bars Number of bars to compute when the limit is active. 500


▬▬▬ HOW TO USE IT ▬▬▬

  1. Attach the indicator to any chart. Set the Higher Timeframe input to a timeframe above your chart (example: D1 on an H4 chart).
  2. Wait for both baselines to point the same colour. Same direction = aligned bias = higher-probability context.
  3. A flip arrow on the chart-TF baseline confirms a direction change on your timeframe.
  4. Use the coloured candles as a visual confirmation layer: when candles, the chart-TF baseline and the HTF baseline all share the same colour, the setup is clear.
  5. Set alerts to be notified when a flip occurs, without watching the screen.


▬▬▬ PROOF — WHY TRUST IT ▬▬▬

No repaint: the signal buffer is blanked on the live bar and is only written when the bar closes. You can verify this directly in the Strategy Tester (no live data required). The Strategy Tester runs the indicator on historical bars exactly as it would in real time — attach it, run it, and check that arrows appear only on closed bars. I answer support messages within 24 hours.


▬▬▬ PART OF THE FABII SUITE ▬▬▬

More tools for your system — baselines, volatility filters, oscillators and more — at:
mql5.com/en/users/fabienfxtrades/seller


▬▬▬ RATING ▬▬▬

Question or issue? Message me first — I answer within 24 hours and fix fast. If this indicator saved you time on a few trades, a short review helps other traders find it. Even one line makes a difference. Say which pair and timeframe you use it on.


▬▬▬ GET IT ▬▬▬

Get it now and have it on your charts in 2 minutes. Test it free in the Strategy Tester first, on your own charts and your own pairs. Launch price is $30 and will rise after the first sales. I answer within 24 hours.

(Compatible with MetaTrader 5. No DLL required.)

Follow my profile for future releases: mql5.com/en/users/fabienfxtrades/seller

Recommended products
Follow The Line MT5
Oliver Gideon Amofa Appiah
4.6 (35)
This indicator obeys the popular maxim that: "THE TREND IS YOUR FRIEND" It paints a GREEN line for BUY and also paints a RED line for SELL. (you can change the colors). It gives alarms and alerts of all kinds. IT DOES NOT REPAINT and can be used for all currency pairs and timeframes. Yes, as easy and simple as that. Even a newbie can use it to make great and reliable trades. NB: For best results, get my other premium indicators for more powerful and reliable signals. Get them here: https://www.m
FREE
Smart Entry Hulk KPG
Le Uyen Phuong Nguyen
Smart Entry Hulk KPG – H-Band & Trend MTF Indicator for MT5 General Description Smart Entry Hulk KPG is a technical analysis indicator developed by Billion KPG Club for MetaTrader 5. It combines the smoothing characteristics of the H-Band with the directional logic of the Trend algorithm.  By applying the Trend calculation onto the smoothed H-Band data, this tool aims to filter market noise and provide clear visual representations of trend directions. It features a Multi-Timeframe (MTF) dashboa
FREE
Two EMA-difference histograms with confirmed crossover labels and historical BUY and SELL boxes. Ospe Dual MACD plots two MACD-style EMA differences in one separate window: a 12/26 pair and a 5/13 pair by default. It displays colored histograms and matching lines. The color of each histogram changes with its position relative to zero and its movement from the preceding bar. When the faster difference crosses above the slower difference on a completed candle, the indicator places a green BUY box
FREE
The   OHLC indicator   shows the current and historical values of High, Low, Open, Close and Mid for a specific time period. It can plot the current values or the values from the previous session. The indicator's range can be calculated from a daily, weekly, monthly, or user-specified session. Levels High  of the current or previous session. Low  of the current or previous session. Open  of current or previous session. Close  of the current or previous session. Midpoint  of the current or prev
FREE
Bollinger Bands Technical Indicator (BB) is similar to envelopes. The only difference is that the bands of Envelopes are plotted a fixed distance (%) away from the moving average, while the Bollinger Bands are plotted a certain number of standard deviations away from it. Standard deviation is a measure of volatility, therefore Bollinger Bands adjust themselves to the market conditions. When the markets become more volatile, the bands widen and they contract during less volatile periods. This ada
FREE
VolumeBasedColorsBars
Henrique Magalhaes Lopes
VolumeBasedColorsBars — Free Powerful Volume Analysis for All Traders Unlock the hidden story behind every price bar! VolumeBasedColorsBars is a professional-grade, 100% FREE indicator that colorizes your chart candles based on real, adaptive volume analysis. Instantly spot surges in market activity, identify exhaustion, and catch the moves that matter. This indicator gives you:    • Dynamic color-coded bars for instant volume context    • Adaptive thresholds based on historical, session-awar
FREE
**RSI Divergence Auto for MT5** is a MetaTrader 5 indicator that automatically identifies potential bullish and bearish divergences between price movement and the Relative Strength Index. The indicator compares price highs and lows with RSI highs and lows. When it detects a difference between them, it displays the divergence directly on the chart. Features - Automatic detection of potential bullish divergences. - Automatic detection of potential bearish divergences. - Visualization of Bull a
FREE
SC MTF Rsi MT5
Krisztian Kenedi
5 (7)
Relative Strength Index (RSI) indicator with multi-timeframe support, customizable visual signals, and configurable alert system. Freelance programming services, updates, and other TrueTL products are available on my MQL5 profile . Feedback and reviews are highly appreciated! What is RSI? Relative Strength Index (RSI) is a momentum oscillator that measures the speed and magnitude of price changes. The indicator oscillates between 0 and 100, comparing the magnitude of recent gains to recent lo
FREE
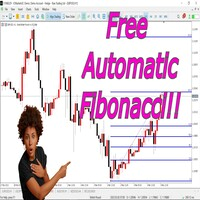
Free automatic Fibonacci is an indicator that automatically plots a Fibonacci retracement based on the number of bars you select on the BarsToScan setting in the indicator. The Fibonacci is automatically updated in real time as new highest and lowest values appears amongst the selected bars. You can select which level values to be displayed in the indicator settings. You can also select the color of the levels thus enabling the trader to be able to attach the indicator several times with differe
FREE
MACD Enhanced
Nikita Berdnikov
4 (4)
Introducing the MACD  Enhanced – an advanced MACD (Moving Average Convergence Divergence) indicator that provides traders with extended capabilities for trend and momentum analysis in financial markets. The indicator uses the difference between the fast and slow exponential moving averages to determine momentum, direction, and strength of the trend, creating clear visual signals for potential entry and exit points. Attention! To achieve the best results, it is recommended to adapt the indicator
FREE
PFKBreakOut
Stanislav Korotky
This indicator displays breakouts on Point-And-Figure-like or Kagi-like custom symbol charts, generated by special expert advisers, such as PointFigureKagiCharts . This indicator is applicable only for custom instruments generated in appropriate way (with time-invariant bars which are multiples of a predefined box size). It makes no sense to apply it to other charts. The breakouts in up or down direction are marked by arrows. The breakout price is found at crossing of one of imaginary lines of
FREE
Curver Arrows
Francis Dube
3.75 (4)
This indicator is a straight port of a well known MetaTrader 4 indicator that is freely available on the Internet. It does not redraw at all. It implements a type of breakout strategy. The arrows indicate market direction. Use the indicator on M15 charts and higher. The indicator draws two bands near price action and generates signals when the price closes below the lower band and also above the upper band. The indicator uses periodic highs and lows to calculate upper and lower threshold bands.
FREE
JT360 DNA Mini PnL Pointer V1.04 Public Компактно. Наглядно. Всегда перед глазами. JT360 DNA Mini PnL Pointer — это лёгкий индикатор для MetaTrader 5, который отображает суммарную текущую прибыль или убыток по всем открытым позициям текущего символа графика. Компактная индикация непосредственно на графике объединяет PnL относительно первоначального риска в формате R, тонкую мини-полоску и настраиваемую цветовую матрицу. Фирменные цвета JT360 — бирюзовый и пурпурный — выделяют крайние значения и
FREE
FVG Indicator
Daniel Moises Pimentel Flores
This indicator identifies and highlights market inefficiencies, known as Fair Value Gaps (FVG), on price charts. Using a custom algorithm, the indicator detects these areas of imbalance where the price moves sharply, creating potential trading opportunities. Indicator Parameters: Bullish FVG Color (clrBlue) : Color used to highlight bullish inefficiencies. The default value is blue. Bearish FVG Color (clrRed) : Color used to highlight bearish inefficiencies. The default value is red. Bullish FVG
FREE
This indicator is a zero-lag indicator and displays  strength of trend change . True Trend  Oscillator Pro works best in combination with True Trend Moving Average Pro that displays exact trend as is. Oscillator value is exact price change in given direction of the trend. True Trend Moving Average Pro: https://www.mql5.com/en/market/product/103586 If you set PERIOD input parameter to 1 this indicator becomes a sharpshooter for binary options. Developers can use True Trend Oscillator in Exper
FREE
Indicator and Expert Adviser  EA Available in the comments section of this product. Download with Indicator must have indicator installed for EA to work. Mt5 indicator alerts for bollinger band and envelope extremes occurring at the same time. Buy signal alerts occur when A bullish candle has formed below both the lower bollinger band and the lower envelope  Bar must open and close below both these indicators. Sell signal occur when A bear bar is formed above the upper bollinger band and upper
FREE
Pivot Points Indicator – a fast, reliable, and fully customizable pivot detection for MetaTrader 5. This indicator uses MetaTrader’s native iHighest and iLowest functions to identify pivot highs and lows by scanning for the highest and lowest prices within a user-defined window of bars. A pivot is confirmed only when the current bar is the absolute maximum or minimum within the selected range, ensuring accurate and timely signals based on robust built-in logic. Key Features No Repainting : Onc
FREE
Hi Low Last Day
Igor Vishnevskii
The Hi Low Last Day ( Hi Lo Last Day ) indicator shows the high and low of the last trading day and the second trading day, as well as the minimum and maximum of last week . There are many trading strategies on the daily levels. This indicator is indispensable when using such trading strategies. In fact, everything is simple in trading, you just need to understand and accept it for yourself. There is only price!!! What is price? This is the level on the chart. The level is the price that the buy
PZ Multi TDI MT5
PZ TRADING SLU
4.86 (14)
All-in-one trading powerhouse: trend, reversal, and exhaustion detection This indicator is a personal implementation of the famous Traders Dynamic Index, which uses RSI, moving averages and volatility bands to find trends, reversals and price exhaustions. However, this particular implementation supports not only RSI, but many others. It is suitable for scalping, day trading, and swing trading and aims to provide a full picture of the current market conditions. [ Installation Guide | Update Guid
FREE
The indicator identifies when a divergence occurs between price and an indicator or oscillator. It identifies both regular and hidden divergences. Combined with your own rules and techniques, this indicator will allow you to create (or enhance) your own powerful system. For higher probability setups I can recommend you to use my Supply Demand indicator and trade only if the divergence occurs inside a zone. Supply zone for bearish div and demand zone for bullish div. The optimal scenario is if it
FREE
GDS Renko Pip ST Chart - Pip-Based Renko Chart Indicator for MetaTrader 5 GDS Renko Pip ST Chart is a pip-based Renko chart indicator for MetaTrader 5. It helps traders build and study cleaner Renko price movement using a practical fixed pip or point-based brick structure. This tool is designed as a Renko chart foundation for manual analysis. It does not predict the market, does not generate buy or sell signals and does not decide whether a trade should be opened. Renko EDGE EA Golden Delta | A
FREE
Laguerre RSI Signal Alliance is a flexible MT5 oscillator with configurable BUY/SELL signals, optional Stochastic confirmation and multiple alert channels. The indicator is based on the Laguerre RSI concept introduced by John F. Ehlers and is designed for traders who want more than a standard oscillator line. It can detect Laguerre RSI level crossings, display historical signal arrows, confirm signals with an optional Stochastic filter and notify the trader through terminal, push, email or sound
FREE
TTM Squeeze MT5
Tinashe Ndarimani
4.9 (10)
Overview The TTM Squeeze indicator helps identify low volatility periods (squeeze) that often precede price breakouts. It uses Bollinger Bands (BB) and Keltner Channels (KC) to determine when the market is "coiling" and ready to move. Configuration Guide Volatility Settings The indicator uses Bollinger Bands to measure market volatility. When BBs are inside Keltner Channels, a squeeze is detected. The squeeze suggests the market is consolidating and may soon break out. True Range Option Optional
FREE
KeltnerChannelIndicatorMT5
Todd Terence Bates
3 (2)
The Keltner Channel is a volatility-based technical indicator composed of three separate lines. The middle line is an exponential moving average (EMA) of the price. Additional lines are placed above and below the EMA. The upper band is typically set two times the Average True Range (ATR) above the EMA, and the lower band is typically set two times the ATR below the EMA. The bands expand and contract as volatility (measured by ATR) expands and contracts. Since most price action will be encompasse
FREE
KMB Smart Pattern Analyzer PRO
Karwan Msto Mohammed Mohammed
Product Overview KMB Smart Pattern Analyzer PRO is an advanced technical analysis indicator designed to detect and rank high-probability market patterns inside a user-defined chart range. The indicator combines multiple analysis engines in one professional tool: Candlestick pattern analysis Classic chart pattern recognition Harmonic structure detection Smart market structure / SMC-style analysis Instead of showing random signals across the full chart, the indicator allows the user to focus on a
FREE
Advanced Trend Builder is a trend indicator using the original calculation algorithm. ATB can be used on any data and timeframe. My recommendation use for calculation numbers 4 - 16 - 64 - 256 and so on ..., but this is only recommendation. The middle of the trend wave is a special place where market behavior is different, when developed ATB was main idea to find the middle of the wave trend. Input parameters: Bars will be used for calculation - number of bars used for a trend line calculation.
FREE
Impulse MACD
Elie Baptiste Granger
5 (1)
The Impulse MACD is a technical indicator that combines the power of multiple moving averages to create a unique momentum oscillator. Unlike traditional MACD indicators, this tool uses three different moving averages applied to high, low, and weighted price data to generate more precise market impulse signals. Its strength is its excellent filtering capability during ranging markets. Visual Elements Color-coded Histogram : Dynamic green/red bars that change color based on momentum direction Sign
FREE
Mitimom
Danil Poletavkin
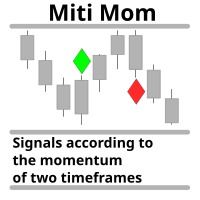
The indicator is based on Robert Miner's methodology described in his book "High probability trading strategies" and displays signals along with momentum of 2 timeframes. A Stochastic oscillator is used as a momentum indicator. The settings speak for themselves period_1 is the current timeframe, 'current' period_2 is indicated - the senior timeframe is 4 or 5 times larger than the current one. For example, if the current one is 5 minutes, then the older one will be 20 minutes The rest of the s
FREE
Gold Levels MTF MT5
Sergei Linskii
5 (8)
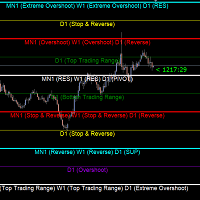
Gold Levels MTF - this is a fine stock technical indicator. The indicator algorithm analyzes the movement of the asset price, displays price levels of support and resistance from all time frames (TF) using the Murray method based on the Gann theory. The indicator indicates overbought and oversold fields, giving an idea of possible reversal points and at the same time giving some idea of the strength of the current trend. Description of levels: (Extreme Overshoot) - these levels are the ultimate
FREE
This indicator is an automated version of the Fibonacci retracement (Fib) indicator. Deciding the best areas to use when drawing the fib can be tricky and this  indicator was made with that in mind. When you drop it on the chart it will automatically choose the best points to draw the fib with, but in case you aren't satisfied with those regions, you can adjust it as you wish.
FREE
Buyers of this product also purchase
Trend Sniper X
Sarvarbek Abduvoxobov
4.87 (46)
Trend Sniper X is a multi-timeframe trend-following indicator for MetaTrader 5 that helps traders identify trend direction and potential reversal points with clarity and precision. for MT4: https://www.mql5.com/en/market/product/193245 Price Information: The current price is promotional and is subject to change as upcoming updates and new features are released. Bonus Offer: To get the FREE Auto-Trade Assistant EA for this indicator, please message the author after purchasing. Code2Profit Channe
A new King in town - Indicator + Order management indications(tp1+tp2+tp3) + Optional Telegram Signal sender   INCLUDED (FREE) + Bonus EA Robot ( FULL TRADING  and SIGNAL SYSTEM ) Our best EA for Gold: Gold Slayer TRY > Reversion Queen  Expert advisor >JOIN Community Channel < NEW Free Automation EA link < click here ( disclaimer: this is new and still on testing and phase , use at your risk on demo) Free Telegram Bridge < click here  This indicator includes an advanced Strategy, a trading sys
Smart Trend Trading System — MetaTrader 5 Message me on MQL5 after purchase to receive Smart Universal Expert Advisor for FREE, plus the online course, PDF manual, and private group access. STTS brings trend direction, entry and exit signals, reversal zones, and important price levels together on your chart. Follow the system manually, or connect a separate compatible EA for automated execution using your chosen settings. ONE SYSTEM. FOUR TRADING APPROACHES. STTS organizes its trading approaches
Entry Points Pro shows you where to enter, where to put the stop and what lot to trade — before you place the order. PRICE Now 199 USD: 4 copies at this price, then 249 USD. The final price is 349 USD. I make my money trading the markets, and I show it, so I don't need to sell this indicator to everyone. It is a tool for traders who think for themselves, not a magic button. No breakout, no trade. A gray arrow is a cancelled signal: price did not break the signal candle, so there was no entry
Gann Made Easy   is a professional and easy to use Forex trading system which is based on the best principles of trading using the theory of W.D. Gann. The indicator provides accurate BUY and SELL signals including Stop Loss and Take Profit levels. You can trade even on the go using PUSH notifications. PLEASE CONTACT ME AFTER PURCHASE TO GET TRADING  INSTRUCTIONS   AND GREAT EXTRA INDICATORS  FOR FREE! Probably you already heard about the Gann trading methods before. Usually the Gann theory is a
SuperScalp Pro
Van Minh Nguyen
4.54 (37)
SuperScalp Pro - Professional Multi-Layer Confluence Scalping System SuperScalp Pro is an advanced scalping indicator that upgrades the classic Supertrend with multiple intelligent confirmation filters. It helps you identify higher-probability Buy/Sell opportunities while significantly reducing false signals. Clear Buy and Sell arrows appear directly on the chart, along with automatic ATR-based Stop Loss and Take Profit levels calculated in real time. After purchase, please message me on MQL5 to
M5 Sniper
MeanFX
5 (4)
Get your trading edge in the line of sight M5 Sniper   is a new indicator by MeanFX. It combines   precise trading signals   with   adaptive TP/SL levels   - creating best possible statistical trades as a result! The price increases every 5 purchases, the next price is 79$ Message me after purchase to receive tips/guide and bonus EA plus trading methodology Auto Optimisation only works on LIVE chart , needs data feed >JOIN Community Channel < What makes it stand out?   Proven statistical per
SMC Intraday Formula
VividMind Digital Solutions
5 (26)
Secure the Lowest Price Today. After purchase, contact via   MQL5 inbox   to receive your buyer kit and bonus. Let's be honest first. No indicator will make you profitable on its own. If someone tells you otherwise, they're selling you a dream. Every indicator that shows perfect buy/sell arrows can be made to look flawless — just zoom into the right window of history and screenshot the winners. We won't do that. SMC Intraday Formula is a tool. It reads the market structure for you, maps the hig
Zoryk Gold
Reda El Koutbane
4.68 (22)
discount ends SOON next price 69 $ ZORYK — Advanced XAUUSD Signal System for MetaTrader 5 You know the feeling. You spend time analyzing gold. You wait for the entry. You finally open the trade, and price immediately moves against you. You close too early, move the Stop Loss or hesitate for a few seconds. Then the market reaches the exact destination you originally expected without you. The direction was not always the problem. The real problem was uncertainty. You did not know exactly where th
Ultra Indicator
Ihor Otkydach
5 (1)
ULTRA is a technical indicator that operates on an “all-in-one” basis—it independently analyzes the market, generates trading signals, displays levels for setting stop-loss orders, and suggests when to close trades to lock in profits or minimize losses. In other words, it doesn't matter if you don't know how to analyze the market, determine levels—where to set your stop-loss—or struggle with money management. ULTRA will do all of that for you! BUYER BONUS: After purchasing the ULTRA indicator, s
GoldenX Entry MT5
VividMind Digital Solutions
5 (17)
Price will increase by $20 every 10 buyers to maintain premium value. After purchase, contact via   MQL5 inbox   to receive your buyer kit and bonus. You have probably tested dozens of indicators before. But we are not here to be “just another signals indicator.” Behind GoldenX Entry is intensive research & development focused on building sophisticated algorithms designed to adapt to the real behavior of every instrument — not generic signals recycled everywhere else. From advanced Auto Optim
Gold Trend Coach MT5
Cristhian Alexander Gaibor Cuasquer
4.27 (11)
Non-repainting buy and sell signals for gold (XAUUSD) on MetaTrader 5. Every signal comes with a stop loss and three take profits. A Smart Money Concepts filter with BOS and CHoCH, so you trade with the structure, not against it. A live Mentor on your panel that guides every step from the entry to TP3. And alerts straight to your phone and your own Telegram channel. That is Gold Trend Coach. Never trade alone again. FREE BUYER KIT with your purchase: 1. Telegram Alert Bridge: your signals go to
Boba Analysis Suite
Trade Ready Solutions LLC
5 (2)
Boba Analysis Suite Boba Analysis Suite is an analytical indicator for MetaTrader 5. It brings market structure, relevant price zones and broader market context together in a single chart view. Developed through practical experience as a trader and trading coach, it supports a structured analysis process: assessing market direction, identifying important levels and considering multiple timeframes together. Analysis in Context Individual signals gain meaning through context. Boba Analysis Suite h
FX Power MT5 NG
Daniel Stein
5 (33)
FX Power: Analyze Currency Strength for Smarter Trading Decisions Overview FX Power is your go-to tool for understanding the real strength of currencies and Gold in any market condition. By identifying strong currencies to buy and weak ones to sell, FX Power simplifies trading decisions and uncovers high-probability opportunities. Whether you’re looking to follow trends or anticipate reversals using extreme delta values, this tool adapts seamlessly to your trading style. Don’t just trade—trade
Power Candles MT5
Daniel Stein
4.58 (12)
Power Candles - Self-Optimizing Strength Indicator Strength usually lives in a sub-window. The line runs below, the candle above, and your eye keeps connecting the two. Power Candles puts the strength into the candle itself, colored from dark red to dark green, so the chart reads at a glance and the sub-window stays closed. The indicator also finds its own settings for the symbol and timeframe in front of you. One click on [ Apply Best ] draws entry, Stop Loss and Take Profit at the exact prices
M1 Sniper MT5
Oleg Rodin
5 (7)
M1 SNIPER  is an easy to use trading indicator system. It is an arrow indicator which is designed for M1 time frame. The indicator can be used as a standalone system for scalping on M1 time frame and it can be used as a part of your existing trading system. Though this trading system was designed specifically for short-term trading, it still can be helpful for all traders. This trading system can be used with any forex pair and time frame, though lower time frames are recommended from M1 up to M
Atomic Analyst MT5
Issam Kassas
4.51 (65)
Atomic Analyst — MetaTrader 5 Message me on MQL5 after purchase to receive Smart Universal Expert Advisor for FREE, plus the online course, PDF manual, and private group access. Atomic Analyst brings price action, trend direction, entry and exit signals, Stop Loss and multiple Take Profit levels together on your chart. SEE THE SIGNAL. UNDERSTAND THE SETUP. Atomic Analyst organizes its analysis into clear visual information: • Buy and sell arrows to identify potential entries. • Stop Loss and mul
Smc Pro ToolKit
Talal N Z Aljarusha
5 (13)
SMC PRO TOOLKIT — SMART MONEY ANALYSIS & STRUCTURED TRADE PLANNING SMC Pro ToolKit is a professional Smart Money Concepts analysis workspace for MetaTrader 5. It combines market structure, multi-timeframe analysis, institutional price zones, setup evaluation, confirmation tools, volume context, alerts, and risk planning inside one organized chart environment. One workspace. Multiple layers of confirmation. One structured trading plan. OPEN COMPLETE USER GUIDE MULTI-CONDITION SETUP ENGINE At
Auto Optimized SpeedAngle is an institutional-grade momentum vectoring system that eliminates curve-fitting through continuous Walk-Forward Optimization (WFO). Rather than relying on static inputs that degrade when market regimes shift, the indicator dynamically recalibrates its parameters using Out-of-Sample (OOS) validation, ensuring the displayed signals represent genuine statistical edges rather than historical anomalies. By shifting the focus from subjective visual angles to normalized, qua
Azimuth Pro
Ottaviano De Cicco
5 (7)
Azimuth Pro V2: Synthetic Fractal Structure and Confirmed Entries for MT5 Overview Azimuth Pro is a multi-level swing structure indicator by Merkava Labs . Four nested swing layers, swing-anchored VWAP, ABC pattern detection, three-timeframe structural filtering, and closed-bar confirmed entries — one chart, one workflow from micro-swings to macro-cycles. This is not a blind signal product. It is a structure-first workflow for traders who care about location, context, and timing. 1. What Change
Gold Entry Sniper
Tahir Mehmood
5 (23)
Gold Entry Sniper – Professional Multi-Timeframe ATR Dashboard for Gold Scalping & Swing Trading Gold Entry Sniper is a cutting-edge MetaTrader 5 indicator designed to give traders precise buy/sell signals for XAUUSD and other symbols, powered by ATR Trailing Stop logic and a multi-timeframe analysis dashboard . Built for both scalpers and swing traders, it combines real-time market direction , dynamic stop levels , and professional visual dashboards to help you identify high-probability gold en
Apex Patterns PRO Buy Indicator - Get Expert Advisor Based on it for FREE. Self-Optimizing Chart Pattern & Breakout Intelligence Traditional pattern scanners rely on fixed inputs, often underperforming when market volatility and structures shift. Apex Patterns PRO is designed to adapt to changing market conditions by combining structural chart pattern recognition, momentum filtering, and statistical self-optimization into one analytical framework. Adaptive Scanning Engine Self-Optimizing Patter
Meridian Pro
Ottaviano De Cicco
4 (3)
Meridian Pro 2.00: Professional Multi-Timeframe Trend Matrix for MT5 Meridian Pro 2.00 is a professional adaptive trend matrix for MetaTrader 5. It combines the original Meridian trend engine, a clean chart ribbon, closed-bar signal arrows, an 8-timeframe dashboard, Fuel momentum, weighted consensus, synthetic HTF processing and chart-native higher-timeframe context lines. The goal is simple: read current trend, multi-timeframe structure, strength, momentum and EA-ready state from one discipline
Welcome to Entry In The Zone & SMC Multi Timeframe Entry In The Zone & SMC Multi Timeframe An indicator designed for market analysis based on Smart Money Concepts (SMC), displaying Market Structure, Key Zones (Order Blocks, Supply & Demand Zones, and Fair Value Gaps), Liquidity, and real-time BUY / SELL signals. It supports both Single-Timeframe and Multi-Timeframe analysis, along with the Confluence at Zone feature, which helps you evaluate supporting factors when price enters a key zone. Real-
Divergence Bomber
Ihor Otkydach
4.89 (94)
Each buyer of this indicator also receives the following for free: The custom utility "Bomber Utility", which automatically manages every trade, sets Stop Loss and Take Profit levels, and closes trades according to the rules of this strategy Set files for configuring the indicator for various assets Set files for configuring Bomber Utility in the following modes: "Minimum Risk", "Balanced Risk", and "Wait-and-See Strategy" A step-by-step video manual to help you quickly install, configure, and
Adaptive Price Action Engine Buy Indicator- Get EA Based on it for FREE. Self-Optimizing Multi-Timeframe Trend & Candlestick Intelligence Markets do not behave the same way all the time—and not every price-action pattern has the same value in every market regime. Adaptive Price Action Engine is designed to adapt to changing market conditions by combining trend structure, multi-timeframe analysis, candlestick patterns, and statistical optimization into one analytical framework. Two Adaptive Mode
Currency Strength Wizard   is a very powerful indicator that provides you with all-in-one solution for successful trading. The indicator calculates the power of this or that forex pair using the data of all currencies on multiple time frames. This data is represented in a form of easy to use currency index and currency power lines which you can use to see the power of this or that currency. All you need is attach the indicator to the chart you want to trade and the indicator will show you real s
Crystal Heikin Ashi Signals
Muhammad Jawad Shabir
5 (5)
Crystal Heikin Ashi Signals—Professional Trend & Signal Detection Indicator Advanced Heikin Ashi Visualization with Intelligent Signal System for Manual & Automated Trading Final Price: $149 ---------> Price goes up $10 after every 10 sales . Limited slots available — act fast . Overview User Guide PDF Crystal Heikin Ashi Signals is a professional-grade MetaTrader 5 indicator that combines pure Heikin Ashi candle visualization with an advanced momentum-shift detection system. Designed for both m
Naked Forex Tweezer Pro Indicator Tweezer Pro Indicator is a pattern recognition indicator for Forex, Stocks, Indices, Futures, Commodities and Cryptos. The standard Tweezer is a two bar pattern. Our enhanced version is a multi-bar pattern. We filter the patterns for you so that you only get the     best and most effective patterns   and ignore the noise. The Tweezer pattern is a simple and effective pattern to trade. The strategy that comes with the Tweezer is based on price action. The Twe
FiboSniper Pro
Van Minh Nguyen
5 (4)
FiboSniper Pro - Multi-Filter Fibonacci System with Auto SL/TP and Control Panel FiboSniper Pro is a technical indicator that combines dynamic Fibonacci Envelopes with multiple confirmation filters to generate selective Buy and Sell signals. Fibonacci levels are calculated from Moving Average and ATR, then filtered by ADX, EMA, RSI, ATR, Volume, Time and Candle structure. The indicator displays automatic ATR-based Stop Loss and Take Profit levels directly on the chart, along with an interactive
More from author
Fabii Universal Trend Baseline
Fabien Georges Andre Guillemaud
Test 18 baselines on one chart and keep the one that fits your market. One dropdown, one logic, no second indicator. No repaint. Any pair, any market, any timeframe. Free demo in the Strategy Tester. Get more indicators here Baselines, volatility filters and oscillators. No repaint. Why you need it The baseline that works on one pair reacts too late on another, or too often in a range. Changing it means loading another indicator and rebuilding your chart. So you keep a baseline that does not
Fabii Half Trend Baseline
Fabien Georges Andre Guillemaud
Stop trading against the higher timeframe trend. Two baselines, one chart. No repaint. Any pair, any timeframe. On your chart in 2 minutes. Free demo in the Strategy Tester. Get more indicators here Baselines, volatility filters and oscillators. No repaint. Why you need it You enter a trade because a line turned green on your chart. Then you open a higher timeframe and see that the bigger trend points the other way. The signal was real. The trend behind it was not on your side. Every trade ta
Fabii Adaptive Trend Baseline
Fabien Georges Andre Guillemaud
Stay in the trend with a baseline that slows down in noise and speeds up in moves. Five adaptive averages. No repaint. Any pair, any market, any timeframe. Free demo in the Strategy Tester. Get more indicators here Baselines, volatility filters and oscillators. No repaint. Why you need it A fixed-speed average lags in a strong move and jumps around in noise. You enter late, or you enter on a small swing. Neither entry matches the market you are trading. Every late or noisy entry costs you a s
FREE
Fabii Volatility ATR Percentile
Fabien Georges Andre Guillemaud
See if Average True Range (ATR) volatility is quiet or stretched, as a 0 to 100 rank. No repaint. Any pair, any timeframe. On your chart in 2 minutes. Free demo in the Strategy Tester. Get more indicators here Baselines, volatility filters and oscillators. No repaint. Why you need it A raw ATR value such as 0.0040 tells you little. Is that high for this pair right now, or normal? To know, you have to scroll back through weeks of bars and guess. So you enter a trade in a market that is asleep,
FREE
Fabii Essential Trend Baseline
Fabien Georges Andre Guillemaud
Stop entering trend flips that have no momentum behind them. One line, one chart, no second indicator. No repaint. Any pair, any market, any timeframe. On your chart in 2 minutes. Free to test in the Strategy Tester. Get more indicators here Baselines, volatility filters and oscillators. No repaint. Why you need it You enter because the line turned green. Price drifts for ten bars, then reverses. The signal was real, but the momentum was not. Every entry on a weak flip costs you a stop loss.
FREE
Fabii Ehlers Trend Baseline
Fabien Georges Andre Guillemaud
Read the trend on a smoother line with fewer small wiggles. Five signal-processing filters, one chart. No repaint. Any pair, any market, any timeframe. Free demo in the Strategy Tester. Get more indicators here Baselines, volatility filters and oscillators. No repaint. Why you need it A noisy line flips on every small swing. You see a new signal, you enter, and the move reverses. Each false flip costs you a stop loss. What you get Fabii Ehlers Trend Baseline is a baseline indicator with five
FREE
Fabii NNFX Atr Levels
Fabien Georges Andre Guillemaud
Plan every trade with one click: Entry, Take Profit and Stop Loss drawn for you. No repaint. Any pair, any timeframe. On your chart in 2 minutes. Free to test in the Strategy Tester. Get more indicators here Baselines, volatility filters and oscillators. No repaint. Why you need it You plan an Average True Range (ATR) trade by hand. You read the ATR, multiply it, convert it to price, then calculate the lot size. Each step can add an error, and the numbers are different on every trade. A mispl
FREE
Fabii Atr Volatility Zones
Fabien Georges Andre Guillemaud
See if each candle's volatility is low, medium or high for this market, in three colors. No repaint. Any pair, any timeframe, any market. On your chart in 2 minutes. Free to test in the Strategy Tester. Get more indicators here Baselines, volatility filters and oscillators. No repaint. Why you need it The same range means different things on different markets and at different times. You look at the last candle and cannot tell if its range is large or small for this market right now. Fixed Ave
FREE
Fabii Supertrend NMA
Fabien Georges Andre Guillemaud
Hold the trend through range noise with a SuperTrend on an adaptive center. No repaint. Any pair, any timeframe. On your chart in 2 minutes. Free to test in the Strategy Tester. Get more indicators here Baselines, volatility filters and oscillators. No repaint. Why you need it You enter because the SuperTrend flipped. Price moves sideways for a few bars, the line flips back, and you are out of the trade or you skip the next signal. The classic SuperTrend is centered on median price, so each w
FREE
Fabii Vwap SSL Baseline
Fabien Georges Andre Guillemaud
Stop guessing which VWAP cross matters: one coloured line shows your side. No repaint. Any pair. Daily, weekly or monthly anchor. On your chart in 2 minutes. Free to test in the Strategy Tester. Get more indicators here Baselines, volatility filters and oscillators. No repaint. Why you need it Most traders read the Volume Weighted Average Price (VWAP) as a single line and argue about every touch. This baseline gives a clear side instead: green when buyers hold the period, red when sellers do.
FREE
Fabii Kaufman Efficiency Ratio
Fabien Georges Andre Guillemaud
See at a glance whether price is trending or just moving in noise, on one line from 0 to 1. No repaint. Any pair, any timeframe. On your chart in 2 minutes. Free demo in the Strategy Tester. Get more indicators here Baselines, volatility filters and oscillators. No repaint. Why you need it You see a clean move on the chart and you enter. A few bars later price stalls, drifts sideways and takes you out. The move looked like a trend, but most of it was back and forth. Direction alone does not t
FREE
Fabii Volatility Bias
Fabien Georges Andre Guillemaud
Spot which side, up or down, drives volatility in one zero-centered histogram. No repaint. Any market, any timeframe. On your chart in 2 minutes. Free demo in the Strategy Tester. Get more indicators here Baselines, volatility filters and oscillators. No repaint. Why you need it A move looks strong: green candles, price climbing. But you cannot tell if real upward volatility carries it, or if it creeps up in small steps while the larger swings point down. A normal volatility reading shows how
Fabii Rsx Ema Oscillator
Fabien Georges Andre Guillemaud
Stop guessing when momentum turns: a smooth RSX line and a signal cross show you. No repaint. Any pair, any timeframe. On your chart in 2 minutes. Free demo in the Strategy Tester. Get more indicators here Baselines, volatility filters and oscillators. No repaint. Why you need it You watch a momentum oscillator and every touch of its signal line looks like a turn. The line jumps from candle to candle, the histogram flips color on small moves, and you are left deciding which cross matters. You
Fabii Adxvma Ssl Channel
Fabien Georges Andre Guillemaud
One clean trend line that follows the lows while the trend holds, and flips above price only when the move truly turns. No repaint. Any pair, any timeframe. Every flip is final on bar close. Try it free on your own charts in the Strategy Tester. >> Get more free indicators here Baseline, volatility, oscillators & more — free and premium. No repainting. No guessing. Just clean signals. THE PROBLEM Most trend lines flip too early. A classic SSL channel rides two simple moving averages,
FREE
Fabii Memory Baseline
Fabien Georges Andre Guillemaud
Read the trend and its higher timeframe on one chart, with a line that holds its level. No repaint. Any pair, any timeframe. On your chart in 2 minutes. Free demo in the Strategy Tester. Get more indicators here Baselines, volatility filters and oscillators. No repaint. Why you need it A plain moving average falls behind price. After a strong move, the line stays far from price and gives you a level that no longer matters. To check the higher timeframe, you switch charts and lose the picture
FREE
Fabii Yang Zhang Volatility Filter
Fabien Georges Andre Guillemaud
Know when volatility is enough to trade — live, no repaint, on any pair. Any pair, any timeframe. Lines lock on bar close. Free demo in the Strategy Tester. >> Get more free and premium indicators here Baseline, volatility, oscillators and more. No repainting. No guessing. Just clean signals. THE PROBLEM Your entry can be right and still go nowhere. When the market is quiet, price drifts, stops get tagged by noise and targets take forever. Every bar you trade in a quiet market is a tra
Fabii Nma Ssl Channel
Fabien Georges Andre Guillemaud
Get a clear trend line that holds in trends and stays quiet in noise — no repaint. Any pair, any timeframe. Signals lock on bar close. Free to download. Test it in the Strategy Tester before using it live. >> Get more free indicators here Baseline, volatility, oscillators & more — free and premium. No repainting. No guessing. Just clean signals. THE PROBLEM Most SSL channels use a fixed-speed moving average. That means the line reacts the same whether price is trending hard or grindin
FREE
Fabii Ehlers Adaptive Bands
Fabien Georges Andre Guillemaud
Know exactly when the trend flips — before you miss the move. Signals lock on bar close, no repaint. Any pair, any timeframe. Free demo in the Strategy Tester. THE PROBLEM Most trend tools give you a direction — but they keep repainting until the bar closes, or they lag so far behind that the entry is gone by the time they confirm. You end up either chasing or sitting out clean moves. Every bar you misread the regime is a trade you size wrong or skip entirely. THE SOLUTION Fabi
FREE
Fabii Volatility Acceleration Index
Fabien Georges Andre Guillemaud
See at a glance when volatility is speeding up before a move — and when it is fading into a dead market. Any pair, any timeframe. No repaint — signals are final on bar close. Try it free in the Strategy Tester before you buy. THE PROBLEM Most volatility tools tell you how big the range is right now. They do not tell you the one thing that matters for timing: is volatility accelerating or slowing down? You end up entering just as a move runs out of steam, or sitting out while a breakout
FREE
Fabii Adxvma Ssl Pro
Fabien Georges Andre Guillemaud
One adaptive SSL trend line that only flips when the move is real, plus a second SSL baseline from a higher timeframe on the same chart, Buy/Sell arrows, and an ATR filter that blocks weak signals before they reach you. No repaint. Try the free version first: Fabii Adxvma Ssl Channel. THE PROBLEM A classic SSL channel flips on every small push. Even the adaptive ADXVMA version flips too often in choppy markets, fires arrows on signals that reverse the next bar, and shows you only one ti
Fabii Nma Ssl Pro
Fabien Georges Andre Guillemaud
Know the trend direction before you enter — adaptive SSL line with an ATR filter that blocks weak flips. No repaint. Any pair, any timeframe. Signals lock on bar close. Test it free in the Strategy Tester before buying. THE PROBLEM Standard SSL channels flip at every small push against the trend. You take the signal, price reverses immediately, and you stop out. Tighten the filter, you miss real moves. Loosen it, you drown in noise. And watching one timeframe only, you never know whethe
Fabii Responsive Trend Baseline
Fabien Georges Andre Guillemaud
Spot trend flips sooner with a low-lag baseline. Five fast averages, one chart, no second indicator. No repaint. Any pair, any market, any timeframe. Free demo in the Strategy Tester. Get more indicators here Baselines, volatility filters and oscillators. No repaint. Why you need it A slow average confirms the trend after the move is already underway. You see the flip late and you enter late. Every late entry costs you a worse price and a wider stop loss. What you get Fabii Responsive Trend B
Fabii Htf Po3 Candle Projection
Fabien Georges Andre Guillemaud
See the higher timeframe candle form next to price, with a countdown to its close. No repaint. Any symbol. On your chart in 2 minutes. Free to test in the Strategy Tester. Get more indicators here Baselines, volatility filters and oscillators. No repaint. Why you need it You trade on M5 or M15, but the daily candle sets the frame for the day. To see where it opened, how far it has stretched and how long it has left, you switch to another chart or open a second window. Each switch takes your e
Fabii Memory Distance Oscillator
Fabien Georges Andre Guillemaud
See how far price has stretched from its baseline, and when it starts to pull back. One histogram, one read. No repaint. Any pair, any timeframe, any market. On your chart in 2 minutes, free. Get more indicators here Baselines, volatility filters and oscillators. No repaint. Why you need it You see a strong move and you want in. Price is already far from its average, you enter late, and the market pulls back right after. Or you wait for a pullback and cannot tell a pause from the end of the t
Fabii Memory Support Resistance
Fabien Georges Andre Guillemaud
Stop guessing which support and resistance zones matter: each one shows how many times price tested it. No repaint. Any pair, any timeframe. On your chart in 2 minutes. Free to test in the Strategy Tester. Get more indicators here Baselines, volatility filters and oscillators. No repaint. Why you need it You draw support and resistance by hand, and two traders never draw the same levels on the same chart. You do not know which levels deserve your attention. You place a stop behind a level tha
Fabii Confluence Oscillator
Fabien Georges Andre Guillemaud
Stop counting signals by eye: seven classic indicators vote in one score from -100 to +100. No repaint. Any pair, any timeframe. On your chart in 2 minutes. Free to test in the Strategy Tester. Get more indicators here Baselines, volatility filters and oscillators. No repaint. Why you need it You stack several indicators in sub-windows and count their signals by eye. One turns up, another is flat, a third points the other way. You enter on a majority that was only one vote deep, price drifts
Fabii Elder Market Thermometer
Fabien Georges Andre Guillemaud
See when a quiet market wakes up. A Market Thermometer with wake-up alerts and five averages. No repaint. Any pair, any timeframe. On your chart in 2 minutes. Free to test in the Strategy Tester. Get more indicators here Baselines, volatility filters and oscillators. No repaint. Why you need it You take a trade, price barely moves, and the setup fades in a market that was asleep. The market had no energy to follow your signal. A quiet market costs you time and spread. What you get Fabii Elder
Fabii Metro Step RSI
Fabien Georges Andre Guillemaud
Stop entering on momentum swings that reverse one bar later. Two step lines, one chart. No repaint. Any pair, any timeframe. On your chart in 2 minutes. Free to test in the Strategy Tester. Get more indicators here Baselines, volatility filters and oscillators. No repaint. Why you need it You watch the Relative Strength Index (RSI) turn and you enter. A few bars later it reverses: the signal was only noise. The RSI moves with every candle, so a small swing looks like a new trend, and you pay
Fabii Half Trend Mtf Alignment
Fabien Georges Andre Guillemaud
See when three timeframes agree on trend direction, in one strip under your chart. No repaint. Any pair, any timeframe from M1 to W1. On your chart in 2 minutes. Free to test in the Strategy Tester. Get more indicators here Baselines, volatility filters and oscillators. No repaint. Why you need it You take a trade on one timeframe, then find the higher timeframe pointed the other way. Checking means switching charts, and in a fast market you skip it. Entries against the higher trend are the o
Filter:
No reviews
Reply to review