Fabii Yang Zhang Volatility Filter
- Indicatori
-
Fabien Georges Andre Guillemaud
 Sviluppo indicatori personalizzati e strumenti di trading per MetaTrader 5.
 - Versione: 1.10
- Aggiornato: 9 ottobre 2026
- Attivazioni: 20
Scopri quando la volatilità basta per operare — dal vivo, senza repaint, su qualsiasi coppia.
Qualsiasi coppia, qualsiasi timeframe. Le linee si fissano alla chiusura della candela.
Demo gratuita nello Strategy Tester.
>> Get more free and premium indicators here
Baseline, volatility, oscillators and more.
No repainting. No guessing. Just clean signals.
▬▬▬ IL PROBLEMA ▬▬▬
Il tuo ingresso può essere giusto e non portare da nessuna parte. Con il mercato fermo, il prezzo va alla deriva, il rumore colpisce gli stop e gli obiettivi tardano.
Ogni candela operata in un mercato fermo è un trade che impegna il tuo rischio per poco movimento.
▬▬▬ LA SOLUZIONE ▬▬▬
Vedi a colpo d'occhio se il mercato si muove abbastanza da meritare il tuo tempo. Una linea, due colori: verde significa vai, grigio significa aspetta. Decidi con un sì o un no chiaro prima di cercare l'ingresso.
▬▬▬ PERCHÉ YANG-ZHANG ▬▬▬
Yang-Zhang è uno stimatore di volatilità che usa apertura, massimo, minimo e chiusura. Considera il gap tra una candela e la successiva. Una misura basata solo sulle chiusure ignora parte di quel movimento. Yang-Zhang lo include.
▬▬▬ COME FUNZIONA ▬▬▬
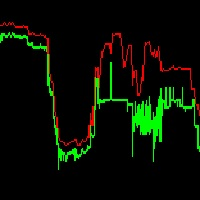
In una finestra separata vengono disegnate due linee Yang-Zhang:
- Linea veloce (predefinita 3 candele): la volatilità attuale. Verde quando è pari o sopra la linea lenta, grigia quando è sotto.
- Linea lenta (predefinita 21 candele): il livello di riferimento, tratteggiato. Si adatta a ogni strumento, quindi non imposti soglie a mano.
Banda opzionale: una banda a due colori sotto l'oscillatore mostra lo stesso stato su un timeframe superiore. Ogni candela mostra l'ultima candela chiusa del timeframe superiore.
▬▬▬ CARATTERISTICHE ▬▬▬
- Senza repaint — i segnali sono definitivi alla chiusura della candela, quindi puoi fidarti dello storico.
- Linea di riferimento che si regola da sola, quindi nessuna soglia da impostare per ogni coppia.
- Solo due colori, quindi leggi lo stato in un secondo.
- Banda del timeframe superiore, quindi vedi il quadro generale senza cambiare grafico.
- Avvisi popup, sonoro e push al cambio di colore, quindi non devi guardare il grafico.
- Pannello di stato sul grafico, quindi lo stato è leggibile anche con la finestra dell'oscillatore chiusa.
- Leggibile da un Expert Advisor tramite iCustom, quindi puoi usarlo come filtro nel tuo EA.
- Opzione di limite delle candele, quindi gli storici lunghi restano veloci.
▬▬▬ PARAMETRI ▬▬▬
| Parameter | Description | Default |
|---|---|---|
| Fast window (raw intensity) | Fast Yang-Zhang period: the current volatility | 3 |
| Slow window (reference level) | Slow Yang-Zhang period: the reference line | 21 |
| Fast >= slow (sufficient) | Colour of the fast line when volatility is sufficient | LimeGreen |
| Fast < slow (insufficient) | Colour of the fast line when volatility is insufficient | Gray |
| Slow reference line | Colour of the slow line | DimGray |
| Fast line width | Thickness of the fast line | 2 |
| Slow line width | Thickness of the slow line | 1 |
| Which colour shift alerts | Alert on both shifts, only on expansion, or only on insufficient | ALERT_BOTH |
| Popup alert on shift | Show a popup when the colour changes | false |
| Play sound on shift | Play a sound when the colour changes | false |
| Push notification on shift | Send a push notification to your phone | false |
| Sound file name | Sound file used by the sound alert | alert.wav |
| Limit to the N most recent bars | Calculate only the latest bars to keep charts fast | true |
| Bars to compute (min 50) | Number of bars calculated when the limit is on | 500 |
| Higher timeframe | Timeframe shown in the band. Current timeframe means no band | Current |
| Higher timeframe band width | Thickness of the band | 3 |
| Status panel | Show the status panel on the chart | false |
▬▬▬ COME USARLO ▬▬▬
- Aggiungi l'indicatore a qualsiasi grafico. L'oscillatore si apre in una finestra propria.
- Grigio: aspetta. La volatilità è sotto il proprio riferimento.
- Verde: il mercato si muove abbastanza. Cerca il tuo ingresso abituale.
- Opzionale: imposta un timeframe superiore ed entra solo quando anche la banda è verde.
- Opzionale: attiva un avviso e lascia che il terminale ti segnali il cambio di colore.
L'indicatore misura quanto si muove il mercato, non in quale direzione. Non dà segnali di acquisto o vendita.
▬▬▬ PERCHÉ FIDARTI ▬▬▬
Senza repaint: i valori sono definitivi alla chiusura e la candela in corso è disegnata a parte.
Demo gratuita: puoi provarlo prima di acquistare.
Supporto: rispondo entro 24 ore.
Per provarlo: clicca Free Demo, poi eseguilo nello Strategy Tester in modalità visuale sulla tua coppia e sul tuo timeframe.
▬▬▬ PARTE DELLA SUITE FABII ▬▬▬
Fabii Volatility Acceleration Index: mostra quando la volatilità accelera o si attenua, con una banda di conferma su un timeframe superiore.
Tutti sono sulla mia pagina venditore (link in cima a questa pagina).
▬▬▬ SUPPORTO ▬▬▬
Hai una domanda o un problema? Scrivimi PRIMA — rispondo entro 24 ore e correggo in fretta. Se ti ha fatto risparmiare tempo in qualche trade, una breve recensione — anche una riga, indicando coppia e timeframe — aiuta altri trader a trovarlo.
▬▬▬ OTTIENILO ▬▬▬
Ottienilo e vedi il verde e il grigio sui tuoi grafici in 2 minuti. Provalo prima gratis nello Strategy Tester.
Il prezzo di lancio è 30 USD e sale a 49 USD dopo le prime 20 vendite.
Rispondo entro 24 ore. (Questo indicatore è uno strumento, non una consulenza finanziaria. Il trading comporta rischi.)