Fabii Yang Zhang Volatility Filter
- 지표
-
Fabien Georges Andre Guillemaud
 저는 MetaTrader 5용 맞춤형 지표와 트레이딩 도구를 개발합니다.
저 역시 트레이더입니다. 수년 동안 저만의 시스템 트레이딩 전략을 구축하고 개선해 왔습니다. 지표를 처음부터 설계하고, 다양한 조합을 테스트하며, 리스크 관리 매개변수를 최적화하고, 실제 시장 환경에서 코드를 디버깅해 왔습니다. 이러한 실전 경험 덕분에 고객이 설명을 끝내기 전에도 무엇이 필요한지 정확히 이해할 수 있습니다.
개발 가능한 항목:
맞춤형 지표 — 오실레이터, 오버레이, 멀티 타임프레임 버전
MT4 → MT5 변환 - 버전: 1.0
- 활성화: 20
Know at a glance whether the market is moving enough to justify a trade. No repaint.
Any pair, any timeframe, any market. Try it free in the Strategy Tester.
▬▬▬ THE PROBLEM ▬▬▬
Most losing trades are not wrong calls. They are good setups taken in a dead market.
Price drifts sideways, your stop gets clipped by noise, and the move you wanted never
comes. The hard part is not the signal. It is knowing when the market has enough
movement to be worth the risk in the first place.
▬▬▬ WHY YANG-ZHANG ▬▬▬
Most volatility tools measure only part of the picture. A plain moving average or a
close-to-close standard deviation looks at closing prices alone, so it ignores the
gap between one bar's close and the next bar's open, and it ignores how far price
travelled inside the bar. ATR captures the bar range but treats every bar the same
and does not separate overnight gaps from intraday movement.
The Yang-Zhang estimator uses the full open, high, low and close of every bar. It
combines three parts: the overnight gap, the open-to-close move, and the intrabar
range (the Rogers-Satchell term). Because it accounts for gaps and for drift at the
same time, it is one of the most efficient volatility estimators available, meaning
it gives a steadier, more accurate read from the same number of bars. In practice
that means fewer false "market is quiet" or "market is active" flips than a
close-only measure, and a reading you can trust on instruments that gap.
▬▬▬ HOW IT WORKS ▬▬▬
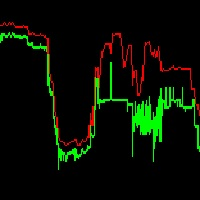
This indicator plots two Yang-Zhang volatility lines in a sub-window: a fast line that
reacts to the current bar, and a slow reference line that represents the recent normal.
The fast line turns green when volatility is at or above its reference (enough movement
to trade) and grey when it drops below (too quiet, stand aside). One colour, one
decision. The reading is self-scaling, so it works the same on a calm pair and a wild
one, with nothing to tune per symbol.
▬▬▬ KEY FEATURES ▬▬▬
- Two Yang-Zhang volatility lines: fast intensity and slow reference.
- Full OHLC estimator: accounts for gaps and intrabar range, not just closes.
- Self-scaling: no threshold to set per symbol or timeframe.
- Green means sufficient volatility, grey means insufficient. One glance.
- Regime-shift alerts on bar close: popup, sound and push, filterable.
- Live-bar value shown as a separate dotted line, never mixed with confirmed data.
- No repaint. Signals are final on bar close.
- Any pair, any timeframe, any market.
- Buffers exposed for use in your own Expert Advisor via iCustom.
▬▬▬ INPUTS ▬▬▬
| Parameter | Description | Default |
|----------------|----------------------------------------------------------------|----------------|
| Fast | Fast Yang-Zhang window (raw intensity) | 3 |
| Slow | Slow Yang-Zhang window (reference level) | 21 |
| Color Hi | Fast line when sufficient (at/above reference) | Lime Green |
| Color Lo | Fast line when insufficient (below reference) | Gray |
| Color Slow | Slow reference line | Dim Gray |
| Alert Mode | Both / To Sufficient / To Insufficient | Both |
| Alert Popup | Popup alert on colour shift | false |
| Alert Sound | Sound alert on colour shift | false |
| Alert Push | Push notification on colour shift | false |
| Max Bars | Recent bars to compute | 500 |
▬▬▬ HOW TO USE IT ▬▬▬
1. Attach it to any chart. It sits in its own sub-window.
2. Watch the fast line colour. Green means the market is active enough to trade.
3. Grey means volatility is below its recent normal. Skip or wait.
4. Combine it with your own entry method: take your signals only while the line is green.
5. Turn on alerts to be notified the moment volatility becomes sufficient again.
▬▬▬ PART OF THE FABII SUITE ▬▬▬
Follow my profile for updates and new tools built on the same clean, no-repaint approach.
▬▬▬ SUPPORT ▬▬▬
Questions? Message me — I answer within 24h.
▬▬▬ GET IT ▬▬▬
Launch price is $30 and rises to $49 after the first 20 sales.
Attach it to a chart, watch the line turn green, and take your next signal only when the
market is actually moving. Try it free in the Strategy Tester, and if it earns a place on
your charts, a short review helps other traders find it. Follow my profile.
(For educational use. Trading involves risk; you are responsible for your own decisions.)