Exhaustion Count Scanner
- Indicators
-
Evgenii Sutulov
 Premium components
1. https://www.mql5.com/en/market/product/201632 - Rotation Manager Console - Version: 1.3
- Activations: 20
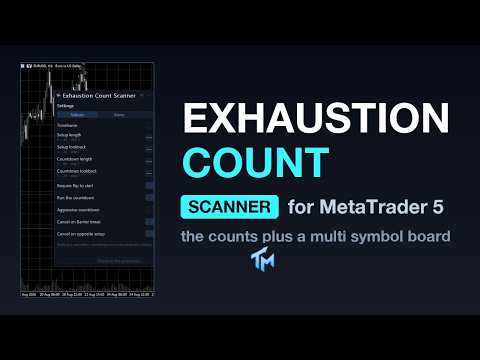
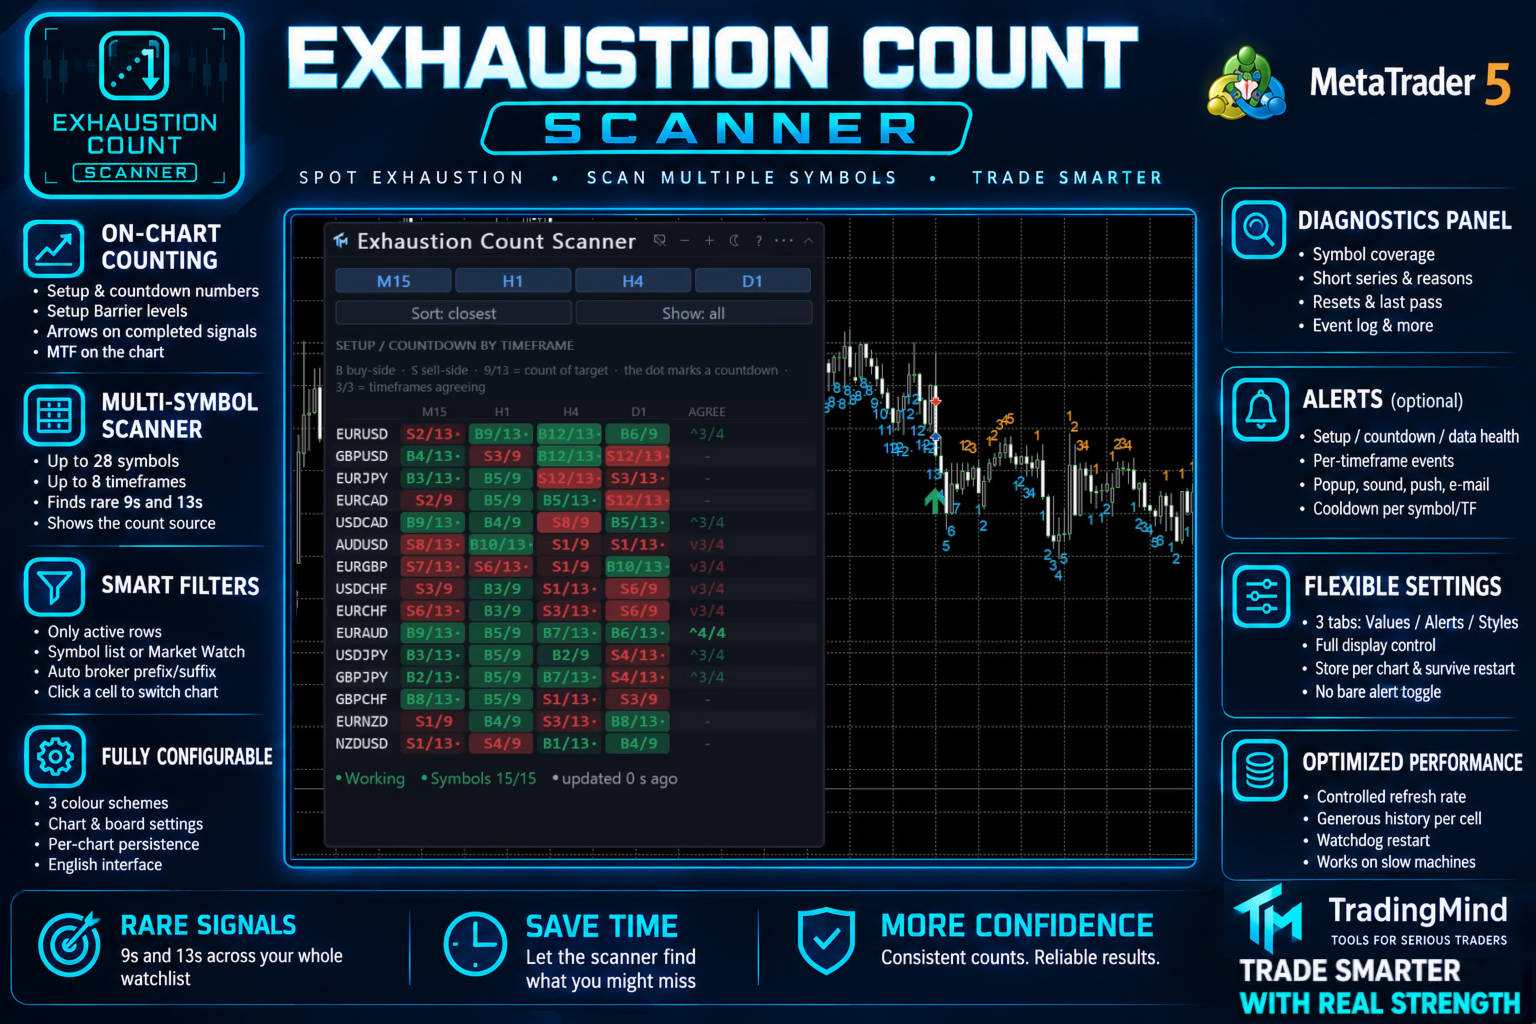
Exhaustion Count Scanner is two products in one file. The first is Exhaustion Count MTF itself, drawn on the chart in front of you: the setup and countdown numbers printed bar by bar, the Setup Barrier levels currently in force, and the arrows on completed signals. The second is a board that runs the same counting across a list of symbols on up to eight timeframes at once.
A nine or a thirteen is a rare event on any one instrument, which is exactly the case a board is for. The table finds them across the whole watch list, and the chart under it shows you the count that produced one without your having to attach a second indicator.
The counting block in this file is a verbatim copy of the one in the single-chart product. A scanner whose count disagrees with the indicator on the same chart is a scanner nobody trusts twice, and the only reliable way to keep two files agreeing is for the interesting one to exist once.
The board
A row per symbol, a column per scanned timeframe, up to eight timeframes and up to twenty-eight symbols. The symbol list is comma separated, or the board can take the Market Watch list instead. Broker prefix and suffix are detected from the chart you are on, or given by hand. Out of the box the board scans four: M15, H1, H4 and D1.
A cell reads like B7/9: the side, the count reached, and the count it is heading for. A dot after it marks a countdown rather than a setup. A full stop on its own means no count is running there, a dash means the cell could not be measured, and hovering any cell spells out in words which phase it is in, which side, how far it has got and whether the last setup was perfected.
The AGREE column takes the visible timeframe columns for that symbol, finds the majority side and prints v3/4: the direction the majority is on, and how many of the visible timeframes stand on it. Full agreement is drawn bold in that side's colour. A tie prints a dash and is deliberately not treated as a verdict, because calling a one-one split a signal would be the board inventing conviction. With one timeframe visible the column is dropped entirely rather than printing a 1/1 that restates the cell beside it.
Every column header is a button. Click a timeframe header to sort by that column, click again to reverse. Click AGREE to sort by agreement, with full agreement first. The active column is drawn in the accent colour with a caret, so the sort state lives on the header itself.
Filtering is a single toggle, "Only active rows", which hides every symbol with no setup and no countdown running. It filters the view and not the calculation: a hidden row is still counted and can still alert.
The legend sits above the table and decodes the notation in one line: which glyph is the buy side, which is the sell side, what the fraction means, what the dot means, and what the AGREE fraction means. It can be switched off once you know it.
Clicking a cell switches this chart to that symbol and that timeframe. It does not open a window per click.
Status tags at the foot of the board say how many symbols are ready of how many, and how long ago the board updated. This board has no pager: the row count is fitted to the height of the chart pane, and when rows do not fit it says how many were dropped rather than hiding them silently. Shorten the set with "Only active rows" or with the symbol list.
Three scheme buttons sit at the top of the board so the colour scheme can be switched without opening anything.
Diagnostics
A second panel, off by default, that answers "why is there no count": symbol coverage, which series are short of bars and by how much, what the last pass counted, how many resets happened and why, and how many symbols this indicator switched on in Market Watch to do its work. It has its own position, its own collapsed state and its own event log.
The chart indicator
Drawn in the price window as chart objects: the counts printed on a chosen number of recent bars, the Setup Barrier support and resistance in force, and the arrows. It can be switched off if you only want the board. Its timeframe is set separately from the timeframes the board scans.
The settings sheet
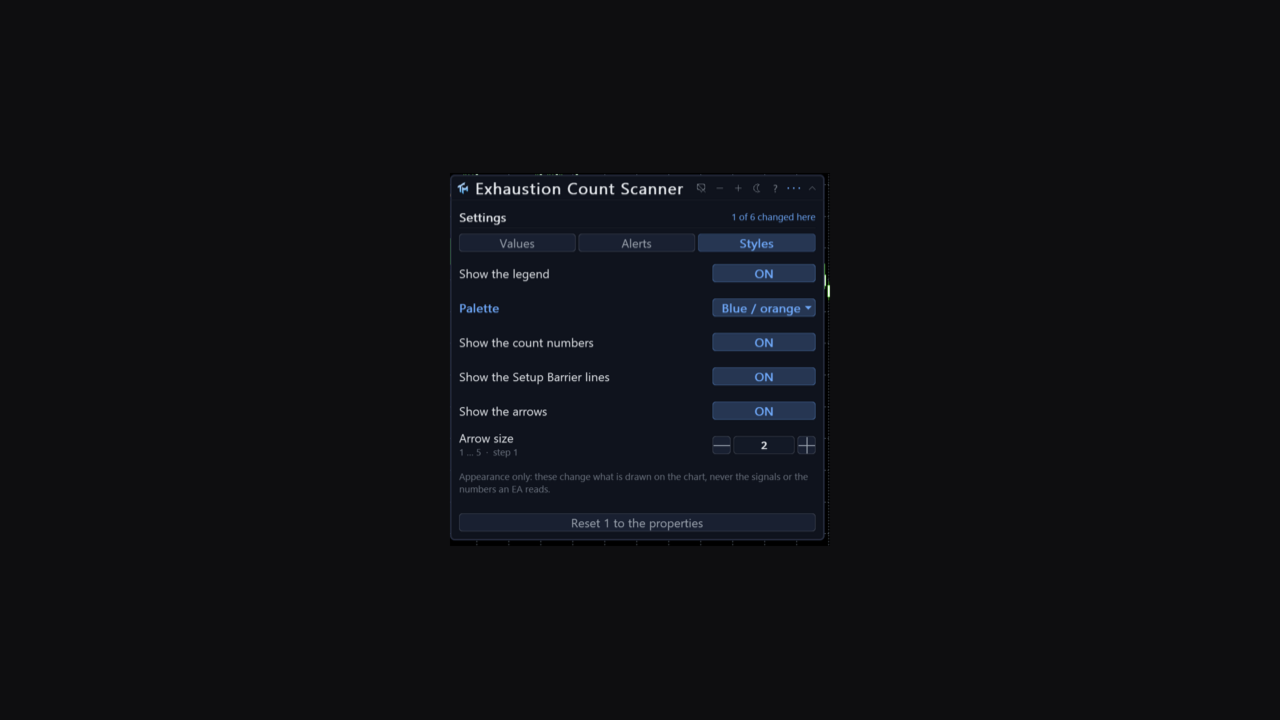
The gear opens a sheet with three tabs. Values holds the timeframe, setup length, setup lookback, countdown length, countdown lookback, require a flip to start, run the countdown at all, aggressive countdown, cancel on a Barrier break and cancel on an opposing setup. Steppers, ranges and a sentence of help on each. Changing one recalculates the whole board.
Alerts holds the master switch, the per-event switches, four channels, the cooldown and a test button. This is where all the alert controls live, and there is no bare alert toggle on the board itself.
Styles holds show the legend, palette, show the Setup Barrier lines, show the arrows and arrow size. These are the same display controls the matching single-chart indicator carries, under the same names, so a chart set up one way can be reproduced on the other.
Three colour schemes are available, including a colour-blind safe one that uses blue and orange and never puts red against green. Panel position, scheme, the sort, the only-active toggle, the diagnostics panel's own placement and every value changed on the sheet are stored per chart and survive a timeframe change and a terminal restart. The interface is English.
Alerts
Off out of the box. Events: a setup completed and a countdown completed, declared separately for each scanned timeframe, plus data health, which speaks when a symbol loses or regains its data. There is a switch to alert on setup completion only when the setup was perfected, and a freshness setting so the board does not announce a completion that happened long ago.
Channels: popup window, sound, push to the mobile terminal, e-mail. Cooldown per symbol and timeframe, thirty minutes by default. Telegram is not part of this product.
Cost
The work is budgeted: a set number of symbols is refreshed per timer tick, lower being gentler on a slow machine, and each cell is given a generous history because the counts need room to build. A watchdog restarts the calculation if a pass has not completed for too long.
Reading it from an EA
This product draws on the chart with graphical objects rather than plot buffers, so there are no count buffers to read here. Two buffers are published: buffer 0, Health, carries the watchdog's health value for this instance, and buffer 1, Changed, is a change flag written on the newest bar.
If you want the counts in an EA, use the single-chart Exhaustion Count MTF product, which publishes the full buffer map with Buy at buffer 0 and Sell at buffer 1.
Honest limits
The count on a forming bar changes inside the bar, so no cell and no chart label is ever drawn from one. Everything the board shows comes from closed bars: a value published on a closed bar does not change afterwards, and a nine appears only once the bar making it has finished.
A nine or a thirteen is a statement about exhaustion, not an entry. Price can complete a countdown and keep going.
The cancellation and recycling rules change the answer materially, and two people running the board with different switches will see different thirteens. Both readings are legitimate, and there is no single correct configuration.
AGREE counts timeframes, it does not estimate probability, and eight timeframes on one instrument are eight correlated readings rather than eight independent ones.
There is no pager on this board. When the rows do not fit the chart pane the surplus is dropped, and the board says how many, rather than pretending they are not there.
The counts need a lot of history per cell. A symbol your broker carries thinly cannot be counted, and the board says which and why.
No profit figure, win rate or backtest result is claimed here.