Fabii Yang Zhang Volatility Filter

  • 指标
  • Fabien Georges Andre Guillemaud
    Fabien Georges Andre Guillemaud
    我开发适用于 MetaTrader 5 的定制指标和交易工具。
    我本人也是一名交易员。多年来,我一直在构建和完善自己的系统化交易方法——从零开始设计指标、测试各种组合、优化风险管理参数,并在真实市场环境中调试代码。正是这些实践经验,让我能够在您还没解释完需求之前,就理解您真正需要什么。
    我提供:
    定制指标——震荡指标、叠加指标、多时间周期版本
    MT4 转 MT5
    仪表盘和面板指标
    基于 ATR 的工具——移动止损、仓位计算、风险管理
    面向系统化交易者的完整指标套件
  • 版本: 1.0
  • 激活: 20
Know at a glance whether the market is moving enough to justify a trade. No repaint.
Any pair, any timeframe, any market. Try it free in the Strategy Tester.

▬▬▬ THE PROBLEM ▬▬▬
Most losing trades are not wrong calls. They are good setups taken in a dead market.
Price drifts sideways, your stop gets clipped by noise, and the move you wanted never
comes. The hard part is not the signal. It is knowing when the market has enough
movement to be worth the risk in the first place.

▬▬▬ WHY YANG-ZHANG ▬▬▬
Most volatility tools measure only part of the picture. A plain moving average or a
close-to-close standard deviation looks at closing prices alone, so it ignores the
gap between one bar's close and the next bar's open, and it ignores how far price
travelled inside the bar. ATR captures the bar range but treats every bar the same
and does not separate overnight gaps from intraday movement.
The Yang-Zhang estimator uses the full open, high, low and close of every bar. It
combines three parts: the overnight gap, the open-to-close move, and the intrabar
range (the Rogers-Satchell term). Because it accounts for gaps and for drift at the
same time, it is one of the most efficient volatility estimators available, meaning
it gives a steadier, more accurate read from the same number of bars. In practice
that means fewer false "market is quiet" or "market is active" flips than a
close-only measure, and a reading you can trust on instruments that gap.

▬▬▬ HOW IT WORKS ▬▬▬
This indicator plots two Yang-Zhang volatility lines in a sub-window: a fast line that
reacts to the current bar, and a slow reference line that represents the recent normal.
The fast line turns green when volatility is at or above its reference (enough movement
to trade) and grey when it drops below (too quiet, stand aside). One colour, one
decision. The reading is self-scaling, so it works the same on a calm pair and a wild
one, with nothing to tune per symbol.

▬▬▬ KEY FEATURES ▬▬▬
- Two Yang-Zhang volatility lines: fast intensity and slow reference.
- Full OHLC estimator: accounts for gaps and intrabar range, not just closes.
- Self-scaling: no threshold to set per symbol or timeframe.
- Green means sufficient volatility, grey means insufficient. One glance.
- Regime-shift alerts on bar close: popup, sound and push, filterable.
- Live-bar value shown as a separate dotted line, never mixed with confirmed data.
- No repaint. Signals are final on bar close.
- Any pair, any timeframe, any market.
- Buffers exposed for use in your own Expert Advisor via iCustom.

▬▬▬ INPUTS ▬▬▬

| Parameter    | Description                                    | Default    |
|----------------|----------------------------------------------------------------|----------------|
| Fast            | Fast Yang-Zhang window (raw intensity)                  | 3                 |
| Slow           | Slow Yang-Zhang window (reference level)              | 21               |
| Color Hi      | Fast line when sufficient (at/above reference)        | Lime Green |
| Color Lo      | Fast line when insufficient (below reference)          | Gray           |
| Color Slow   | Slow reference line                                                | Dim Gray    |
| Alert Mode   | Both / To Sufficient / To Insufficient                      | Both            |
| Alert Popup  | Popup alert on colour shift                                    | false           |
| Alert Sound  | Sound alert on colour shift                                    | false           |
| Alert Push   | Push notification on colour shift                             | false           |
| Max Bars     | Recent bars to compute                                         | 500             |

▬▬▬ HOW TO USE IT ▬▬▬
1. Attach it to any chart. It sits in its own sub-window.
2. Watch the fast line colour. Green means the market is active enough to trade.
3. Grey means volatility is below its recent normal. Skip or wait.
4. Combine it with your own entry method: take your signals only while the line is green.
5. Turn on alerts to be notified the moment volatility becomes sufficient again.

▬▬▬ PART OF THE FABII SUITE ▬▬▬
Follow my profile for updates and new tools built on the same clean, no-repaint approach.

▬▬▬ SUPPORT ▬▬▬
Questions? Message me — I answer within 24h.

▬▬▬ GET IT ▬▬▬
Launch price is $30 and rises to $49 after the first 20 sales.
Attach it to a chart, watch the line turn green, and take your next signal only when the
market is actually moving. Try it free in the Strategy Tester, and if it earns a place on
your charts, a short review helps other traders find it. Follow my profile.
(For educational use. Trading involves risk; you are responsible for your own decisions.)
推荐产品
Aegis XAU Extreme Edition Overview Aegis XAU Extreme Edition is a trend-following Expert Advisor designed exclusively for XAUUSD M1 . Rather than trading throughout the entire day, it focuses only on carefully selected trading sessions identified through extensive historical testing. By avoiding statistically unfavorable hours, the EA aims to improve overall trading efficiency while maintaining consistent long-term performance. The strategy combines: EMA Trend Filter EMA Pullback Entry ADX Tr
Seven Target
Suleiman Alhawamdah
5 (1)
Seven Target   – 一款专业的分析型指标,包含两套系统和两种目标确定方式。 第一目标系统: 本系统基于对所有类型“旗形”或“三角旗形”形态的分析,涵盖其各种形态方向及可能的绘制概率。并据此从这些看涨或看跌形态中提取和推导出专业的斐波那契水平。 我们拥有一个专业的浮动分析仪表盘,其中包含8个专业的信息分析系统,旨在通过智能方法分析图表,确定形态目标的准确性,并对其进行持续监控。因此,我们将拥有活跃的“旗形”或“三角旗形”形态目标,以及其他可能变为失效的目标——所有这些目标在其活跃状态和失效状态下都受到控制和具有利用价值。我们还将拥有专业的斐波那契水平。如果50%水平得到确认——且具备绝对确定性——则该水平将对交易产生强烈影响,并可被充分利用,以轻松有效地判断价格反转方向,以及在上下50%水平之间获取利润。 监控浮动分析仪表盘对于理解总体趋势非常重要,其中包括7-MA移动平均线系统,该系统使用了7条专业且智能的均线。因此,建议始终关注浮动仪表盘。 当价格到达第一系统(即“旗形”或“三角旗形”形态系统)的预期目标区域时,投影线将变为绿色,表示目标已被触及,无论是在图表绘制上
Confluence is an advanced multi-factor technical analysis indicator for MetaTrader 5 that brings together several important market-structure and price-action tools in one customizable solution. The indicator is designed to help traders analyze market imbalances, liquidity, support and resistance, trend structure, volume, momentum, and price action from a single chart. Key Features Fair Value Gap (FVG) Detection Automatic or manual FVG size detection Bullish and bearish FVG zones FVG size and sta
VPro Risk Tool
Aleksei Saprykin
VPro Risk Tool 是一款适用于 MetaTrader 5 的风险规划、仓位规模与交易手数计算工具。 设置风险、Entry(入场价)和 Stop Loss(止损价)后,工具会根据所选风险计算方式、账户数据、当前交易品种规格以及经纪商限制,计算风险金额和最终交易手数。 工具可用于规划 Market Entry(市价入场)和 Pending Order(挂单)交易方案。当 Trade Side 设置为 Auto 时,工具会根据 Entry 与 Stop Loss 的位置自动识别 BUY / SELL。可选的 Take Profit(止盈)线可以显示 R:R(风险回报比)。 VPro Risk Tool 不会开仓、发送订单、提供交易信号或预测交易结果。它是一款手动风险规划工具。每笔订单均由交易者自行决定并提交。 使用流程 1. 在 Risk Basis 中选择 Balance %、Equity % 或 Fixed Money,并设置 Risk Value。 2. 选择 Market Entry 或 Pending Order。移动 Stop Loss 线;在挂单模式下还需移动 E
Exhaustion Count Scanner 是同一个文件里的两个产品。第一个是 Exhaustion Count MTF 本身,画在你眼前的这张图上:逐根打印的 setup 与倒数计数数字、当前有效的 Setup Barrier 价位,以及完成信号上的箭头。第二个是一块看板,把同样的计数同时跑在一份品种清单上,最多可用八个时间框架。 在任何单一品种上,九或十三都是罕见事件,而这正是看板存在的理由。表格在整个观察清单里把它们找出来,下面的图表则把产生它的那段计数直接摆给你看,不必再挂第二个指标。 本文件中的计数模块是单图产品中那一份的逐字副本。计数与同一张图上的指标对不上的扫描器,没有人会信第二次;而让两个文件保持一致的唯一可靠办法,就是让有意思的那部分只存在一份。 看板 每个品种一行,每个被扫描的时间框架一列,最多八个时间框架、二十八个品种。品种清单用逗号分隔,或者看板改用市场报价窗口的清单。经纪商前缀与后缀从你所在的图表识别,也可以手工填写。出厂时看板扫描四个:M15、H1、H4 与 D1。 一个单元格读作 B7/9:方向、已达到的计数,以及它正在走向的计数。后面的一个点表示这
SuperTrend Visualizer – The Ultimate Trend-Following System For MT4 version :  https://www.mql5.com/en/market/product/158694 Stop guessing the market direction. SuperTrend Visualizer transforms your MetaTrader 5 chart into a clear, color-coded trading system. Unlike standard indicators that only draw a line, this tool automatically colors your candles based on the trend, helping you spot entries and exits instantly. Why SuperTrend Visualizer? Standard charts can be messy. This indicator uses
FutureProfile
Gennady Sergienko
Idea The idea is — it seems to me that exactly at 10:00 EURUSD always goes up. How can this be verified? This indicator analyzes historical data at the   same hour of the day   over the past N days and shows: ProbUp   — the probability that after a given number of bars ( HorizonBars ) the price will be higher; ZEdge   — the “strength” of the signal = average move / dispersion. This allows you to understand: “In 70% of cases, after 3 bars during this hour the market moved up.” “The signal is
FREE
MFI Speed MT5 r
DMITRII GRIDASOV
适用于 MT5 的 Crypto_Forex 指标“MFI 速度”,无需重绘。 - 该指标基于物理方程计算。MFI 速度是 MFI 本身的一阶导数。 - Money_Flow_Index (MFI) 是一个技术振荡指标,它利用价格和成交量数据来识别超卖和超买区域。 - MFI 速度非常适合利用动量入场点进行剥头皮操作,使其顺应主趋势方向。 - 建议结合合适的趋势指标使用,例如标准 EMA(如图所示)。 - MFI 速度指标显示 MFI 本身改变方向的速度,非常灵敏。 - 如果 MFI 速度指标的值小于 0:速度为负;如果 MFI 速度指标的值大于 0:速度为正。 - 指标内置移动端和 PC 端警报。 点击这里查看高质量的交易机器人和指标! 这是仅在 MQL5 网站上提供的原创产品。
ADR Day Range MT5 是一款适用于 MetaTrader 5 的图表指标,它以清晰的格式显示 Average Daily Range 信息。它帮助交易者直接在图表上评估当前日内波幅以及到计算出的 ADR 水平的剩余距离。 1. 指标显示的内容 该指标显示 ADR(N),它表示基于之前已完成日线蜡烛计算的平均日波幅。它还显示 Today,表示当前交易日从 High 到 Low 的区间,以点数显示。Room Up 显示从当前价格到 ADR 的剩余上行距离,而 Room Down 显示从当前价格到 ADR 的剩余下行距离。 2. ADR 状态和图表显示 当当前日内波幅仍低于计算出的 ADR 值时,ADR 状态显示为 ADR NOT REACHED。当当前日内波幅达到或超过 ADR 值时,状态会变为 ADR REACHED。状态会通过颜色提示显示,以便更容易进行视觉识别。 ADR Day Range MT5 直接在图表上运行,不使用单独的指标窗口。该指标以点数显示数值,并根据当前价格和当前日内波幅实时更新 Room Up 和 Room Down。位置、颜色和字体大小可以在输入设置
Ultimate Candle Patterns
Wojciech Daniel Knoff
This is a multi-symbol, multi-timeframe, table-based indicator for MetaTrader 5 that identifies 46 types of candlestick formations. Each formation has its own image for easier recognition. The indicator includes popular patterns such as Engulfing, Hammer, Three Line Strike, Piercing, and Doji-like candles. You can check the full list of patterns in the screenshots below. Also you can not only switch all bearish or bullish patterns from input, but also select formation for a specified symbols and
Synchronize symbol changes across multiple charts instantly and effortlessly. Overview Chart Symbol Synchronizer is a professional tool for traders who work with multiple charts simultaneously. Change the symbol on your master chart, and watch all your follower charts update automatically in real-time. Perfect for multi-pair analysis, correlation trading, and efficient workspace management. Key Features Instant Synchronization - Updates all linked charts within 200ms Multiple Independent Gro
Category: Utilities → Trade Panels Version: 1.2 (auto-sizing buttons + adjustable font size) ClickCloserExpress is a super-lightweight panel for MetaTrader 5 that lets you close positions instantly by profit/loss, symbol, side (Buy/Sell), and magic number— without opening new trades or cluttering your chart. Perfect for manual/semi-auto management, scalping, and fast portfolio clean-ups. What it does One-click closing of: All positions. Profitable only or losing only . Symbol on chart o
Mega Spikes Max
Niccyril Chirindo
2.33 (3)
Mega Spikes Max is a specialized indicator for Boom and Crash synthetic indices that generates trading signals with automatic alert notifications. Features The indicator analyzes market conditions using proprietary algorithms and displays buy/sell arrows directly on the chart. It works specifically with Boom and Crash indices on M5 timeframe. Signal generation combines multiple technical analysis methods to identify potential trading opportunities. The system provides two TP levels and SL calcu
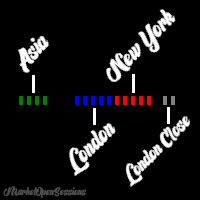
MarketOpenSessions is an indicator helps as a visual clue for which market session is at the time being. If you consider killzone, market open/close as important factor, this indicator would help you reduce effort in converting from one time zone to another. It has the following features 2 display styles: section (as colored line), and histogram 4 major configurable market sessions i.e. Asia, London, New York, and London-Close session. In additional to end of trading session of the day. Female s
自适应图表垂直缩放 忘记频繁手动调整图表! 市场在变化 —— 图表也应该自动适应。 ScaleFix Smart Auto Scaling 是一款适用于 MetaTrader 5 的智能工具,可自动将价格保持在舒适的可视区域内: • 上方极值 —— 距离顶部边缘约 ~10%; • 下方极值 —— 距离底部边缘约 ~10%。 无论市场波动如何,您的图表始终保持整洁、专业且易于阅读。 为什么交易者选择 ScaleFix Smart Auto Scaling 节省注意力 在高强度交易过程中,每一秒专注都非常重要。 无需再在每次价格波动后手动调整图表缩放。 更舒适的分析体验 价格不再“贴”在图表边缘。 您可以更清晰地观察市场结构、动能、区域与形态。 特别适用于: 剥头皮交易 日内交易 Price Action 分析 支撑阻力位交易 多时间周期分析 专业级图表外观 您的交易终端将显得整洁且专业 —— 如同专业交易员和 Prop 团队所使用的界面。 工具功能 自动进行图表垂直缩放 保持上下最佳边距 实时运行 无需手动调整缩放(开启一次即可长期使用) 帮助您将全部注意力集中在市场本身 技术特点 安
Trade Assistant For MT5
Abdelkhabir Yassine Alaoui
MT5交易助手 机构级交易管理面板,精准掌控交易 使用MT5交易助手,全面掌控您的交易——这是一款专业级的执行和管理面板,专为追求速度、精准度和严格风险控制的交易者而设计。 该工具兼顾性能和易用性,可将您的MetaTrader 5图表转化为完整的交易工作站,让您自信地执行、管理和保护交易。 交易者选择此工具的理由 大多数交易者亏损并非因为策略,而是因为执行不力以及风险管理不善。 交易助手解决了这个问题。 无需手动计算手数 告别缓慢的下单速度 避免情绪化操作 消除风险控制不稳定性 一切操作自动化、可视化且精准。 核心功能 智能交易执行面板 一键买入/卖出 自动设置止损和止盈 支持市价单 + 挂单(限价/止损) 内置价格验证系统,防止错误入场 高级风险管理引擎 基于风险的交易手数计算: % 余额 %​​ 净值 % 可用保证金 固定美元 实时风险(美元)计算 根据止损距离自动调整交易手数 像专业人士一样交易——风险始终保持一致。 可视化交易(拖拽控制) 完全交互式价格线: 入场点
ForexSession
Jia Jia Chen
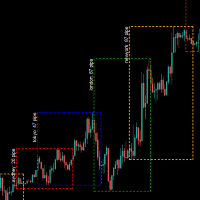
外汇市场时间指标,包含 悉尼,东京,伦敦,纽约 4个市场时间  考虑了服务器夏令时切换,以及各市场的夏令时切换 input ENUM_DST_ZONE  InpServerDSTChangeRule    = DST_ZONE_US; //服务器端夏令时切换规则 按照纽约还是欧洲 input int InpBackDays=100;  // 最多绘制天数,出于性能考虑 input bool InpShowTextLabel=true; // 显示文本标签 哪个市场,当前波动点数 input color InpTextColor=clrWhite;  // 标签文本颜色 input int InpTextFontSize=8;  //标签文本字号 input bool InpFillBack=false;   //方框背景色是否填充 input bool InpShowStat=false;  // 显示各市场时间波动统计信息 input ENUM_LINE_STYLE InpLineStyle=STYLE_DOT;  // 方框线样式 input bool InpShowWeekda
AskSpread line
Ian Worthington
It is super imporant to know what the spread is on your charts! This indicator displays the Ask High of the past bars, similar to that of the backtester. This allows you to see the spread of bars in real time. The spread of the bar is the ask-bid price. The spread of a bar is the minimum spread of any ticks found within that bar. I hope this makes sense. If you have any questions or feedback, let me know - thank you. 
This tool will help you calculate position size based on the lines that you draw on the chart. It will automatically create the trading setup in the background and provide adaptive buttons for market and pending order confirmation. The design is very simple and straightforward, with just a single click you will be able to place the trading setup. Features Set your risk based on your predefined amount or percent of your account balance. Drag the lines to define the entry, take profit target and s
NEXA Trend Ride PRO — 用户手册 1. 概述 NEXA Trend Ride PRO 是一款用于 MetaTrader 5 平台的自动交易程序(Expert Advisor)。 该程序通过分析价格走势和技术指标来评估市场条件,并在满足预设条件时自动执行交易操作。 用户可以通过输入参数对交易逻辑和风险管理进行设置和调整。 本产品以 EX5 编译文件形式提供,用于 MetaTrader 5 交易平台。 2. 主要功能 NEXA Trend Ride PRO 提供以下功能: 自动执行买入和卖出交易 市场趋势条件分析 基于波动率的入场条件 交易时间过滤功能 点差检测功能 持仓管理 自动止损与止盈设置 部分平仓功能 风险控制参数设置 这些功能结合使用,用于判断市场是否满足交易条件。 3. 工作原理 在执行交易之前,程序会按照以下步骤进行检查: 检查允许的交易时间 检查当前点差条件 分析市场趋势强度 分析市场波动率 当入场条件满足时执行交易 对持仓进行管理直到满足退出条件 该 Expert Advisor 根据所附加图表的交易品种和时间周期运行。 4. 安装方法 安装 Expe
OB FVG Trade Copier: Unified Master & Slave EA Version: 2.00 Type: Trade Copier / Risk Management Utility Compatibility: MetaTrader 4 & MetaTrader 5 (Cross-compatible codebase) Overview The OB FVG Trade Copier is a professional-grade, unified trade copying system designed to mirror trades between Master and Slave accounts seamlessly. Built with a unified architecture, a single EA file serves as both the sender (Master) and receiver (Slave) simply by toggling the EA Mode in the settings. It uti
FREE
Gold Venamax MT5
Sergei Linskii
3.5 (2)
Gold Venamax - 這是最好的股票技術指標。 此指標演算法分析資產的價格變動並反映波動性和潛在的進入區域。 指標特點: 這是一個帶有 Magic 和兩個趨勢箭頭塊的超級指標,可實現舒適且有利可圖的交易。 圖表上顯示用於切換方塊的紅色按鈕。 Magic 在指標設定中進行設置,以便您可以將指標安裝在顯示不同區塊的兩個圖表上。 Gold Venamax 可以放置在具有不同箭頭緩衝區(GV 和 SD)的兩個圖表上。 為此,您需要在設定中選擇不同的 Magic,例如,一個具有 Magic = 999,另一個具有 Magic = 666。接下來,您可以使用圖表上的紅色按鈕選擇箭頭緩衝區。 指標設定中的每個箭頭緩衝區(GV и SD)都有一個單獨的箭頭過濾器,以實現舒適且有利可圖的交易(UseFiltrGV = true; 和 UseFiltrSD = true;)。 進入的最佳訊號 = 遵循兩個緩衝區的訊號箭頭(GV 和 SD)+ 所有三個 MA 線(紅色或藍色)的方向 + TMA 通道邊界(下或上)。 TMA 通道邊界(下限或上限)也可用於鎖定利潤和/或以較短的停損位進行逆勢風險交
Aussenstab Markttechnik
Alexander Josef Zeidler
This indicator shows external bars ("Aussenstäbe") in the chart in candle form. The colors of the candles can be set individually. Also different colors for bearish and bullish bars are possible. In addition, the color of the wicks or outlines is also adjustable. Outside bars are mentioned e.g. by Michael Voigt in the book "Das große Buch der Markttechnik". All other candles are inner bars.
Price Alerts Advanced Suite for MetaTrader 5 Take control of your trading execution with the Price Alerts Advanced Suite , a professional-grade technical analysis tool built exclusively for MetaTrader 5. This suite goes far beyond simple horizontal lines; it is a complete analytical ecosystem designed to identify key market levels, monitor price action in real-time, and deliver instant notifications across multiple channels. Whether you are a day trader, swing trader, or algorithmic develope
交易时段面板 (Trading Sessions Panel) 无需再费力推算当前处于哪个交易时段。该面板在图表角落显示一个实时 24 小时时钟,让您一眼就能看出当前哪些时段处于开启状态,以及各时段的起止时间。 功能概览 • 简洁的 24 小时时钟,可固定在图表的任意角落(上/下、左/右)。 • 五个时段行,每行包含一个标识点和名称。时段开启时,标识点为实心彩色;时段关闭时,则为空心灰色。 • 可选的垂直线,标记各时段的开盘与收盘时刻;线条颜色、样式和宽度均可自定义。 • 可选的旋转标签,显示在每条垂直线上方,明确标示该线所属的交易时段。 交易者青睐的理由 • 无需离开图表即可掌握时段信息,无需切换窗口或访问外部网站。 • 瞬间识别伦敦与纽约市场的重叠时段——这是市场波动最剧烈的时刻。 • 超短线交易者(Scalpers)可在 M1 和 M5 图表上获取精确的开盘与收盘标记;波段交易者(Swing traders)也可在 H1 图表上获得同样的视图。 • 周末与节假日安全:线条仅在实际交易时段绘制,避免了周五收盘时线条堆积的问题。 • 占用资源少:基于定时器刷新,而非随每个
TransitBlueOcean
TRANSITBK98
5 (1)
TransitBlueOcean is indicator system that uses ocean wave's pattern, to help one to know when to buy and when to sell. The indicator system is very powerful like the ocean waves. Join the mql5 channel for TransitBlueOcean  https://www.mql5.com/en/channels/transitblueocean   How to use: Zoom in so that the Ocean will appear on your chart. Buy when you see the candles, the candle will be above the ocean wave (buying signal). Sell when you can't see the candles, the candles will be inside the wav
Market Ticker Pro MT5
John Louis Fernando Diamante
The only Market Ticker on the market! Add a professional novelty to your workspace, with built in mini-charts A scrolling Market Ticker that displays price changes from all symbols in the Market Watch list. Provides an easy snapshot of symbol prices, and keeps scrolling automatically while you trade and analyse the chart. The ticker color (+/- price changes) are based on either the current or completed candle, and the previous candle. Options include: - MTF, eg choose to show price changes of t
MT5 Supertrend Pure
Dae Shik Kim
4.83 (6)
Supertrend Pure MT5 - 高精度趋势跟踪指标 您的评价、评论和评分对我改进程序来说是莫大的鼓励。谢谢! [产品描述] Supertrend Pure 是一款简洁高效、专注于交易本质的趋势指标。它摒弃了复杂的设置,并采用数学优化的平均真实波幅 ​​(ATR) 计算方法,有效去除市场噪音,精准捕捉真实趋势。 主要功能: 纯净算法:提供可靠信号,绝不重绘。 智能可视化:上升趋势采用水蓝色,下降趋势采用番茄色,方便用户即时查看。 多用途:适用于所有时间周期,从超短线交易到日内交易和波段交易均可胜任。 轻量级:优化的代码确保即使在多个图表上运行也不会造成终端卡顿。 [配置方法/参数] ATR 周期:设置波动率的计算周期(默认值:10)。倍数:调整趋势敏感度(默认值:3.0)。 警报设置:设置各种警报的开启/关闭状态。 [使用技巧/交易策略] 趋势确认:仅当趋势线位于K线下方且呈天蓝色时才考虑买入。 止损线:您可以将超级趋势线本身用作动态追踪止损,从而最大化利润。 组合过滤器:将此指标与成交量指标或移动平均线结合使用,可以更有效地过滤掉虚假突破。
FREE
TideMarks — Session Highs & Lows (NY, London, Tokyo) TideMarks is a professional session tracking indicator for MetaTrader 5. Like the tide leaving its mark on the shore, TideMarks draws the exact high and low reached during each major trading session — giving you clean, reliable reference levels directly on your chart. Built-in sessions: Tokyo (00:00–09:00 UTC), London (08:00–16:30 UTC) and New York (13:30–20:00 UTC) are pre-configured with precise open and close times down to the minute. All t
Broker and Session Clock
Robert James Jr Garciano Gregory
Broker and Session Clock Stay synchronized with the global financial markets using the Broker & Session Clock MT5 indicator. This lightweight and easy-to-use tool displays real-time market clocks directly on your chart, helping traders monitor key trading sessions and broker server time without switching between platforms or websites. Designed for scalpers, day traders, swing traders, and algorithmic traders, the indicator provides an instant view of major market sessions, allowing you to ident
该产品的买家也购买
Trend Sniper X
Sarvarbek Abduvoxobov
4.9 (40)
Trend Sniper X 是一款适用于 MetaTrader 5 的多周期趋势跟踪指标,可帮助交易者清晰精准地识别趋势方向和潜在的反转点。 适用于 MT4: https://www.mql5.com/en/market/product/193245 价格信息: 当前价格为促销价,随着后续更新和新功能的推出,价格可能会有所变动。 赠品优惠: 购买后联系作者,即可免费获取该指标的 Auto-Trade Assistant EA(自动交易助手 EA)。 Code2Profit 频道 通过多时间框架分析掌控市场! 如何使用 Trend Sniper X 最大化您的胜率:核心规则与交易时段技巧 技术规格 平台 MetaTrader 5 指标类型 多时间周期趋势指标 运行时间周期 任何图表时间周期,可独立选择更高的时间周期 (M1–MN1) 主要交易品种 外汇、黄金 (XAUUSD) 及其他差价合约 (CFD) 推荐账户 任何账户类型 可视化 彩色趋势蜡烛 (买入/卖出/微弱/变化) + 买入/卖出箭头 附加模块 交易时段方框 (悉尼、东京、伦敦、纽约) 主要功能 多时间周期趋势分析: 直接在
Smart Trend Trading System — MetaTrader 5 购买后,请在 MQL5 上给我发消息,即可免费获得 Smart Universal Expert Advisor,以及在线课程、PDF 手册和私人群组访问权限。 STTS 将趋势方向、入场和出场信号、反转区域及重要价格水平集中呈现在图表上。您可以根据系统手动交易,也可以连接单独的兼容 EA,按照您选择的设置自动执行交易。 一套系统,四种交易思路 STTS 将交易方法分为四大类: • 剥头皮交易 — 跟踪短期信号和市场波动。 • 趋势交易 — 评估方向,寻找趋势中的交易机会。 • 反转交易 — 识别潜在的转折区域和方向变化。 • 成交量交易 — 利用成交量相关信息评估市场活跃程度。 入场和出场箭头、趋势信息、支撑与阻力位及反转区域,帮助您直接在图表上分析交易形态。 先从一种方法开始。了解其信号和设置后,再探索其他方法。 从信号到自动化 Smart Universal Expert Advisor 可连接 STTS,让您自动执行受支持的交易信号。 启用自动交易前,请配置指标连接、仓位大小和交易管理设置
Zoryk Gold
Reda El Koutbane
5 (15)
折扣将在 24 小时后结束——下一价格为 69 美元 ZORYK — MetaTrader 5 专用高级 XAUUSD 黄金信号系统 你一定熟悉这种感觉。 你花了很多时间分析黄金,等待合适的入场机会。终于开仓后,价格却立刻朝相反方向移动。你过早平仓、移动止损,或者只犹豫了几秒钟。随后,市场却在没有你的情况下到达了你原本预期的目标。 问题并不总是方向判断错误。 真正的问题是缺乏确定性。 你不知道准确的入场位置在哪里。 你不知道什么时候交易逻辑已经失效。 你不知道应该先锁定较近的利润,还是继续等待更大的行情。 你也不知道当前信号是否足够强,还是自己只是在强行寻找交易机会。 黄金市场变化非常快。一个没有明确计划的好想法,可能在几秒钟内变成错误的交易决定。 ZORYK 正是为了解决这个问题而开发。 什么是 ZORYK ZORYK 是一套完整的 XAUUSD 黄金信号与交易计划系统,专门为 MetaTrader 5  和 M5 时间周期 开发。 它不是一个只显示 BUY 或 SELL 箭头,然后让你独自决定其余所有内容的简单指标。 每个确认后的信号都可以在图表上显示完整的可视化交易计划,包
SuperScalp Pro
Van Minh Nguyen
4.66 (35)
SuperScalp Pro - Professional Multi-Layer Confluence Scalping System SuperScalp Pro 是一款高级剥头皮交易指标,在经典 Supertrend 的基础上加入了多个智能确认过滤器。它可以帮助您识别概率更高的 Buy/Sell 交易机会,同时显著减少虚假信号。 清晰的 Buy 和 Sell 箭头会直接显示在图表上,基于 ATR 的 Stop Loss 和 Take Profit 水平会实时自动计算。 购买后,请联系我获取设置指导和推荐配置。 使用 SuperScalp Pro Auto Trader 轻松实现信号自动化: [Auto Trader] 下载推荐设置文件: [Set File] 完整文档请参阅产品博客: [User Guide] 加入官方频道获取最新更新: [Official Channel] SuperScalp Pro 如何工作? 只有当多个确认层同时一致时,指标才会生成交易信号(趋势 + 动能 + 成交量 + 波动率)。 您可以手动交易,也可以连接 SuperScalp Pro Auto Tr
SMC Intraday Formula
VividMind Digital Solutions
5 (26)
让我们先坦诚一点。 没有任何一个指标可以单独让你实现盈利。如果有人告诉你可以,那他是在向你兜售一个梦想。任何显示完美买卖箭头的指标都可以被做得看起来毫无瑕疵——只需要放大历史中的某一段并截取成功交易的截图。我们不会这样做。 SMC Intraday Formula 是一个工具。 它为你读取市场结构,标记出概率最高的价格区域,并用简单直白的语言准确告诉你当前智能资金的行为轨迹。你仍然需要做决定。你仍然需要执行交易。但现在,你是带着精确性执行,而不是靠希望。 我们已经在黄金(XAUUSD)以及主要外汇货币对的日内剥头皮交易中使用该指标将近三年。这是我们在 M1、M5、M15 和 M30 上的日常主力工具。它之所以有效,是因为它不试图预测未来——它展示的是当前正在形成的高概率交易机会,并解释 为什么 。 它与其他所有指标有什么不同? 大多数交易指标只做一件事。移动平均线交叉。振荡指标触及某个水平。出现一个箭头。你进场交易。你亏损。你责怪指标。重复。 SMC Intraday Formula 将多个机构级概念整合为一个统一的市场解读: - 斐波那契共振引擎 不只是普通的斐波那契水平——该指标
Gann Made Easy MT5
Oleg Rodin
5 (10)
Gann Made Easy   是一个专业且易于使用的外汇交易系统,它基于使用先生理论的最佳交易原则。 W.D.江恩。该指标提供准确的买入和卖出信号,包括止损和获利水平。您甚至可以使用推送通知在旅途中进行交易。 购买后请联系我,即可免费获得交易指导和超棒的额外指标! 您可能已经多次听说过江恩交易方法。通常 Gann 的理论不仅对于新手交易者而且对于那些已经有一定交易经验的人来说都是非常复杂的东西。这是因为江恩的交易方法在理论上并不那么容易应用。我花了几年时间来完善这些知识,并将最好的原则应用到我的外汇指标中。 该指标非常易于应用。您所需要的只是将其附加到您的图表并遵循简单的交易建议。该指标不断进行市场分析工作并寻找交易机会。当它检测到一个好的入口点时,它会为您提供一个箭头信号。该指标还显示止损和获利水平。 换句话说,当您像先生一样进行交易时,该指标会为您提供最佳江恩建议。江恩亲自告诉你此时此刻该做什么。但最好的部分是您不需要了解任何有关江恩交易原则的知识,因为该指标会为您完成整个市场分析工作。
全新王者降临 - 指标 + 订单管理提示(TP1 + TP2 + TP3)+ 可选 Telegram 信号发送器 INCLUDED(免费) (完整交易与信号系统) 我们最强的黄金 EA: Gold Slayer 该指标包含先进的交易策略、可自定义订单管理系统,以及结合 Envelope 扩展的均值回归系统,并通过 RSI 等多重智能确认过滤器进行验证,以捕捉高概率反转入场机会,提供 BUY 与 SELL 信号。 你不仅能够学习如何交易,还能学会如何高效管理多个仓位,并利用之前盈利的持仓来覆盖亏损交易。 专为 M5 周期打造并优化,在 BTCUSD 和 XAUUSD 上表现尤为出色,因为这些市场的流动性能够让信号更加干净、可靠。 该指标会自动生成清晰的多头(Long)与空头(Short)信号,同时基于 ATR 自动计算入场位、止损位和止盈位,让风险管理从一开始就融入系统之中。 多 TP 系统设有三个渐进式目标位,你可以在 TP1 锁定部分利润、在 TP2 继续持仓,并在更大的行情中将仓位持有至 TP3,而这正是平均风险回报比真正开始大放异彩的地方。 默认参数开箱即用,已经针对稳定表现进行
GoldenX Entry MT5
VividMind Digital Solutions
5 (16)
GoldenX Entry 是一款用于 MT5 的指标,包含自适应 Smart Entry Trend 算法、信号评分系统、市场状态识别器以及波动率过滤器。每个信号都包含计算得出的入场位、三个止盈位(TP1、TP2、TP3)以及止损位。它基于多个分析层构建,旨在适应不同市场条件,将多层分析系统与内置优化器及统计跟踪系统相结合。该指标基于风险收益比(RR)指标和历史交易行为提供量化分析。 开始使用非常简单——在所选时间周期上运行优化器,然后在图表上开始使用该指标。 核心功能 GoldenX Entry 将信号引擎与内置交易管理及历史统计跟踪整合在同一图表中: - 内置优化器: 优化器可在图表上单击运行。它通过两阶段搜索流程测试200种参数组合——先进行探索,再进行优化——并在完成后自动应用选定配置。结果会按时间周期缓存,因此当返回已优化的周期时,会立即恢复相同设置。 - 黄金品种自动周期识别: 将指标加载到任何 XAUUSD 图表(M1 到月线)。系统会自动识别当前周期并加载对应预设。共包含9个时间周期配置文件,专为黄金在标准周期上优化设计。切换周期时,参数会自动调整。 - 资金参考面
ARIPoint
Temirlan Kdyrkhan
1 (4)
ARIPoint is a powerful trading companion designed to generate high-probability entry signals with dynamic TP/SL/DP levels based on volatility. Built-in performance tracking shows win/loss stats, PP1/PP2 hits, and success rates all updated live. Key Features: Buy/Sell signals with adaptive volatility bands Real-time TP/SL/DP levels based on ATR Built-in MA Filter with optional ATR/StdDev volatility Performance stats panel (Success, Profit/Loss, PP1/PP2) Alerts via popup, sound, push, or email Cu
Auto Optimized SpeedAngle 是一款机构级的动量向量化系统,通过持续的前瞻优化(Walk-Forward Optimization, WFO)彻底消除了曲线拟合(curve-fitting)。该指标没有采用在市场 状态转换时容易失效的静态输入参数,而是利用出样外验证(Out-of-Sample, OOS) dynamically 动态重新校准设置,从而确保显示的 信号代表真正的统计优势,而非历史巧合。 核心机构级架构 前瞻优化引擎(Walk-Forward Optimization Engine): 核心算法持续扫描数千种回溯周期(lookback)与阈值组合,严格将数据划分为样本内(in-sample)和样本外(out-of-sample)。只有当参数配置在未知数据环境中证明具备数学优越性时,系统才会对其进行 adoption。 量化目标函数(Quantitative Objective Functions): 优化引擎不一味追求绝对毛利,而是聚焦于机构级的稳定性指标。用户可针对系统质量数(SQN)、期望值(每笔交易的平均 R 倍数)或净 R 值进行优化,从而优
Neuro Poseidon MT5
Daria Rezueva
4.75 (52)
Neuro Poseidon is a new indicator by Daria Rezueva. It combines precise trading signals with adaptive TP/SL levels - creating best possible trades as a result! Message me and get  Neuro Poseidon Assistant  as a gift to automize your trading process! What makes it stand out? 1. Proven profitability on all assets and timeframes 2. Only confirmed BUY and SELL signals present on the chart 3. Adaptive TP & SL levels generated by the software for each trade 4. Easy to understand - suitable for al
Entry Points Pro for MT5
Yury Orlov
4.52 (151)
传奇回归:Entry Points Pro 10。 这款传奇指标曾 3 年稳居 MQL5 Market 前三,如今全面重启。 数百条热情好评(两个版本合计 589 条),每天有数千名交易者用它交易,演示版下载 31,000+   MT4+MT5  次。 五年来我读过你们的每一条评价——在第 10 版里,我没有给出许诺,而是把答案直接做进了产品。指标作者自 1999 年入市, 珍视诚信、自己的声誉和自己的客户 。 Entry Points Pro 给出的入场信号严格不重绘。 而且这一次不再只是作者的一面之词,而是可验证的事实:确认信号只在 K 线收盘后标出,自动化测试记录到 零重绘 (在 EURUSD、XAUUSD 和 BTCUSD 上共 2,486,568 次不变量检查——0 次违规)。测试方法完全公开——您可以在策略测试器中自行复现。 购买后请务必第一时间给我发私信。 我会发给您 扩展版说明书《交易者圣经》 ——使用本指标交易的完整指南——并告诉您如何免费获得 赠品:市场扫描器 ,它能同时分析多个品种和多个时间周期,并在一个界面上显示 Entry Points Pro 此刻在哪里表现
FiboSniper Pro
Van Minh Nguyen
5 (3)
FiboSniper Pro – Multi-Filter Fibonacci System with Auto SL/TP and Control Panel FiboSniper Pro 是一款技术指标,将动态 Fibonacci Envelopes 与多个确认过滤器相结合,以生成经过筛选的 Buy 和 Sell 信号。Fibonacci 水平基于 Moving Average 和 ATR 计算,然后通过 ADX、EMA、RSI、ATR、Volume、Time 和 Candle 结构进行过滤。该指标直接在图表上显示基于 ATR 自动计算的 Stop Loss 和 Take Profit 水平,并提供交互式控制面板,以便快速调整参数。 购买后,请联系我以获取推荐的设置文件和详细使用说明。 使用 Auto Trader X 自动执行 FiboSniper Pro 信号: [Auto Trader X] 用户指南和设置文件: [Click here] 加入官方频道获取最新更新: [Click here] 专为偏好结构化入场和清晰风险管理的交易者设计,适用于 Gold (XAUUSD)、B
Welcome to ENTRY IN THE ZONE AND SMC MULTI TIMEFRAME  SPECIAL BENEFIT / FOR OUR MQL5 CUSTOMERS FREE ACCESS TO THE NEW TOOL  — COMING SOON — Learn more on our official website  : https://www.fableedge.net Entry In The Zone and SMC Multi Timeframe is a real-time market analysis tool based on Smart Money Concepts (SMC) , designed to analyze market structure, price direction, and key trading zones. It supports both Single-Timeframe and Multi-Timeframe Analysis , providing a clearer view of overall m
Unix Scalper
Issam Kassas
4 (4)
Unix Scalper — MetaTrader 5 购买后,请在 MQL5 上给我发消息,即可免费获得 Smart Universal Expert Advisor,以及在线课程、PDF 手册和私人群组访问权限。 发现交易形态,看清交易计划,选择执行方式。 UNIX Scalper 将市场分析、BUY/SELL/WAIT 决策以及 Entry、Stop Loss、TP1 和 TP2 水平集中在一个清晰的面板中。 看清信号与交易计划 • 明确的决策:BUY、SELL 或 WAIT。 • 明确的价格水平:Entry、Stop Loss、TP1 和 TP2。 • 多时间周期概览:比较面板中各时间周期的信号。 • 辅助分析:趋势、动量、成交量、波动率、支撑与阻力,以及市场质量。 • 灵活的布局:Minimized、Compact、Standard 或 Full。 查看信号,检查价格水平,再判断该交易形态是否符合您的交易规则。 从黄金和比特币开始 建议首先使用的交易品种:XAUUSD 和 BTCUSD。 探索短期剥头皮交易和较高时间周期分析。选择历史K线范围,通过表现曲线查看所选设置
M1 Sniper MT5
Oleg Rodin
5 (7)
M1 SNIPER   是一款易于使用的交易指标系统。它是一个专为 M1 时间框架设计的箭头指标。该指标可以作为独立的系统在 M1 时间框架下进行剥头皮交易,也可以作为您现有交易系统的一部分使用。虽然该交易系统专为 M1 时间框架交易而设计,但它也可以用于其他时间框架。我最初设计此方法是为了交易 XAUUSD 和 BTCUSD。但我发现这种方法在其他市场交易中也同样有用。 指标信号既可以顺势交易,也可以逆势交易。我教授一种特殊的交易技巧,帮助您利用指标信号进行双向交易。该方法基于使用特殊的动态支撑位和阻力位区域。 购买后,您可以立即下载 M1 SNIPER 箭头指标。此外,我还为所有 M1 SNIPER 工具用户免费提供下方屏幕截图所示的 Apollo Dynamic SR 指标!这两个指标的组合可以帮助您更轻松、更准确地利用 M1 时间框架进行交易。 购买后请联系我,免费获取交易提示和奖励指标! 祝您交易成功!
Tokyo mt5 Indicator
Vasiliy Strukov
5 (7)
Tokyo Indicator(东京指标)直观地展示了趋势方向、潜在交易信号及市场状况。 其采用颜色编码的阶梯式趋势线,以蓝色标识看涨阶段,以洋红色标识看跌阶段。配套的方向箭头会在趋势发生变化时,标示出潜在的买入与卖出机会。 内置的综合仪表盘将当前信号、市场倾向、动能、波动率及信号质量整合于同一视图中,方便交易者在观察价格走势的同时评估指标数据,无需在不同面板间切换。 凭借清晰的图表显示和简洁的市场概览,Tokyo Indicator 支持以系统化的方式进行趋势分析与交易确认。 适用于任何时间周期及各类交易品种,尤其适合黄金交易。 购买后请立即联系我,以获取专属赠品!您可以免费获得我们的“强力支撑与趋势扫描”(Strong Support and Trend Scanner)指标,请私信我! 设置说明与使用手册请见此处。 请注意:我不会在 Telegram 上出售我的 EA 或特殊参数设置(set files);我的 EA 仅在 Mql5 平台上提供,而参数设置文件仅在我的博客(此处链接)上发布。请务必警惕诈骗,切勿从他人处购买任何参数设置! 设置 ShowHUD —— 在图表上显示
FX Trend MT5 NG
Daniel Stein
5 (6)
FX Trend NG:新一代多市场趋势智能分析工具 概述 FX Trend NG 是一款专业的多时间周期趋势分析与市场监控工具,帮助您在几秒钟内全面了解市场结构。 无需在多个图表之间来回切换,您可以立即看到哪些品种处于趋势中、哪里动能正在减弱,以及哪些时间周期之间存在强烈共振。 限时发布优惠 – 仅需 $30(6个月) 或 $80 终身授权 即可拥有 FX Trend NG 。 已经是 Stein Investments 客户? -> 发送消息 以获取专属客户群访问权限。 需要帮助或安装指导? -> 请访问 Stein Investments 官方页面 。 1. FX Trend NG 的核心优势 三状态趋势逻辑 —— 不只是 Buy 或 Sell • 大多数指标仅显示两种状态:Buy 或 Sell。 • FX Trend NG 增加第三种状态: Fade 。 • Fade 表示趋势强度正在减弱,在完全反转之前提前发出信号。 这种结构化逻辑让您看到趋势变化过程,而不仅仅是简单方向信号。 多时间周期分析(M1 至 MN1) • 从短线交易到中长线交易全面覆盖。 • 快速识别趋势
Adaptive Price Action Engine 买指标,免费送EA 自适应多时间框架趋势与K线形态智能分析系统 市场环境始终在变化,不同的市场阶段中,并非所有 Price Action 形态都具有相同的参考价值。 Adaptive Price Action Engine 旨在适应不断变化的市场条件,将 趋势结构、多时间框架分析、K线形态与统计优化 整合到一个统一的分析框架中。 两种自适应模式 Dual Alpha Trend Mode(双 Alpha Trend 模式) 自动搜索适合的 Alpha Trend 参数,并结合低周期与高周期市场结构,使指标能够根据近期市场行为动态调整趋势识别。 Candlestick + Alpha Mode(K线 + Alpha 模式) 将 Alpha Trend 市场状态与 22种多空K线形态 相结合。系统不会简单地对所有形态一视同仁,而是对不同的形态组合进行统计评估,并识别在特定市场环境下表现出更强历史统计特征的配置。 主要功能 趋势参数自动优化 多时间框架市场状态分析 22种多头与空头 Price Action K线形态 对数千种可能
Smart Price Action Concepts — MetaTrader 5 购买后,请在 MQL5 上给我发消息,即可免费获得 Smart Universal Expert Advisor,以及在线课程、PDF 手册和私人群组访问权限。 看清结构,识别区域,制定交易计划。 在一张清晰有序的图表中整合Smart Money Concepts(SMC)、ICT风格分析与价格行为分析。识别市场结构、订单块、流动性参考价位和失衡区域,再通过Smart Panel选择要显示的内容。 更有条理地分析市场 • 市场结构:内部与波段结构、HH/HL/LL/LH、BOS与CHoCH、高周期分析及多周期仪表板。 • 关键区域:内部与波段订单块、供需区域、Fair Value Gaps(公允价值缺口),以及溢价、均衡和折价区域。 • 流动性参考:等高点与等低点、强弱波段高低点,以及前一日、前一周和前一月的高低点。 • 斐波那契工具:根据当前或前一个波段自动识别。 • 交易时段:伦敦、纽约、东京、悉尼和法兰克福时段,伦敦与纽约kill zones、蜡烛倒计时,以及受支持事件的提醒。 使用Sm
Power Candles MT5
Daniel Stein
4.58 (12)
Power Candles V3 - 自我优化的强度指标 Power Candles V3 把货币与品种的强度直接转化为图表上可执行的交易方案。指标不再仅根据强度给K线着色,而是在后台持续运行实时自动优化,为您正面对的品种给出最佳 Stop Loss、Take Profit 与信号阈值。一键采用,Entry、Stop Loss、Take Profit 线就以精确价格绘制在图表上,提醒消息中直接包含方向。 本工具是 Stein Investments 生态系统的一部分 - 18+ 款工具,加上 Max,您的一对一 AI 交易导师。  随时在线,深入了解每一款指标,在您需要梳理思路的那一刻就在那里。  立即认识他: https://stein.investments 每根收盘K线运行 3,000+ 次交易模拟。9 种强度状态。2 种策略并行测试。一键采用最优配置。 为什么需要这个 大多数强度指标只给您一个数值,然后留下三个问题:相信哪个阈值、用哪个 Stop Loss、走哪个交易方向。Power Candles V3 在每根收盘K线上自动回答这些问题。结果就是一个完整的交易方案 -
Market Structure Order Block Dashboard MT5 是一款专为希望直接在图表上解读市场结构和主要价格反应区域的交易者设计的MT5指标。它结合了BOS、ChoCH、订单块(Order Blocks)、公允价值缺口(FVG)、流动性、Kill Zones、成交量分布图以及一个紧凑的面板,便于快速分析。 本指标面向使用市场结构、ICT和Smart Money概念作为决策框架的交易者。它可以帮助以更结构化的方式识别趋势延续、可能的反转、价格失衡、流动性目标和关注区域。 面向买家的资源 购买后可通过MQL5私信申请获取完整的PDF使用指南和参数配置建议。通过MQL5私信提供直接技术支持。 1.20版本带来两项重要新增: Pending BOS / Pending ChoCH 检测 和 可拖动面板 (按住面板标题栏即可将其拖动到图表任意位置,不影响图表本身)。当K线收于前一摆动点之外时,Pending Breaks 立即显示待确认的结构突破,无需等待经典的摆动确认。 重要 本产品仅为指标。它不会自动开仓、平仓或管理仓位。它不是EA(智能交易系统)。 主要功能 市场
Scalper Vault   是一个专业的剥头皮系统,为您提供成功剥头皮所需的一切。该指标是一个完整的交易系统,可供外汇和二元期权交易者使用。推荐的时间范围是 M5。 该系统为您提供趋势方向的准确箭头信号。它还为您提供顶部和底部信号以及江恩市场水平。无论您拥有何种交易经验,该系统都易于使用。您只需要遵循简单的规则并每天重复该过程。 建议将此系统用于主要货币对。感谢您的关注! 请注意,该指标在策略测试器中可能无法正常工作。因此,我建议仅在模拟或真实账户的真实交易条件下使用该系统。 指示器提供所有类型的警报,包括推送通知。 购买指标后请与我联系。我将免费与您分享我的个人交易建议和出色的奖励指标! 祝您交易愉快,盈利!
Atomic Analyst MT5
Issam Kassas
4.47 (60)
Atomic Analyst — MetaTrader 5 购买后,请在 MQL5 上给我发消息,即可免费获得 Smart Universal Expert Advisor,以及在线课程、PDF 手册和私人群组访问权限。 Atomic Analyst 将价格行为、趋势方向、入场和出场信号、止损位及多个止盈位集中呈现在图表上。 看清信号,理解交易形态 Atomic Analyst 将分析结果整理为清晰的可视化信息: • 买入和卖出箭头,用于识别潜在的入场机会。 • 止损位和多个止盈位,帮助规划交易。 • 趋势、强度和动量读数,用于评估市场方向。 • 多时间周期分析,用于比较更广泛的市场背景。 • 彩色K线和提醒,帮助您跟踪变化的市场条件。 结合辅助分析查看信号,再判断该交易形态是否符合您的交易规则。 从短期形态到更大级别的行情 您可以将 Atomic Analyst 用于剥头皮交易、日内交易,或跟踪持续时间更长的市场走势。 建议从 H1 时间周期开始。建议交易品种包括 EURUSD、AUDUSD 和 XAUUSD。 从信号到自动化 Smart Universal Expert A
FX Power MT5 NG
Daniel Stein
5 (33)
FX Power:分析货币强度,助您做出更明智的交易决策 概述 FX Power 是一款专业工具,帮助您全面了解主要货币和黄金在任何市场条件下的真实强度。通过识别强势货币用于买入,弱势货币用于卖出, FX Power 简化了交易决策,并帮助您发现高概率的交易机会。不论您是想跟随趋势还是通过极端的 Delta 值预测反转,这款工具都能完美适应您的交易风格。别再盲目交易——用 FX Power 让您的交易更加智慧。 1. 为什么 FX Power 对交易者极具价值 实时货币和黄金强度分析 • FX Power 实时计算并显示主要货币和黄金的相对强度,助您全面了解市场动态。 • 监控领先或落后资产,轻松识别值得交易的货币对。 全面的多时间框架视图 • 跟踪短期、中期和长期时间框架的货币和黄金强度,以便将您的交易策略与市场趋势保持一致。 • 无论是快进快出的短线交易还是更长期的投资策略, FX Power 都能为您提供所需的信息。 Delta 动态分析用于趋势和反转 • 极端 Delta 值常常预示反转机会,而平缓的 Delta 变化则确认趋势延续。 • 使用 Delta 分析,轻
Divergence Bomber
Ihor Otkydach
4.89 (94)
购买该指标的每位用户将额外免费获得以下内容: 原创工具“Bomber Utility”,该工具会自动跟踪每一笔交易,设置止损和止盈点,并根据策略规则自动平仓; 适用于不同交易品种的指标设置文件(Set 文件); 三种不同风险模式下的 Bomber Utility 设置文件:“最低风险”、“平衡风险” 和 “观望策略”; 一套详细的 视频操作手册,帮助您快速完成安装、配置并开始使用本交易系统。 注意: 要获取以上所有赠品,请通过 MQL5 的私人消息系统联系卖家。 我为您介绍原创的自定义指标 “Divergence Bomber”(背离轰炸机),它是一套基于 MACD 背离交易策略 的“全功能”交易系统。 该技术指标的主要任务是识别 价格与 MACD 指标之间的背离,并发出交易信号(包括推送通知),指示未来价格可能的运动方向。平均而言,这些信号的准确率超过 98%。有关该指标如何工作的详细说明,请观看本页面上的视频演示。 该系统使用 止损订单 和 动态回撤平仓机制 来管理交易。 Divergence Bomber 指标的主要特点: 支持交易的品种: AUDCAD、AUDCHF、AUDS
Crystal Heikin Ashi Signals
Muhammad Jawad Shabir
5 (4)
Crystal Heikin Ashi Signals—Professional Trend & Signal Detection Indicator Advanced Heikin Ashi Visualization with Intelligent Signal System for Manual & Automated Trading Final Price: $149 ---------> Price goes up $10 after every 10 sales . Limited slots available — act fast . Overview User Guide PDF Crystal Heikin Ashi Signals is a professional-grade MetaTrader 5 indicator that combines pure Heikin Ashi candle visualization with an advanced momentum-shift detection system. Designed for both m
DayTrader PRO
Davit Beridze
5 (4)
DayTrader PRO DayTrader PRO 是一款先进的交易指标,它结合了约翰·埃勒斯 (John Ehlers) 的 Laguerre 滤波器与强大的自动优化引擎。该指标不依赖固定的参数,而是根据最新的市场状况自动搜寻最佳设置,帮助您在无需手动调整的情况下适应不断变化的市场波动。 该指标可生成清晰的买入 (BUY) 和卖出 (SELL) 信号,并提供根据当前市场波动率计算得出的自适应止损 (Stop Loss) 和止盈 (Take Profit) 水平。内置的趋势、效率系数 (Efficiency Ratio)、波动率和蜡烛图过滤功能,有助于剔除低质量的交易设置,从而提高信号的准确性。 实时性能面板会显示当前已优化的设置、利润因子 (Profit Factor)、胜率 (Win Rate)、回撤 (Drawdown) 以及其他交易统计数据。DayTrader PRO 还支持弹出窗口、推送、邮件和声音提醒,确保您不会错过任何交易机会。 主要功能 全自动参数优化 自适应买入与卖出信号 基于 ATR 的动态止损与止盈 支持每日、每周或每月重新优化 内置趋势与市场过滤功能 性能统
Quant Direction MT5
Georgios Kalomoiropoulos
Quant Direction 是一款三维市场分析工具。它通过同时计算多个维度上的精确百分比偏差,提供完全客观的、基于算法的市场分析视角。该算法采用先进的人工智能建模工具开发,并经过全面测试,旨在以独特的精准度解读市场。它可以分析您平台上的任何货币对或金融工具。 无论您是短线 交易者、日内 交易者还是波段交易者,Quant Direction 都是您的理想之选。 交易者的真正优势 Quant Direction 的真正优势在于彻底消除情绪、屏幕疲劳和过度思考。它无需手动点击十几个图表来寻找方向并反复质疑自己的偏好,引擎即可在几毫秒内即时处理 8 个时间周期(从 5 个月到月线)。它能准确告诉你任何时刻谁在掌控市场,确保你始终朝着概率最高的方向进行交易。 市场分析的三个维度 该算法将市场分为三个不同的交易维度,为您提供完整的宏观和微观视角: 超短线交易分析: 捕捉即时、快速的动量变化和较低时间框架的执行点。 日内分析: 识别真实的、潜在的每日方向性偏差。 波动分析: 专注于宏观趋势,确保您不会与大盘机构的走势背道而驰。 独家评分引擎 Quant Direction 的底层采用了一套
Smc Pro ToolKit
Talal N Z Aljarusha
5 (13)
SMC PRO TOOLKIT — 智能资金分析与结构化交易规划 SMC Pro ToolKit 是一款面向 MetaTrader 5 的专业智能资金概念(Smart Money Concepts / SMC)分析工作空间。 它将市场结构、多周期分析、机构级价格区域、交易机会评估、确认工具、成交量背景、提醒系统和风险规划整合在一个结构清晰的图表环境中。 一个工作空间,多层确认,一套结构化交易计划。 打开完整用户指南 多条件交易机会引擎 SMC Pro ToolKit 的核心是一套 多条件交易机会引擎 。 该引擎不会依赖单一指标或单一市场事件,而是通过多个层面的市场信息,对潜在交易机会进行综合评估。 系统会分析市场结构和背景条件,将各项结果整合为 交易机会质量评分 ,并且只有在所需确认框架完整成立后,才会展示相应的交易思路。 市场背景 → 多周期一致性 → 智能资金区域 → 确认信号 → 质量评分 → 交易计划 当交易机会满足条件时,SMC Pro ToolKit 可以直接在图表上生成完整的交易计划,包括: 买入 / 卖出方向 入场价 止损价 止盈价 风险回报比 交易机会质量
作者的更多信息
Fabii Rsx Ema Oscillator
Fabien Georges Andre Guillemaud
See momentum turn early, without the noise. RSX EMA is a smooth Jurik-based oscillator whose crossover tells you the moment a trend loses or gains steam — with clean popup, sound and push alerts so you never miss it. Any pair, any timeframe. No repaint — signals are final on bar close, so what you see now is what stays on the chart. Try it free in the Strategy Tester before you buy. THE PROBLEM Most oscillators are either too noisy or too slow. Raw RSI whips on every candle; heavily smo
Fabii Supertrend NMA
Fabien Georges Andre Guillemaud
A SuperTrend that stops whipsawing in ranges — its adaptive NMA center cuts the false flips. Any pair, any timeframe. No repaint — signals are final on bar close. Free. Test it in the Strategy Tester in seconds. >> Get more free indicators here Baseline, volatility, oscillators & more — free and premium. No repainting. No guessing. Just clean signals. THE PROBLEM A classic SuperTrend centers its bands on the raw median price. In a range, that center chases every wiggle, so the line fl
FREE
Fabii Essential Trend Baseline
Fabien Georges Andre Guillemaud
Know exactly when a trend flips — signal confirmed on bar close, no repaint. Any pair, any timeframe. Free to download and test in the Strategy Tester. >> Get more free indicators here Baseline, volatility, oscillators & more — free and premium. No repainting. No guessing. Just clean signals. THE PROBLEM A trend indicator gives you a direction. It does not tell you whether that direction has enough momentum behind it to act on. You enter because the line turned green. Price drifts for
FREE
Fabii Vwap SSL Baseline
Fabien Georges Andre Guillemaud
One coloured line that always tells you which side of the VWAP you're on. No repaint. Free in the Strategy Tester. >> Get more free indicators here Baseline, volatility, oscillators & more — free and premium. No repainting. No guessing. Just clean signals. THE PROBLEM You watch the VWAP every session. Price crosses it, bounces off it, crosses again. You know it matters — but you hesitate at every entry: which crossing is real, which is noise? Every bar you misread the bias is a trade
FREE
Fabii NNFX Atr Levels
Fabien Georges Andre Guillemaud
Place your ATR stop-loss, take-profit and exact lot size in ONE click. Free, native MT5, no repaint. Click any candle → entry, TP and SL appear instantly, plus the precise lot for your risk %. Any pair, any timeframe, any market. Stop doing ATR math by hand. >> Get more free indicators here Baseline, volatility, oscillators & more — free and premium. No repainting. No guessing. Just clean signals. THE PROBLEM If you trade the No Nonsense Forex (NNFX) method — or any ATR-based system
FREE
Fabii Nma Ssl Channel
Fabien Georges Andre Guillemaud
Get a clear trend line that holds in trends and stays quiet in noise — no repaint. Any pair, any timeframe. Signals lock on bar close. Free to download. Test it in the Strategy Tester before using it live. >> Get more free indicators here Baseline, volatility, oscillators & more — free and premium. No repainting. No guessing. Just clean signals. THE PROBLEM Most SSL channels use a fixed-speed moving average. That means the line reacts the same whether price is trending hard or grindin
FREE
Fabii Adxvma Ssl Channel
Fabien Georges Andre Guillemaud
One clean trend line that follows the lows while the trend holds, and flips above price only when the move truly turns. No repaint. Any pair, any timeframe. Every flip is final on bar close. Try it free on your own charts in the Strategy Tester. >> Get more free indicators here Baseline, volatility, oscillators & more — free and premium. No repainting. No guessing. Just clean signals. THE PROBLEM Most trend lines flip too early. A classic SSL channel rides two simple moving averages,
FREE
Fabii Atr Volatility Zones
Fabien Georges Andre Guillemaud
Tired of guessing whether the market is calm or about to explode? See every candle's volatility regime at a glance, in color. Any pair, any timeframe, any market. No repaint. Free — download it and read your chart in seconds. >> Get more free indicators here Baseline, volatility, oscillators & more — free and premium. No repainting. No guessing. Just clean signals. THE PROBLEM Raw range tells you little. A 40-pip candle on Gold is quiet; on EURUSD it is a storm. Fixed ATR thresholds y
FREE
Fabii Volatility Bias
Fabien Georges Andre Guillemaud
Volatility tells you how much the market moves. This tells you which side is winning. Any pair, any timeframe, any market. No repaint. Free trial in the Strategy Tester. THE PROBLEM Volatility tells you how much the market is moving, but not which side is doing the moving. A rising ATR looks the same whether buyers or sellers are in control. So you are left guessing: is this expansion pushing up, or down? Most volatility tools stay silent on direction, and most directional tools ignore
Fabii Kaufman Efficiency Ratio
Fabien Georges Andre Guillemaud
Tired of entering a "trend" that turns out to be chop and stops you out? This filter shows real trends from noise at a glance. Any pair, any timeframe. No repaint. Free trial in the Strategy Tester. THE PROBLEM Chop is expensive. It fakes a trend just long enough to trap you, then stops you out and moves on. You enter a "breakout" and it dies. You skip a real move after three fake trends. You read three indicators just to guess the market's state. The hard part isn't seeing that price m
Fabii Volatility ATR Percentile
Fabien Georges Andre Guillemaud
Turn raw ATR into a clear 0-100 volatility reading — is the market quiet or stretched? See it at a glance. No repaint. Any pair, any timeframe. Free trial in the Strategy Tester. THE PROBLEM Raw ATR gives you a number — say 0.0040 — but that number means nothing on its own. Is 40 pips high for this pair right now, or perfectly normal? You can't tell without scrolling back through weeks of history in your head. So most traders either ignore volatility timing entirely, or size every trade
Fabii Volatility Acceleration Index
Fabien Georges Andre Guillemaud
See at a glance when volatility is speeding up before a move — and when it is fading into a dead market. Any pair, any timeframe. No repaint — signals are final on bar close. Try it free in the Strategy Tester before you buy. THE PROBLEM Most volatility tools tell you how big the range is right now. They do not tell you the one thing that matters for timing: is volatility accelerating or slowing down? You end up entering just as a move runs out of steam, or sitting out while a breakout
Fabii Memory Baseline
Fabien Georges Andre Guillemaud
Every moving average forgets a move the moment it ends. This baseline remembers — it holds the level a trend reached instead of snapping back into the noise. Your trading timeframe and a higher one on the same chart. Any pair, any timeframe. No repaint. Try it free on your own charts in the Strategy Tester before you buy. THE PROBLEM A normal moving average follows price tick by tick. In a quiet range it wobbles, and every small spike drags it around — so your entries and exits flip on
Fabii Adxvma Ssl Pro
Fabien Georges Andre Guillemaud
One adaptive SSL trend line that only flips when the move is real, plus a second SSL baseline from a higher timeframe on the same chart, Buy/Sell arrows, and an ATR filter that blocks weak signals before they reach you. No repaint. Try the free version first: Fabii Adxvma Ssl Channel. THE PROBLEM A classic SSL channel flips on every small push. Even the adaptive ADXVMA version flips too often in choppy markets, fires arrows on signals that reverse the next bar, and shows you only one ti
Fabii Nma Ssl Pro
Fabien Georges Andre Guillemaud
Know the trend direction before you enter — adaptive SSL line with an ATR filter that blocks weak flips. No repaint. Any pair, any timeframe. Signals lock on bar close. Test it free in the Strategy Tester before buying. THE PROBLEM Standard SSL channels flip at every small push against the trend. You take the signal, price reverses immediately, and you stop out. Tighten the filter, you miss real moves. Loosen it, you drown in noise. And watching one timeframe only, you never know whethe
Fabii Ehlers Adaptive Bands
Fabien Georges Andre Guillemaud
Know exactly when the trend flips — before you miss the move. Signals lock on bar close, no repaint. Any pair, any timeframe. Free demo in the Strategy Tester. THE PROBLEM Most trend tools give you a direction — but they keep repainting until the bar closes, or they lag so far behind that the entry is gone by the time they confirm. You end up either chasing or sitting out clean moves. Every bar you misread the regime is a trade you size wrong or skip entirely. THE SOLUTION Fabi
Fabii Responsive Trend Baseline
Fabien Georges Andre Guillemaud
Catch trend changes earlier. Five low-lag baselines, one confluence filter. No repaint. Any pair, any market, any timeframe.. THE PROBLEM Classic trend tools — SMA, EMA — smooth the price. They also lag. By the time they confirm the trend, a large part of the move is already behind you. You need a baseline that reacts faster without producing noise. One that shows direction and confirms momentum — on the same chart, without a second indicator. Fabii Responsive Trend Baseline uses five l
Fabii Ehlers Trend Baseline
Fabien Georges Andre Guillemaud
Cleaner trend signals. Fewer false flips. Five Ehlers filters that separate real moves from market noise. No repaint. Any pair, any market, any timeframe.  THE PROBLEM Most moving averages smooth the price. They also smooth the signal. When markets chop, they flip direction repeatedly. When they trend, they lag the move. The problem is not smoothness. The problem is noise. Random price fluctuations that look like signals but are not. You act on them, the market reverses, and you are on
Fabii Adaptive Trend Baseline
Fabien Georges Andre Guillemaud
A baseline that adjusts its own speed. Faster when the trend is real. Slower when it is noise. No repaint. Any pair, any market, any timeframe. THE PROBLEM A fixed-speed baseline makes a compromise. Set it fast — it catches trends early but produces noise in ranging markets. Set it slow — it ignores noise but misses the first part of every move. Markets switch between trending and ranging constantly. A single speed cannot handle both. Fabii Adaptive Trend Baseline uses five self-adjusti
Fabii Universal Trend Baseline
Fabien Georges Andre Guillemaud
18 trend baselines. One indicator. No repaint. Any pair, any market, any timeframe. THE PROBLEM Different markets call for different baselines. A fast low-lag average that works on XAUUSD D1 produces noise on GBPUSD H4. An adaptive baseline that handles ranging conditions perfectly may lag on a clean trending instrument. Finding the right baseline for each market means testing. Switching between indicators. Managing multiple setups. Fabii Universal Trend Baseline puts all 18 baselines i
Fabii Coral Trend
Fabien Georges Andre Guillemaud
Know your trend bias on two timeframes at once — no repaint, signals final on bar close. Any pair, any timeframe, any market. Free demo in the Strategy Tester. >> Get more free and premium indicators here Baseline, volatility, oscillators & more. No repainting. No guessing. Just clean signals. THE PROBLEM You know the chart-timeframe trend. But you do not know whether the higher timeframe agrees — until you flip to it, then flip back, and the moment is gone. Entering with the short-t
Fabii Half Trend Baseline
Fabien Georges Andre Guillemaud
Know the trend on your chart and on the higher timeframe at a glance — no repaint. Any pair, any timeframe. Signals are final on bar close. Test it free on your own charts in the Strategy Tester. >> Get more free and premium indicators here Baseline, volatility, oscillators and more. No repainting. No guessing. Just clean signals. THE PROBLEM You look at a chart and the trend is not obvious. Moving averages lag, lines jump back and forth, and arrows disappear after you acted on them. T
筛选:
无评论
回复评论