Fabii Universal Trend Baseline

Test 18 baselines on one chart and keep the one that fits your market. One dropdown, one logic, no second indicator. No repaint.
Any pair, any market, any timeframe. Free demo in the Strategy Tester.


Get more indicators here
Baselines, volatility filters and oscillators. No repaint.


Why you need it

The baseline that works on one pair reacts too late on another, or too often in a range. Changing it means loading another indicator and rebuilding your chart. So you keep a baseline that does not fit your market. Every entry on a baseline that lags or jumps costs you a stop loss.

What you get

Fabii Universal Trend Baseline is a baseline indicator with 18 moving averages in one place, so you stop switching indicators to find the average that fits your pair.

  • One dropdown gives you 18 baselines, so you compare them on your own chart without loading another indicator.
  • The same trend logic for every baseline, so you compare the averages and not the rules.
  • A flip appears only when the close goes beyond the deviation band, not when price merely touches the line, so you filter out weak flips.
  • Shaded zones show where price pushes beyond the band in the trend direction, so you see where momentum confirms the move.
  • Buy and sell arrows sit outside the bands at a distance based on the Average True Range (ATR), so you spot each flip without clutter.
  • Alerts by popup, sound or push notification, so you do not have to watch the chart.

How it works

The baseline is a moving average of your price source, chosen from 18 averages in four families.

Classic: Simple Moving Average (SMA), Exponential Moving Average (EMA), Smoothed Moving Average (SMMA). Responsive: Hull Moving Average (HMA), DEMA, TEMA, T3, ZLEMA. Adaptive: Kaufman Adaptive Moving Average (KAMA), VIDYA, ALMA, Average Directional Index (ADX) Volatility Moving Average (ADXVMA), Ocean Natural Moving Average (NMA). Ehlers: FRAMA, Super Smoother, Low-Pass, Laguerre, G-Channel.

The indicator measures the smoothed average distance between price and baseline and draws two deviation bands around it. The trend turns up when a bar closes above the upper band, and down when a bar closes below the lower band. Signals use closed bars only.

How to use it

  1. Attach the indicator to any chart.
  2. Open Baseline type and try the averages on your own pair and timeframe.
  3. Read the line color: green is an up trend, red is a down trend.
  4. Enter in the trend direction by your own rules: after a flip arrow, or when price pushes into a shaded zone.
  5. Turn on the alerts you want.

Key settings

Setting What it does Default
Baseline type Choose one of 18 moving averages. Sets the speed and the smoothness. SMA
Baseline length Bars in the baseline. Higher is smoother, lower is faster. 28
Deviation multiplier Width of the bands. Wider means fewer, stronger flips. 1.0
MA-specific params Fine tuning for T3, ALMA, KAMA, VIDYA and Laguerre. The other averages ignore it. T3 0.7, ALMA 0.85 and 6.0, KAMA 2 and 30, VIDYA 9, Laguerre 0
Show speculation zones Shows or hides the shaded zones. true
Alert on trend flip (Long/Short) Alert when the trend changes direction. true
Bars to display (min 50) Bars calculated, for speed. Used when Limit to N bars is on. 500

Other settings control colors, arrow codes, alert channels and display options.

Test it before you decide

Let a bar close, then check that the value in the Data Window does not change. To test it: click Free Demo, then run it in the Strategy Tester in visual mode on your pair and timeframe.

Updates are free and included. Every release is listed in the What's new section of this page, so you always know what changed.

Fabii Essential Trend Baseline is a separate free indicator with three classic averages. Fabii Responsive Trend Baseline, Fabii Adaptive Trend Baseline and Fabii Ehlers Trend Baseline are separate indicators, each focused on one family of averages. Follow my profile to be notified of new releases.

Get it and have it on your charts in 2 minutes.

Comments and reviews

Questions? Post a comment on this page or message me and you get an answer within 24 hours.

If this saves you time, a short review that says which pair and timeframe you use helps other traders find it.

Past results do not predict future results. This indicator does not provide financial advice.

Recommended products
CosmiCLab SMC FIBO CosmiCLab SMC FIBO is a professional trading indicator designed for traders who use Smart Money Concepts (SMC), market structure analysis and Fibonacci retracement levels. The indicator automatically detects market swings and builds Fibonacci levels based on the latest impulse movement. It also identifies market structure changes such as BOS (Break of Structure) and CHOCH (Change of Character), helping traders understand the current market direction. CosmiCLab SMC FIBO also pr
RBreaker
Zhong Long Wu
RBreaker Gold Indicators is a short-term intraday trading strategy for gold futures that combines trend following and intraday reversal approaches. It not only captures profits during trending markets but also enables timely profit-taking and counter-trend trading during market reversals. This strategy has been ranked among the top ten most profitable trading strategies by the American magazine   Futures Truth   for 15 consecutive years. It boasts a long lifecycle and remains widely used and st
Noize Absorption Index - is the manual trading system that measures the difference of pressure between bears forces and bulls forces. Green line - is a noize free index that showing curent situation. Zero value of index shows totally choppy/flat market.Values above zero level shows how powerfull bullish wave is and values below zero measures bearish forces.Up arrow appears on bearish market when it's ready to reverse, dn arrow appears on weak bullish market, as a result of reverse expectation.
SMC Indicator BOS & CHoCH analyze market structure using Smart Money Concepts The indicator combines BOS (Break of Structure), CHoCH (Change of Character), Fair Value Gaps (FVG), Liquidity Sweep logic and ATR filtering to provide a structured view of market movements and potential trading opportunities. The indicator automatically identifies swing highs and swing lows and monitors structural breaks in the market. BOS (Break of Structure) identifies potential continuation of the current market st
NQX Range Edge Hook Weekly Bias is a signal indicator for MetaTrader 5: range edge hook signals (it only signals in the direction of the weekly bias). Proprietary NQX logic that detects price leaving the edge of its recent range, confirmed by the candle. It only signals in the direction of the weekly bias. It draws the suggested entry, a short stop and long targets (3:1, 5:1, 10:1, up to 20:1 on swing); you decide. What it draws on the chart - An arrow on the closed signal candle (it never repai
Heiken_Ashi_Bars - Advanced Trend Visualizer for MT5 Overview Heiken_Ashi_Bars is a powerful, visually intuitive custom indicator designed to filter out market noise and highlight the true underlying trend. Traditional candlestick charts can often be erratic, leading to false signals and premature exits. By averaging the price data, this indicator smooths out price action, making it significantly easier to spot trend continuations, reversals, and profitable entry zones. Whether you are a scalper
Price Magnet — Price Density and Attraction Levels Indicator Price Magnet is a professional analytical tool designed to identify key support and resistance levels based on statistical Price Density. The indicator analyzes a specified historical period and detects price levels where the market spent the most time. These zones act as “magnets,” attracting price action or forming a structural base for potential reversals. Unlike traditional Volume Profile tools, Price Magnet focuses on price-time d
Trend Master V2
Oratile Pitsoane
What Is Trend Master Pro? Trend Master Pro   is a professional-grade trend trading indicator built for MetaTrader 5. It was designed with one goal in mind — to keep you on the right side of the market at all times by combining three powerful technical tools into a single, clean, easy-to-read display directly on your price chart. Instead of cluttering your screen with multiple separate indicators, Trend Master Pro fuses an   EMA Ribbon trend filter , a   ZigZag swing point engine , and a   breako
TRI Visualizer
Yoshimi Mon 三 Ura
TRI Visualizer MT5 – Thermodynamic Market Analysis Overview The TRI (Thermal Range Indicator) Visualizer Enhanced is a rare market analysis indicator that goes beyond conventional technical analysis, applying principles of thermodynamics from physics. It interprets market price fluctuations as “thermodynamic energy,” enabling the highly accurate detection of subtle market changes that are often overlooked. Innovative Mechanisms 1. Dual Calculation Engines Classic TRI Mode Formula: |Close
An indicator of pattern #31 ("Long Island") from Encyclopedia of Chart Patterns by Thomas N. Bulkowski. The second gap is in the opposite direction. Parameters: Alerts - show alert when an arrow appears   Push - send a push notification when an arrow appears (requires configuration in the terminal) GapSize - minimum gap size in points ArrowType - a symbol from 1 to 17 ArrowVShift - vertical shift of arrows in points   ShowLevels - show levels ColUp - color of an upward line ColDn - color of a d
NQX Smooth Trend Flip Weekly Bias is a signal indicator for MetaTrader 5: smooth trend flip signals (it only signals in the direction of the weekly bias). Proprietary NQX logic that detects a colour flip of the smoothed candles after a run. It only signals in the direction of the weekly bias. It draws the suggested entry, a short stop and long targets (3:1, 5:1, 10:1, up to 20:1 on swing); you decide. What it draws on the chart - An arrow on the closed signal candle (it never repaints a closed s
HMA Trend Professional MT5
Pavel Zamoshnikov
4.25 (4)
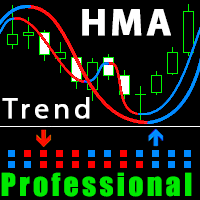
Improved version of the free HMA Trend indicator (for MetaTrader 4) with statistical analysis. HMA Trend is a trend indicator based on the Hull Moving Average (HMA) with two periods. HMA with a slow period identifies the trend, while HMA with a fast period determines the short-term movements and signals in the trend direction. The main differences from the free version: Ability to predict the probability of a trend reversal using analysis of history data. Plotting statistical charts for analyzi
Your Trend Friend
Luigi Nunes Labigalini
5 (1)
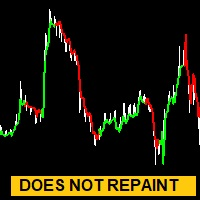
The trend is your friend! Look at the color of the indicator and trade on that direction. It does not  repaint. After each candle is closed, that's the color of the trend. You can focus on shorter faster trends or major trends, just test what's most suitable for the symbol and timeframe you trade. Simply change the "Length" parameter and the indicator will automatically adapt. You can also change the color, thickness and style of the lines. Download and give it a try! There are big movements w
HAS RSI Signal — Professional Trend Indicator with SL/TP Calculation HAS RSI Signal is a powerful trading tool that combines time-tested classics with modern noise-filtering algorithms. The indicator analyzes the market through the prism of Heiken Ashi Smoothed candles and the RSI oscillator, providing clear entry signals at trend reversals or when exiting overbought/oversold zones. Key Advantages: Double Filtration: Using Heiken Ashi Smoothed eliminates market "noise," while RSI confirms the mo
Confluence Meter: one consolidated rating from 26 indicators Confluence Meter calculates the signals of 26 popular indicators and merges them into a simple sell / neutral / buy rating. You don't have to open dozens of windows and compare readings by hand. One glance at the panel is enough to see which way the market is leaning on the selected timeframe. MT4-version:  https://www.mql5.com/en/market/product/199466 Our products: https://www.mql5.com/en/users/trendhunter/seller What you see on the c
A clearer view of momentum, with the tools to follow more than one market. WaveTrend SuperSmoother Signals PRO brings a smoothed WaveTrend oscillator, filtered Buy/Sell signals and a clickable market scanner to MetaTrader 5. Review momentum on your chart, align signals with a higher timeframe and move directly to the markets that need your attention. PRO uses the same signal engine as WaveTrend SuperSmoother Signals IRABC and adds two practical tools: a higher-timeframe trend filter and a multi
Candle Fusion Pro
Martin Alejandro Bamonte
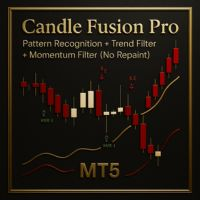
Candle Fusion Pro — Pattern Recognition + Trend Filter + Momentum Filter (No Repaint) Detect powerful candlestick formations and confirm their strength with live trend and momentum analysis. Candle Fusion Pro is the ultimate visual tool for traders who rely on price action precision , trend structure, and multi-layered confirmation . Core Features Pattern-Based Entry : Detects over 10+ advanced Japanese patterns , including: Shooting Stars (levels 2, 3, 4) Bullish/Bearish Engulfings Morning/Ev
Dynasty SMC/ICT Terminal — v3.0 "Neon-Ops Edition" An all-in-one Smart Money Concepts / ICT dashboard for MetaTrader 5. It's an indicator, not an auto-trading EA — it never places, modifies, or closes real orders. It scans price action for Order Blocks, Fair Value Gaps, market structure, harmonic patterns, and multi-timeframe momentum, blends everything into one calibratable Master Signal, and — if enabled — builds a fully automated on-chart trade plan with entry, stop loss, three take-profit ta
Monitor your order
Eslam Mohamed Hassanein Hassan Aly
Advanced Lot & Profit Monitor PRO is a powerful MT5 indicator that provides real-time monitoring of your trading positions directly on the chart. It displays the number of orders, total lot sizes, and profit (including swap) for Buy and Sell positions separately, as well as the overall account performance. Designed with a clean and customizable interface, this tool helps traders stay in control of their exposure and risk at all times. Key Features: Real-time monitoring of open positions Sepa
STRICTLY FOR BOOM INDEX ONLY!!!!! Here I bring the Maximum Trend Arrows OT1.0 MT5 indicator. This indicator is made up of a combination of different trend indicators for entries and exits, for entries an orange arrow will paint on the chart below the current market and a red flag for closing of trades and it produces buy arrows only. When the orange arrow appears, it will appear along with it's sound to notify you. The 1H timeframe is recommended, don't use it anywhere else than on the 1H timefr
# DRAWDOWN INDICATOR V4.0 - The Essential Tool to Master Your Trading ## Transform Your Trading with a Complete Real-Time Performance Overview In the demanding world of Forex and CFD trading, **knowing your real-time performance** isn't a luxury—it's an **absolute necessity**. The **Drawdown Indicator V4.0** is much more than a simple indicator: it's your **professional dashboard** that gives you a clear, precise, and instant view of your trading account status. --- ## Why This Indicator
NQX Oscillator Hook London
Marcel De Oliveira Farias
NQX Oscillator Hook London is a signal indicator for MetaTrader 5: oscillator hook signals (it only signals during the london session (intraday charts)). Proprietary NQX logic that detects an oscillator hook out of an extreme zone. It only signals during the London session (intraday charts). It draws the suggested entry, a short stop and long targets (3:1, 5:1, 10:1, up to 20:1 on swing); you decide. What it draws on the chart - An arrow on the closed signal candle (it never repaints a closed si
Official BlueDigitsFx Ecosystem Access Get infrastructure updates, workflow resources, product releases, and ecosystem access through the official BlueDigitsFx ecosystem. Telegram Ecosystem Website MT4 Version BlueDigitsFx Spike And Strike Reversal MT5 — Mixed Oscillator for Market Reversal & Momentum Analysis BlueDigitsFx Spike And Strike Reversal is a composite oscillator that combines multiple indicator signals to help traders identify possible market reversals, momentum shifts, and exhau
Passband Filter Pro Passband Filter Pro is a trend and cycle oscillator for MetaTrader 5. It is built on the Ehlers Super Passband Filter, a band pass filter that removes long term trend drift and short term noise so that only the dominant market cycle remains. The result is a clean oscillator with a color cloud that shows overbought and oversold conditions, cycle turns, and momentum on forex, gold, indices, stocks and crypto. Most traders enter too early or too late. Simple moving averages la
Caicai L&S Yield Histogram Important Notice: This indicator is an integral tool of the automated EA Caicai Long and Short Pair Trading . This indicator visually displays the percentage deviation (Yield %) of a pair's current spread relative to its own historical mean. It is an excellent tool for quickly visualizing the gross financial potential of a market distortion in Long & Short operations. Main Features: Percentage Visualization: Understand the size of the distortion in palpable percentage
YazanPro Pattern Scanner
Yazan Adnan Ramadan Ibrahim
Overview YazanPro Pattern Scanner is a MetaTrader 5 indicator for traders who work with chart patterns on many markets. It checks up to 150 symbols on up to 9 timeframes for classic chart patterns and 40 candlestick patterns, and lists everything in one table with the stage each pattern has reached. Instead of opening chart after chart, you see where a pattern has just completed, broken out, been retested or confirmed, and one click opens that chart with the pattern drawn. Main features Up to 15
Gold Pullback Signals marks bullish and bearish pullback breakouts on an M30 chart. It compares the signal candle with the preceding three candles, checks the direction of the last completed H1 candle against its moving average and recent trend, and scales its entry filters and stop buffer to recent volatility. It was evaluated on XAUUSD. The indicator displays setups and sends optional alerts. It does not place orders. Arrow direction identifies a long or short setup. Arrow color grades the co
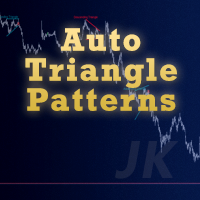
Auto Triangle Patterns Overview Auto Triangle Patterns is a chart indicator for MetaTrader 5. It scans the price history of the current chart and looks for three classical triangle formations: ascending, descending and symmetrical. When a formation is found, the indicator draws its two boundary lines, fills the area between them and adds a text label with the name of the formation. The pattern stays on the chart and is extended to the right with every new bar. When price leaves the formation in
Premium level is a unique indicator with more than 80% accuracy of correct predictions! This indicator has been tested for more than two months by the best Trading Specialists! The author's indicator you will not find anywhere else! From the screenshots you can see for yourself the accuracy of this tool! 1 is great for trading binary options with an expiration time of 1 candle. 2 works on all currency pairs, stocks, commodities, cryptocurrencies Instructions: As soon as the red arrow app
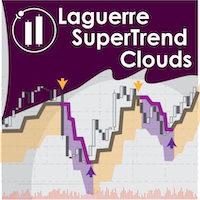
Laguerre SuperTrend Clouds   adds an Adaptive Laguerre averaging algorithm and alerts to the widely popular SuperTrend indicator. As the name suggests,   Laguerre SuperTrend Clouds (LSC)   is a trending indicator which works best in trendy (not choppy) markets. The SuperTrend is an extremely popular indicator for intraday and daily trading, and can be used on any timeframe. Incorporating Laguerre's equation to this can facilitate more robust trend detection and smoother filters. The LSC uses the
Buyers of this product also purchase
Trend Sniper X
Sarvarbek Abduvoxobov
4.87 (46)
Trend Sniper X is a multi-timeframe trend-following indicator for MetaTrader 5 that helps traders identify trend direction and potential reversal points with clarity and precision. for MT4: https://www.mql5.com/en/market/product/193245 Price Information: The current price is promotional and is subject to change as upcoming updates and new features are released. Bonus Offer: To get the FREE Auto-Trade Assistant EA for this indicator, please message the author after purchasing. Code2Profit Channe
Entry Points Pro shows you where to enter, where to put the stop and what lot to trade — before you place the order. PRICE Now 199 USD: 4 copies at this price, then 249 USD. The final price is 349 USD. I make my money trading the markets, and I show it, so I don't need to sell this indicator to everyone. It is a tool for traders who think for themselves, not a magic button. No breakout, no trade. A gray arrow is a cancelled signal: price did not break the signal candle, so there was no entry
Gann Made Easy   is a professional and easy to use Forex trading system which is based on the best principles of trading using the theory of W.D. Gann. The indicator provides accurate BUY and SELL signals including Stop Loss and Take Profit levels. You can trade even on the go using PUSH notifications. PLEASE CONTACT ME AFTER PURCHASE TO GET TRADING  INSTRUCTIONS   AND GREAT EXTRA INDICATORS  FOR FREE! Probably you already heard about the Gann trading methods before. Usually the Gann theory is a
Ultra Indicator
Ihor Otkydach
5 (1)
ULTRA is a technical indicator that operates on an “all-in-one” basis—it independently analyzes the market, generates trading signals, displays levels for setting stop-loss orders, and suggests when to close trades to lock in profits or minimize losses. In other words, it doesn't matter if you don't know how to analyze the market, determine levels—where to set your stop-loss—or struggle with money management. ULTRA will do all of that for you! BUYER BONUS: After purchasing the ULTRA indicator, s
Currency Strength Wizard   is a very powerful indicator that provides you with all-in-one solution for successful trading. The indicator calculates the power of this or that forex pair using the data of all currencies on multiple time frames. This data is represented in a form of easy to use currency index and currency power lines which you can use to see the power of this or that currency. All you need is attach the indicator to the chart you want to trade and the indicator will show you real s
Auto Optimized SpeedAngle is an institutional-grade momentum vectoring system that eliminates curve-fitting through continuous Walk-Forward Optimization (WFO). Rather than relying on static inputs that degrade when market regimes shift, the indicator dynamically recalibrates its parameters using Out-of-Sample (OOS) validation, ensuring the displayed signals represent genuine statistical edges rather than historical anomalies. By shifting the focus from subjective visual angles to normalized, qua
Boba Analysis Suite
Trade Ready Solutions LLC
5 (2)
Boba Analysis Suite Boba Analysis Suite is an analytical indicator for MetaTrader 5. It brings market structure, relevant price zones and broader market context together in a single chart view. Developed through practical experience as a trader and trading coach, it supports a structured analysis process: assessing market direction, identifying important levels and considering multiple timeframes together. Analysis in Context Individual signals gain meaning through context. Boba Analysis Suite h
BLACK FRIDAY – 20% OFF Multi Currency Strength and Momentum Indicator MT5 Dynamic Forex28 Navigator is the evolution of our long-time, popular indicators, combining the power of five in one: Advanced Currency Strength28 Indicator (700 reviews) Advanced Currency IMPULSE with ALERT (530 reviews) Currency Strength EXOTICS GOLD Impulse with Alert CS28 Combo Signals (recent Bonus) No need to buy four indicators and stack them on your charts. All of it is merged into one powerful indicator: the streng
M1 Sniper MT5
Oleg Rodin
5 (7)
M1 SNIPER  is an easy to use trading indicator system. It is an arrow indicator which is designed for M1 time frame. The indicator can be used as a standalone system for scalping on M1 time frame and it can be used as a part of your existing trading system. Though this trading system was designed specifically for short-term trading, it still can be helpful for all traders. This trading system can be used with any forex pair and time frame, though lower time frames are recommended from M1 up to M
Azimuth Pro
Ottaviano De Cicco
5 (7)
Azimuth Pro V2: Synthetic Fractal Structure and Confirmed Entries for MT5 Overview Azimuth Pro is a multi-level swing structure indicator by Merkava Labs . Four nested swing layers, swing-anchored VWAP, ABC pattern detection, three-timeframe structural filtering, and closed-bar confirmed entries — one chart, one workflow from micro-swings to macro-cycles. This is not a blind signal product. It is a structure-first workflow for traders who care about location, context, and timing. 1. What Change
Apex Patterns PRO Buy Indicator - Get Expert Advisor Based on it for FREE. Self-Optimizing Chart Pattern & Breakout Intelligence Traditional pattern scanners rely on fixed inputs, often underperforming when market volatility and structures shift. Apex Patterns PRO is designed to adapt to changing market conditions by combining structural chart pattern recognition, momentum filtering, and statistical self-optimization into one analytical framework. Adaptive Scanning Engine Self-Optimizing Patter
Welcome to Entry In The Zone & SMC Multi Timeframe Entry In The Zone & SMC Multi Timeframe An indicator designed for market analysis based on Smart Money Concepts (SMC), displaying Market Structure, Key Zones (Order Blocks, Supply & Demand Zones, and Fair Value Gaps), Liquidity, and real-time BUY / SELL signals. It supports both Single-Timeframe and Multi-Timeframe analysis, along with the Confluence at Zone feature, which helps you evaluate supporting factors when price enters a key zone. Real-
Divergence Bomber
Ihor Otkydach
4.89 (94)
Each buyer of this indicator also receives the following for free: The custom utility "Bomber Utility", which automatically manages every trade, sets Stop Loss and Take Profit levels, and closes trades according to the rules of this strategy Set files for configuring the indicator for various assets Set files for configuring Bomber Utility in the following modes: "Minimum Risk", "Balanced Risk", and "Wait-and-See Strategy" A step-by-step video manual to help you quickly install, configure, and
Power Candles MT5
Daniel Stein
4.58 (12)
Power Candles - Self-Optimizing Strength Indicator Strength usually lives in a sub-window. The line runs below, the candle above, and your eye keeps connecting the two. Power Candles puts the strength into the candle itself, colored from dark red to dark green, so the chart reads at a glance and the sub-window stays closed. The indicator also finds its own settings for the symbol and timeframe in front of you. One click on [ Apply Best ] draws entry, Stop Loss and Take Profit at the exact prices
Gold Sniper Scalper Pro
Ich Khiem Nguyen
3.9 (10)
Gold Sniper Scalper Pro is a MetaTrader 5 indicator built specifically for detecting false breakout patterns on XAUUSD. It identifies the 4-bar trap structure where price breaks a range boundary, draws in breakout traders, then reverses back inside — confirming the move was a false breakout. The indicator scores each setup across 17 quality factors, evaluates it through a 4-layer confluence pipeline, verifies it against a 7-timeframe trend consensus engine, and checks it against a gold volatili
Naked Forex Tweezer Pro Indicator Tweezer Pro Indicator is a pattern recognition indicator for Forex, Stocks, Indices, Futures, Commodities and Cryptos. The standard Tweezer is a two bar pattern. Our enhanced version is a multi-bar pattern. We filter the patterns for you so that you only get the     best and most effective patterns   and ignore the noise. The Tweezer pattern is a simple and effective pattern to trade. The strategy that comes with the Tweezer is based on price action. The Twe
Adaptive Price Action Engine Buy Indicator- Get EA Based on it for FREE. Self-Optimizing Multi-Timeframe Trend & Candlestick Intelligence Markets do not behave the same way all the time—and not every price-action pattern has the same value in every market regime. Adaptive Price Action Engine is designed to adapt to changing market conditions by combining trend structure, multi-timeframe analysis, candlestick patterns, and statistical optimization into one analytical framework. Two Adaptive Mode
Crystal Heikin Ashi Signals
Muhammad Jawad Shabir
5 (5)
Crystal Heikin Ashi Signals—Professional Trend & Signal Detection Indicator Advanced Heikin Ashi Visualization with Intelligent Signal System for Manual & Automated Trading Final Price: $149 ---------> Price goes up $10 after every 10 sales . Limited slots available — act fast . Overview User Guide PDF Crystal Heikin Ashi Signals is a professional-grade MetaTrader 5 indicator that combines pure Heikin Ashi candle visualization with an advanced momentum-shift detection system. Designed for both m
Fx Levels Premium Indicator Support and Resistance are important concepts in trading. Fx Levels Premium was created to easily draw important levels of support and resistance for the active trader. The indicator will give you all important levels (support/resistance) to watch for a wide range of assets. Trading without these levels on your chart is like driving a car for a long journey without a roadmap. You would be confused and blind. Support and resistance levels should be used as guideline
OrderFlux – Orderflow Footprint Chart, Volume Profile & Market Profile Indicator for MetaTrader 5 OrderFlux is an order flow footprint indicator for MetaTrader 5 that explains itself. It opens the single candle and shows what happens inside it: the volume traded at every price level, split into aggressive buyers and aggressive sellers. From the ticks it builds a complete footprint chart in real time with delta, imbalance, absorption, volume profile, market profile (TPO), VWAP, cumulative delta (
Meridian Pro
Ottaviano De Cicco
4 (3)
Meridian Pro 2.00: Professional Multi-Timeframe Trend Matrix for MT5 Meridian Pro 2.00 is a professional adaptive trend matrix for MetaTrader 5. It combines the original Meridian trend engine, a clean chart ribbon, closed-bar signal arrows, an 8-timeframe dashboard, Fuel momentum, weighted consensus, synthetic HTF processing and chart-native higher-timeframe context lines. The goal is simple: read current trend, multi-timeframe structure, strength, momentum and EA-ready state from one discipline
Apollo SR Master is a Support/Resistance indicator with special features which make trading with Support/Resistance zones easier and more reliable. The indicator calculates Support/Resistance zones in real-time without any time lag by detecting local price tops and bottoms. Then to confirm the newly formed SR area, the indicator shows special signal which signalizes that the SR zone can be taken into consideration and used as an actual SELL or BUY signal. In this case the strength of the SR zone
Advanced Supply Demand MT5
Bernhard Schweigert
4.53 (15)
BLACK FRIDAY – 30% OFF Best Solution for any Newbie or Expert Trader! This indicator is a unique, high quality and affordable trading tool because we have incorporated a number of proprietary features and a new formula. With this update, you will be able to show double timeframe zones. You will not only be able to show a higher TF but to show both, the chart TF, PLUS the higher TF: SHOWING NESTED ZONES. All Supply Demand traders will love it. :) Important Information Revealed Maximize the pote
Neuro Poseidon MT5
Daria Rezueva
4.68 (53)
Neuro Poseidon is a new indicator by Daria Rezueva. It combines precise trading signals with adaptive TP/SL levels - creating best possible trades as a result! Message me and get  Neuro Poseidon Assistant  as a gift to automize your trading process! What makes it stand out? 1. Proven profitability on all assets and timeframes 2. Only confirmed BUY and SELL signals present on the chart 3. Adaptive TP & SL levels generated by the software for each trade 4. Easy to understand - suitable for al
Trend Lines PRO MT5
Roman Podpora
5 (1)
TREND LINES PRO    helps understand where the market is truly changing direction. The indicator shows real trend reversals and points where major players re-enter. You see   BOS lines   Trend changes and key levels on higher timeframes — without complex settings or unnecessary noise. Signals don't repaint and remain on the chart after the bar closes. VERSION MT 4     -     Reveals its maximum potential when paired with the   RFI LEVELS PRO  indicator What the indicator shows: Real shifts   tren
ARICoins
Temirlan Kdyrkhan
ARICoin is a powerful trading companion designed to generate high-probability entry signals with dynamic TP/SL/DP levels based on volatility. Built-in performance tracking shows win/loss stats, PP1/PP2 hits, and success rates all updated live. Key Features: Buy/Sell signals with adaptive volatility bands Real-time TP/SL/DP levels based on ATR Built-in MA Filter with optional ATR/StdDev volatility Performance stats panel (Success, Profit/Loss, PP1/PP2) Alerts via popup, sound, push, or email Cust
Bill Williams Advanced
Siarhei Vashchylka
5 (11)
Bill Williams Advanced is designed for automatic chart analysis using Bill Williams' "Profitunity" system. The indicator analyzes four timeframes at once. Manual (Be sure to read before purchasing) Advantages 1. Analyzes the chart using Bill Williams' "Profitunity" system. Signals are displayed in a table in the corner of the screen and on the price chart. 2. Finds all known AO and AC signals, as well as zone signals. Equipped with a trend filter based on the Alligator. 3. Finds "Divergence Bar
Precision Spike Detector
Francisco Mandomo Simbine
5 (2)
Precision Spike Detector V3 – Institutional-Grade AI Trading System Attention: The price increases by US$50 for every 10 purchases.  Final price: US$599 Precision Spike Detector V3   is a   state-of-the-art, institutional-grade market analysis system   for   MetaTrader 5 , designed to detect   high-probability market movements   in synthetic indices such as   Boom, Crash, GainX, and PainX . After purchase, send me a private message to receive the optimized configuration files,  the installation
Murrey Math Classic
Sarvarbek Abduvoxobov
5 (2)
Murrey Math Classic Murrey Math Classic is a professional and dynamic trading indicator designed to predict price movements in financial markets with mathematical precision. The system modernizes legendary price-time geometry, transforming it into a highly structured mathematical model suitable for modern financial markets. The core logic behind Murrey Math is that financial markets do not move randomly; they move in a specific rhythm. Just like music is divided into 8 notes of an octave, any gi
This dashboard shows the latest available   harmonic patterns   for the selected symbols, so you will save time and be more efficient /   MT4 version . Free Indicator:   Basic Harmonic Pattern Comparison of "Basic Harmonic Pattern" vs. "Basic Harmonic Patterns Dashboard" Indicators Feature Basic Harmonic Pattern Basic Harmonic Patterns Dashboard Functionality Detects and displays harmonic patterns on a single chart Searches multiple symbols and timeframes for harmonic patterns, displays res
More from author
Fabii Half Trend Baseline
Fabien Georges Andre Guillemaud
Stop trading against the higher timeframe trend. Two baselines, one chart. No repaint. Any pair, any timeframe. On your chart in 2 minutes. Free demo in the Strategy Tester. Get more indicators here Baselines, volatility filters and oscillators. No repaint. Why you need it You enter a trade because a line turned green on your chart. Then you open a higher timeframe and see that the bigger trend points the other way. The signal was real. The trend behind it was not on your side. Every trade ta
Fabii Adaptive Trend Baseline
Fabien Georges Andre Guillemaud
Stay in the trend with a baseline that slows down in noise and speeds up in moves. Five adaptive averages. No repaint. Any pair, any market, any timeframe. Free demo in the Strategy Tester. Get more indicators here Baselines, volatility filters and oscillators. No repaint. Why you need it A fixed-speed average lags in a strong move and jumps around in noise. You enter late, or you enter on a small swing. Neither entry matches the market you are trading. Every late or noisy entry costs you a s
FREE
Fabii Ehlers Trend Baseline
Fabien Georges Andre Guillemaud
Read the trend on a smoother line with fewer small wiggles. Five signal-processing filters, one chart. No repaint. Any pair, any market, any timeframe. Free demo in the Strategy Tester. Get more indicators here Baselines, volatility filters and oscillators. No repaint. Why you need it A noisy line flips on every small swing. You see a new signal, you enter, and the move reverses. Each false flip costs you a stop loss. What you get Fabii Ehlers Trend Baseline is a baseline indicator with five
FREE
Fabii Essential Trend Baseline
Fabien Georges Andre Guillemaud
Stop entering trend flips that have no momentum behind them. One line, one chart, no second indicator. No repaint. Any pair, any market, any timeframe. On your chart in 2 minutes. Free to test in the Strategy Tester. Get more indicators here Baselines, volatility filters and oscillators. No repaint. Why you need it You enter because the line turned green. Price drifts for ten bars, then reverses. The signal was real, but the momentum was not. Every entry on a weak flip costs you a stop loss.
FREE
Fabii NNFX Atr Levels
Fabien Georges Andre Guillemaud
Plan every trade with one click: Entry, Take Profit and Stop Loss drawn for you. No repaint. Any pair, any timeframe. On your chart in 2 minutes. Free to test in the Strategy Tester. Get more indicators here Baselines, volatility filters and oscillators. No repaint. Why you need it You plan an Average True Range (ATR) trade by hand. You read the ATR, multiply it, convert it to price, then calculate the lot size. Each step can add an error, and the numbers are different on every trade. A mispl
FREE
Fabii Supertrend NMA
Fabien Georges Andre Guillemaud
Hold the trend through range noise with a SuperTrend on an adaptive center. No repaint. Any pair, any timeframe. On your chart in 2 minutes. Free to test in the Strategy Tester. Get more indicators here Baselines, volatility filters and oscillators. No repaint. Why you need it You enter because the SuperTrend flipped. Price moves sideways for a few bars, the line flips back, and you are out of the trade or you skip the next signal. The classic SuperTrend is centered on median price, so each w
FREE
Fabii Volatility ATR Percentile
Fabien Georges Andre Guillemaud
See if Average True Range (ATR) volatility is quiet or stretched, as a 0 to 100 rank. No repaint. Any pair, any timeframe. On your chart in 2 minutes. Free demo in the Strategy Tester. Get more indicators here Baselines, volatility filters and oscillators. No repaint. Why you need it A raw ATR value such as 0.0040 tells you little. Is that high for this pair right now, or normal? To know, you have to scroll back through weeks of bars and guess. So you enter a trade in a market that is asleep,
FREE
Fabii Atr Volatility Zones
Fabien Georges Andre Guillemaud
See if each candle's volatility is low, medium or high for this market, in three colors. No repaint. Any pair, any timeframe, any market. On your chart in 2 minutes. Free to test in the Strategy Tester. Get more indicators here Baselines, volatility filters and oscillators. No repaint. Why you need it The same range means different things on different markets and at different times. You look at the last candle and cannot tell if its range is large or small for this market right now. Fixed Ave
FREE
Fabii Vwap SSL Baseline
Fabien Georges Andre Guillemaud
Stop guessing which VWAP cross matters: one coloured line shows your side. No repaint. Any pair. Daily, weekly or monthly anchor. On your chart in 2 minutes. Free to test in the Strategy Tester. Get more indicators here Baselines, volatility filters and oscillators. No repaint. Why you need it Most traders read the Volume Weighted Average Price (VWAP) as a single line and argue about every touch. This baseline gives a clear side instead: green when buyers hold the period, red when sellers do.
FREE
Fabii Volatility Bias
Fabien Georges Andre Guillemaud
Spot which side, up or down, drives volatility in one zero-centered histogram. No repaint. Any market, any timeframe. On your chart in 2 minutes. Free demo in the Strategy Tester. Get more indicators here Baselines, volatility filters and oscillators. No repaint. Why you need it A move looks strong: green candles, price climbing. But you cannot tell if real upward volatility carries it, or if it creeps up in small steps while the larger swings point down. A normal volatility reading shows how
Fabii Rsx Ema Oscillator
Fabien Georges Andre Guillemaud
Stop guessing when momentum turns: a smooth RSX line and a signal cross show you. No repaint. Any pair, any timeframe. On your chart in 2 minutes. Free demo in the Strategy Tester. Get more indicators here Baselines, volatility filters and oscillators. No repaint. Why you need it You watch a momentum oscillator and every touch of its signal line looks like a turn. The line jumps from candle to candle, the histogram flips color on small moves, and you are left deciding which cross matters. You
Fabii Kaufman Efficiency Ratio
Fabien Georges Andre Guillemaud
See at a glance whether price is trending or just moving in noise, on one line from 0 to 1. No repaint. Any pair, any timeframe. On your chart in 2 minutes. Free demo in the Strategy Tester. Get more indicators here Baselines, volatility filters and oscillators. No repaint. Why you need it You see a clean move on the chart and you enter. A few bars later price stalls, drifts sideways and takes you out. The move looked like a trend, but most of it was back and forth. Direction alone does not t
FREE
Fabii Memory Baseline
Fabien Georges Andre Guillemaud
Read the trend and its higher timeframe on one chart, with a line that holds its level. No repaint. Any pair, any timeframe. On your chart in 2 minutes. Free demo in the Strategy Tester. Get more indicators here Baselines, volatility filters and oscillators. No repaint. Why you need it A plain moving average falls behind price. After a strong move, the line stays far from price and gives you a level that no longer matters. To check the higher timeframe, you switch charts and lose the picture
FREE
Fabii Adxvma Ssl Channel
Fabien Georges Andre Guillemaud
One clean trend line that follows the lows while the trend holds, and flips above price only when the move truly turns. No repaint. Any pair, any timeframe. Every flip is final on bar close. Try it free on your own charts in the Strategy Tester. >> Get more free indicators here Baseline, volatility, oscillators & more — free and premium. No repainting. No guessing. Just clean signals. THE PROBLEM Most trend lines flip too early. A classic SSL channel rides two simple moving averages,
FREE
Fabii Yang Zhang Volatility Filter
Fabien Georges Andre Guillemaud
Know when volatility is enough to trade — live, no repaint, on any pair. Any pair, any timeframe. Lines lock on bar close. Free demo in the Strategy Tester. >> Get more free and premium indicators here Baseline, volatility, oscillators and more. No repainting. No guessing. Just clean signals. THE PROBLEM Your entry can be right and still go nowhere. When the market is quiet, price drifts, stops get tagged by noise and targets take forever. Every bar you trade in a quiet market is a tra
Fabii Coral Trend
Fabien Georges Andre Guillemaud
Know your trend bias on two timeframes at once — no repaint, signals final on bar close. Any pair, any timeframe, any market. Free demo in the Strategy Tester. >> Get more free and premium indicators here Baseline, volatility, oscillators & more. No repainting. No guessing. Just clean signals. THE PROBLEM You know the chart-timeframe trend. But you do not know whether the higher timeframe agrees — until you flip to it, then flip back, and the moment is gone. Entering with the short-t
FREE
Fabii Nma Ssl Channel
Fabien Georges Andre Guillemaud
Get a clear trend line that holds in trends and stays quiet in noise — no repaint. Any pair, any timeframe. Signals lock on bar close. Free to download. Test it in the Strategy Tester before using it live. >> Get more free indicators here Baseline, volatility, oscillators & more — free and premium. No repainting. No guessing. Just clean signals. THE PROBLEM Most SSL channels use a fixed-speed moving average. That means the line reacts the same whether price is trending hard or grindin
FREE
Fabii Ehlers Adaptive Bands
Fabien Georges Andre Guillemaud
Know exactly when the trend flips — before you miss the move. Signals lock on bar close, no repaint. Any pair, any timeframe. Free demo in the Strategy Tester. THE PROBLEM Most trend tools give you a direction — but they keep repainting until the bar closes, or they lag so far behind that the entry is gone by the time they confirm. You end up either chasing or sitting out clean moves. Every bar you misread the regime is a trade you size wrong or skip entirely. THE SOLUTION Fabi
FREE
Fabii Volatility Acceleration Index
Fabien Georges Andre Guillemaud
See at a glance when volatility is speeding up before a move — and when it is fading into a dead market. Any pair, any timeframe. No repaint — signals are final on bar close. Try it free in the Strategy Tester before you buy. THE PROBLEM Most volatility tools tell you how big the range is right now. They do not tell you the one thing that matters for timing: is volatility accelerating or slowing down? You end up entering just as a move runs out of steam, or sitting out while a breakout
FREE
Fabii Adxvma Ssl Pro
Fabien Georges Andre Guillemaud
One adaptive SSL trend line that only flips when the move is real, plus a second SSL baseline from a higher timeframe on the same chart, Buy/Sell arrows, and an ATR filter that blocks weak signals before they reach you. No repaint. Try the free version first: Fabii Adxvma Ssl Channel. THE PROBLEM A classic SSL channel flips on every small push. Even the adaptive ADXVMA version flips too often in choppy markets, fires arrows on signals that reverse the next bar, and shows you only one ti
Fabii Nma Ssl Pro
Fabien Georges Andre Guillemaud
Know the trend direction before you enter — adaptive SSL line with an ATR filter that blocks weak flips. No repaint. Any pair, any timeframe. Signals lock on bar close. Test it free in the Strategy Tester before buying. THE PROBLEM Standard SSL channels flip at every small push against the trend. You take the signal, price reverses immediately, and you stop out. Tighten the filter, you miss real moves. Loosen it, you drown in noise. And watching one timeframe only, you never know whethe
Fabii Responsive Trend Baseline
Fabien Georges Andre Guillemaud
Spot trend flips sooner with a low-lag baseline. Five fast averages, one chart, no second indicator. No repaint. Any pair, any market, any timeframe. Free demo in the Strategy Tester. Get more indicators here Baselines, volatility filters and oscillators. No repaint. Why you need it A slow average confirms the trend after the move is already underway. You see the flip late and you enter late. Every late entry costs you a worse price and a wider stop loss. What you get Fabii Responsive Trend B
Fabii Htf Po3 Candle Projection
Fabien Georges Andre Guillemaud
See the higher timeframe candle form next to price, with a countdown to its close. No repaint. Any symbol. On your chart in 2 minutes. Free to test in the Strategy Tester. Get more indicators here Baselines, volatility filters and oscillators. No repaint. Why you need it You trade on M5 or M15, but the daily candle sets the frame for the day. To see where it opened, how far it has stretched and how long it has left, you switch to another chart or open a second window. Each switch takes your e
Fabii Memory Distance Oscillator
Fabien Georges Andre Guillemaud
See how far price has stretched from its baseline, and when it starts to pull back. One histogram, one read. No repaint. Any pair, any timeframe, any market. On your chart in 2 minutes, free. Get more indicators here Baselines, volatility filters and oscillators. No repaint. Why you need it You see a strong move and you want in. Price is already far from its average, you enter late, and the market pulls back right after. Or you wait for a pullback and cannot tell a pause from the end of the t
Fabii Memory Support Resistance
Fabien Georges Andre Guillemaud
Stop guessing which support and resistance zones matter: each one shows how many times price tested it. No repaint. Any pair, any timeframe. On your chart in 2 minutes. Free to test in the Strategy Tester. Get more indicators here Baselines, volatility filters and oscillators. No repaint. Why you need it You draw support and resistance by hand, and two traders never draw the same levels on the same chart. You do not know which levels deserve your attention. You place a stop behind a level tha
Fabii Confluence Oscillator
Fabien Georges Andre Guillemaud
Stop counting signals by eye: seven classic indicators vote in one score from -100 to +100. No repaint. Any pair, any timeframe. On your chart in 2 minutes. Free to test in the Strategy Tester. Get more indicators here Baselines, volatility filters and oscillators. No repaint. Why you need it You stack several indicators in sub-windows and count their signals by eye. One turns up, another is flat, a third points the other way. You enter on a majority that was only one vote deep, price drifts
Fabii Elder Market Thermometer
Fabien Georges Andre Guillemaud
See when a quiet market wakes up. A Market Thermometer with wake-up alerts and five averages. No repaint. Any pair, any timeframe. On your chart in 2 minutes. Free to test in the Strategy Tester. Get more indicators here Baselines, volatility filters and oscillators. No repaint. Why you need it You take a trade, price barely moves, and the setup fades in a market that was asleep. The market had no energy to follow your signal. A quiet market costs you time and spread. What you get Fabii Elder
Fabii Metro Step RSI
Fabien Georges Andre Guillemaud
Stop entering on momentum swings that reverse one bar later. Two step lines, one chart. No repaint. Any pair, any timeframe. On your chart in 2 minutes. Free to test in the Strategy Tester. Get more indicators here Baselines, volatility filters and oscillators. No repaint. Why you need it You watch the Relative Strength Index (RSI) turn and you enter. A few bars later it reverses: the signal was only noise. The RSI moves with every candle, so a small swing looks like a new trend, and you pay
Fabii Half Trend Mtf Alignment
Fabien Georges Andre Guillemaud
See when three timeframes agree on trend direction, in one strip under your chart. No repaint. Any pair, any timeframe from M1 to W1. On your chart in 2 minutes. Free to test in the Strategy Tester. Get more indicators here Baselines, volatility filters and oscillators. No repaint. Why you need it You take a trade on one timeframe, then find the higher timeframe pointed the other way. Checking means switching charts, and in a fast market you skip it. Entries against the higher trend are the o
Filter:
No reviews
Reply to review