Fabii NNFX Atr Levels
- Indicators
-
Fabien Georges Andre Guillemaud
 I develop custom indicators and trading tools for MetaTrader 5.
- Version: 1.10
- Updated: 1 September 2026
- Activations: 20
Plan every trade with one click: Entry, Take Profit and Stop Loss drawn for you. No repaint.
Any pair, any timeframe. On your chart in 2 minutes. Free to test in the Strategy Tester.
Get more indicators here
Baselines, volatility filters and oscillators. No repaint.
Why you need it
You plan an Average True Range (ATR) trade by hand. You read the ATR, multiply it, convert it to price, then calculate the lot size. Each step can add an error, and the numbers are different on every trade.
A misplaced stop loss or a wrong lot size costs you more than the minutes you saved by rushing.
What you get
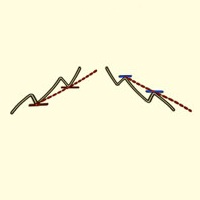
Fabii NNFX Atr Levels draws your whole trade plan on the chart, so you do not calculate the levels by hand.
- Click any candle and get the Entry, Take Profit and Stop Loss lines, so you have a full plan in one click.
- Two independent ATR settings, one for Take Profit and one for Stop Loss, so you control each distance separately.
- Lot size from your risk percentage, shown as LOT in the corner, so you know your position size before you enter.
- Labels in price or in pips from the entry, so you read each level in the unit you prefer.
- Works on any pair, any market and any timeframe, so one tool covers all your charts.
How it works
The indicator reads the standard MetaTrader 5 ATR. The Entry is the close of the candle you click. The Take Profit distance is the ATR of the Take Profit period multiplied by its multiplier, and the Stop Loss distance is the ATR of the Stop Loss period multiplied by its multiplier. The two ATR values are independent. The lot size is calculated from your risk percentage, your account balance and the Stop Loss distance. If you click in the empty space to the right of the last candle, the live mode places the Entry on the current price as you move the mouse.
How to use it
- Attach the indicator to any chart.
- Set the ATR periods, the multipliers and Risk per trade (%) for your plan.
- Click a candle to see the buy levels. Click the same candle again to switch to sell, and a third time to clear the lines.
- Read the lot size in the corner, then place your order as usual.
Key settings
| Setting | What it does | Default |
|---|---|---|
| TP ATR Period | ATR period used for the Take Profit distance | 14 |
| TP Multiplier | Multiplier applied to the Take Profit ATR | 1.0 |
| SL ATR Period | ATR period used for the Stop Loss distance | 14 |
| SL Multiplier | Multiplier applied to the Stop Loss ATR | 1.5 |
| Risk per trade (%) | Percentage of your account balance risked on each trade, used for the lot size | 1.0 |
| TP/SL Label | Shows the Take Profit and Stop Loss labels as Price or as Pips from the entry | Price |
| Show Lot Size | Shows or hides the lot size in the corner | true |
| Max Bars to Calculate | Maximum number of bars calculated on the chart | 5000 |
Other settings control colors, line widths, fonts and display options.
Test it before you decide
No repaint: click a closed candle and note the levels, then click the same candle again after a few new bars. The distances are the same. To test it: open the Strategy Tester, select this indicator and run it in visual mode on your pair and timeframe.
Updates are free and included. Every release is listed in the What's new section of this page, so you always know what changed.
More Fabii indicators are in preparation. Follow my profile to be notified when they are published.
Get it and see your first levels on your own chart.
Comments and reviews
Questions? Post a comment on this page or message me and you get an answer within 24 hours.
If this saves you time, a short review that says which pair and timeframe you use helps other traders find it. Even one line is enough.
Past results do not predict future results. This indicator does not provide financial advice.