Session Volume Profile Value Area MT5
- Indicators
-
Prime Horizon
 MT5 and MT4 developer. Market structure, Smart Money Concepts and risk management tools.
 - Version: 1.0
Session Volume Profile Value Area shows you where the market actually traded during the current session - not just where price went. It builds a horizontal volume profile directly on your chart and marks the three levels traders watch: the POC, the VAH and the VAL.
Most charts only show price. Volume Profile adds the missing dimension: how much was traded at each price. Prices where a lot of volume changed hands are areas the market accepted; prices it moved through quickly are areas it rejected.
What it draws
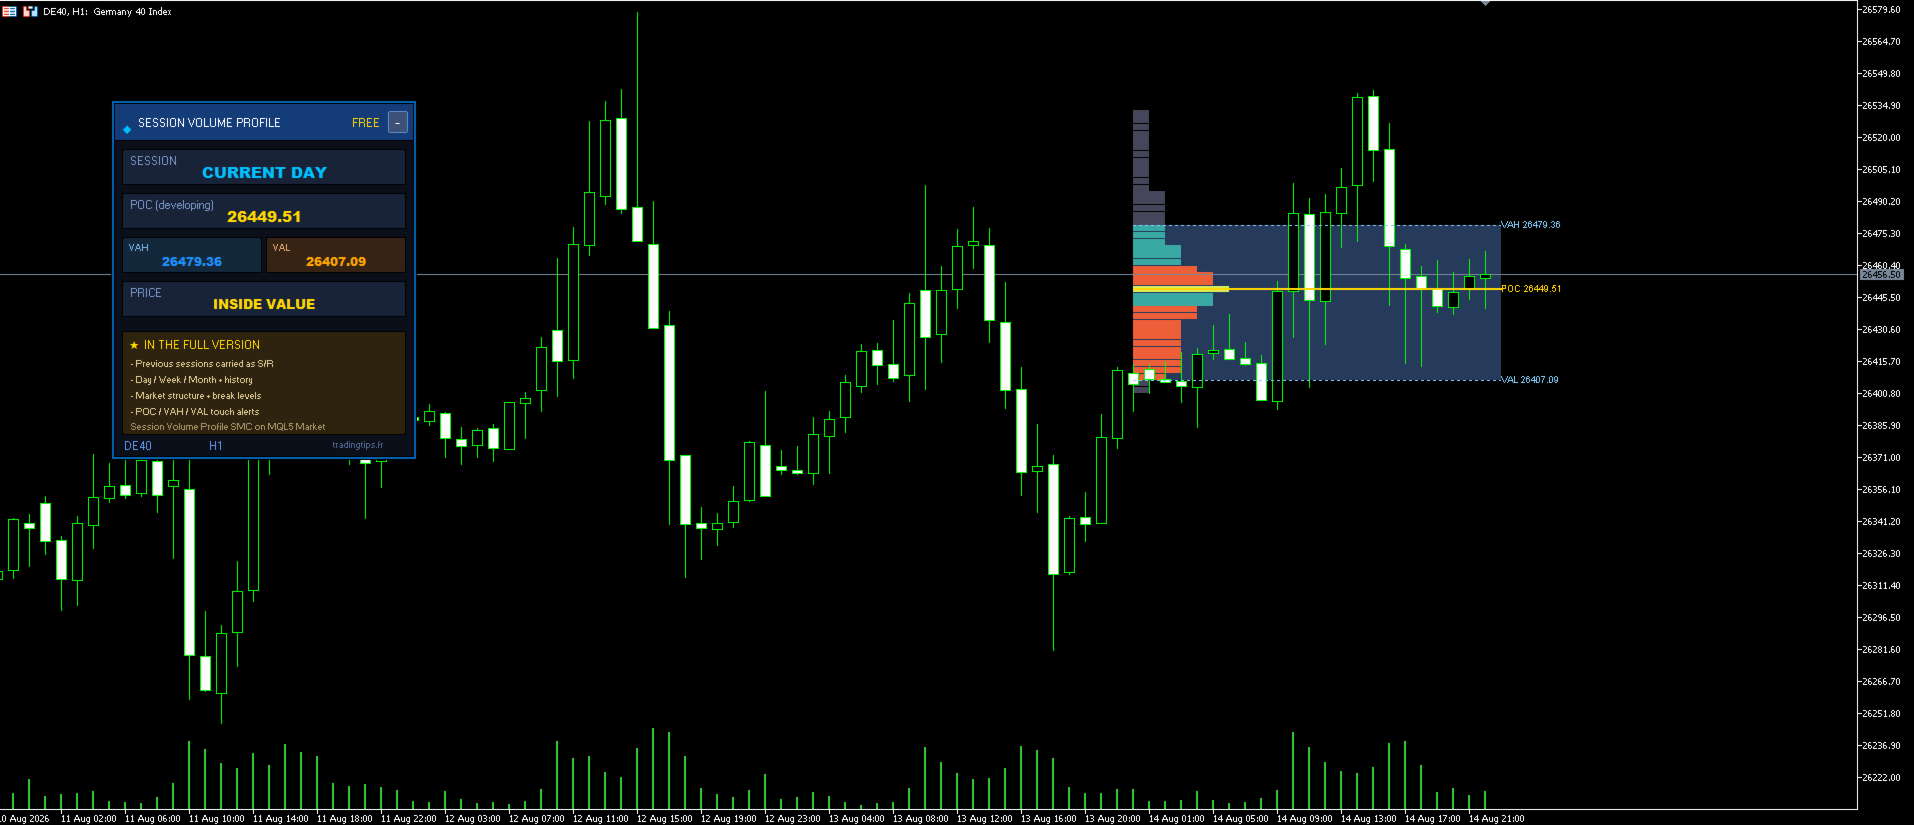
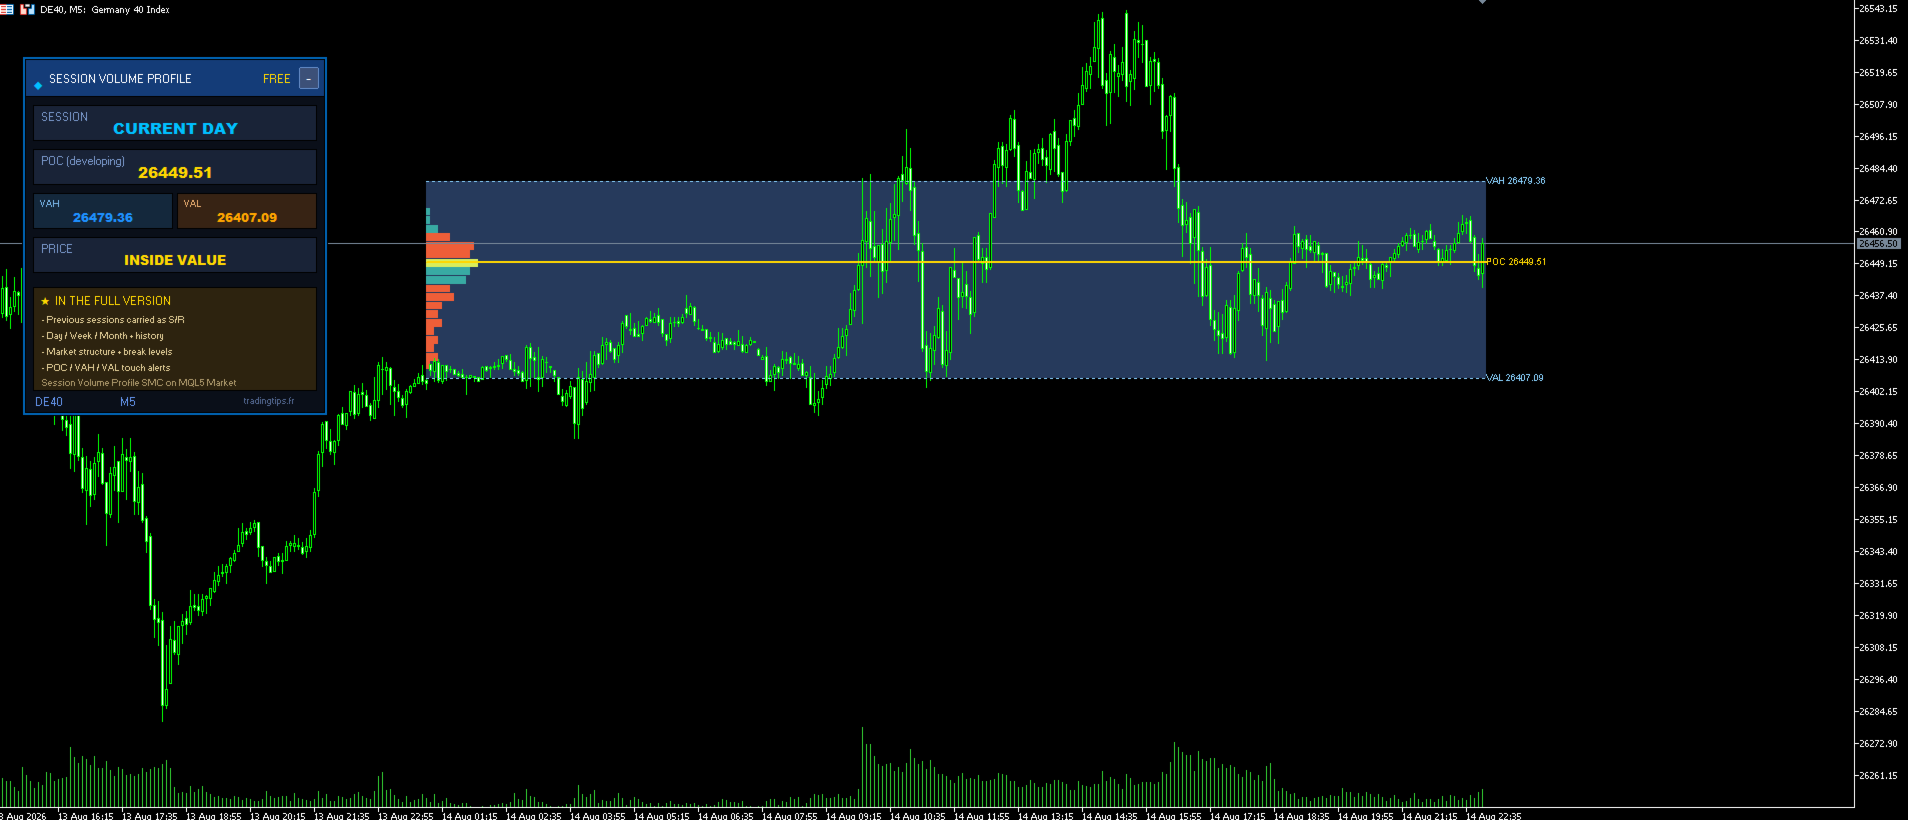
For the current session the indicator plots the full volume histogram, the POC (Point of Control - the most traded price of the session), the VAH and VAL (Value Area High and Low) and a shaded Value Area holding the bulk of the session volume - 70% by default, adjustable.
How to read it
The Value Area is where the session found agreement. Price inside it usually means balance; price leaving it means the market is testing higher or lower prices. The POC often acts as a magnet when price returns to it. The dashboard states this directly: ABOVE VALUE, INSIDE VALUE or BELOW VALUE, updated on every tick.
Main features
This edition profiles the current session only, so the levels it shows are still developing - they move as the session builds. A level becomes a fixed reference once its session has closed and is carried into the next one.
Session Volume Profile SMC MT5 adds exactly that: previous-session POC, VAH and VAL carried forward as support and resistance, Day / Week / Month periods with up to 24 sessions of history, HH / HL / LH / LL market structure with break levels, and touch alerts on POC, VAH and VAL.
https://www.mql5.com/en/market/product/182036
Getting started
Drag the indicator onto any chart and any symbol - the profile, the levels and the dashboard appear immediately. The defaults are ready to use.
Note
Educational and analysis tool. It places no orders and gives no buy or sell signals. Trading involves risk; the past behaviour of a level does not guarantee future results.
Most charts only show price. Volume Profile adds the missing dimension: how much was traded at each price. Prices where a lot of volume changed hands are areas the market accepted; prices it moved through quickly are areas it rejected.
What it draws
For the current session the indicator plots the full volume histogram, the POC (Point of Control - the most traded price of the session), the VAH and VAL (Value Area High and Low) and a shaded Value Area holding the bulk of the session volume - 70% by default, adjustable.
How to read it
The Value Area is where the session found agreement. Price inside it usually means balance; price leaving it means the market is testing higher or lower prices. The POC often acts as a magnet when price returns to it. The dashboard states this directly: ABOVE VALUE, INSIDE VALUE or BELOW VALUE, updated on every tick.
Main features
- Volume profile of the current session with POC, VAH, VAL and a shaded Value Area.
- Independent calculation timeframe - build the profile from M1, M5 or M15 data whatever the chart timeframe, so resolution stays fine on higher timeframes.
- Buyer / seller coloring inside the Value Area to see which side was in control.
- Draggable, collapsible dashboard - POC, VAH, VAL and price versus the Value Area at a glance, with DPI scaling.
- Works on every symbol and every timeframe - Forex, indices, metals, crypto - with tick or real volume.
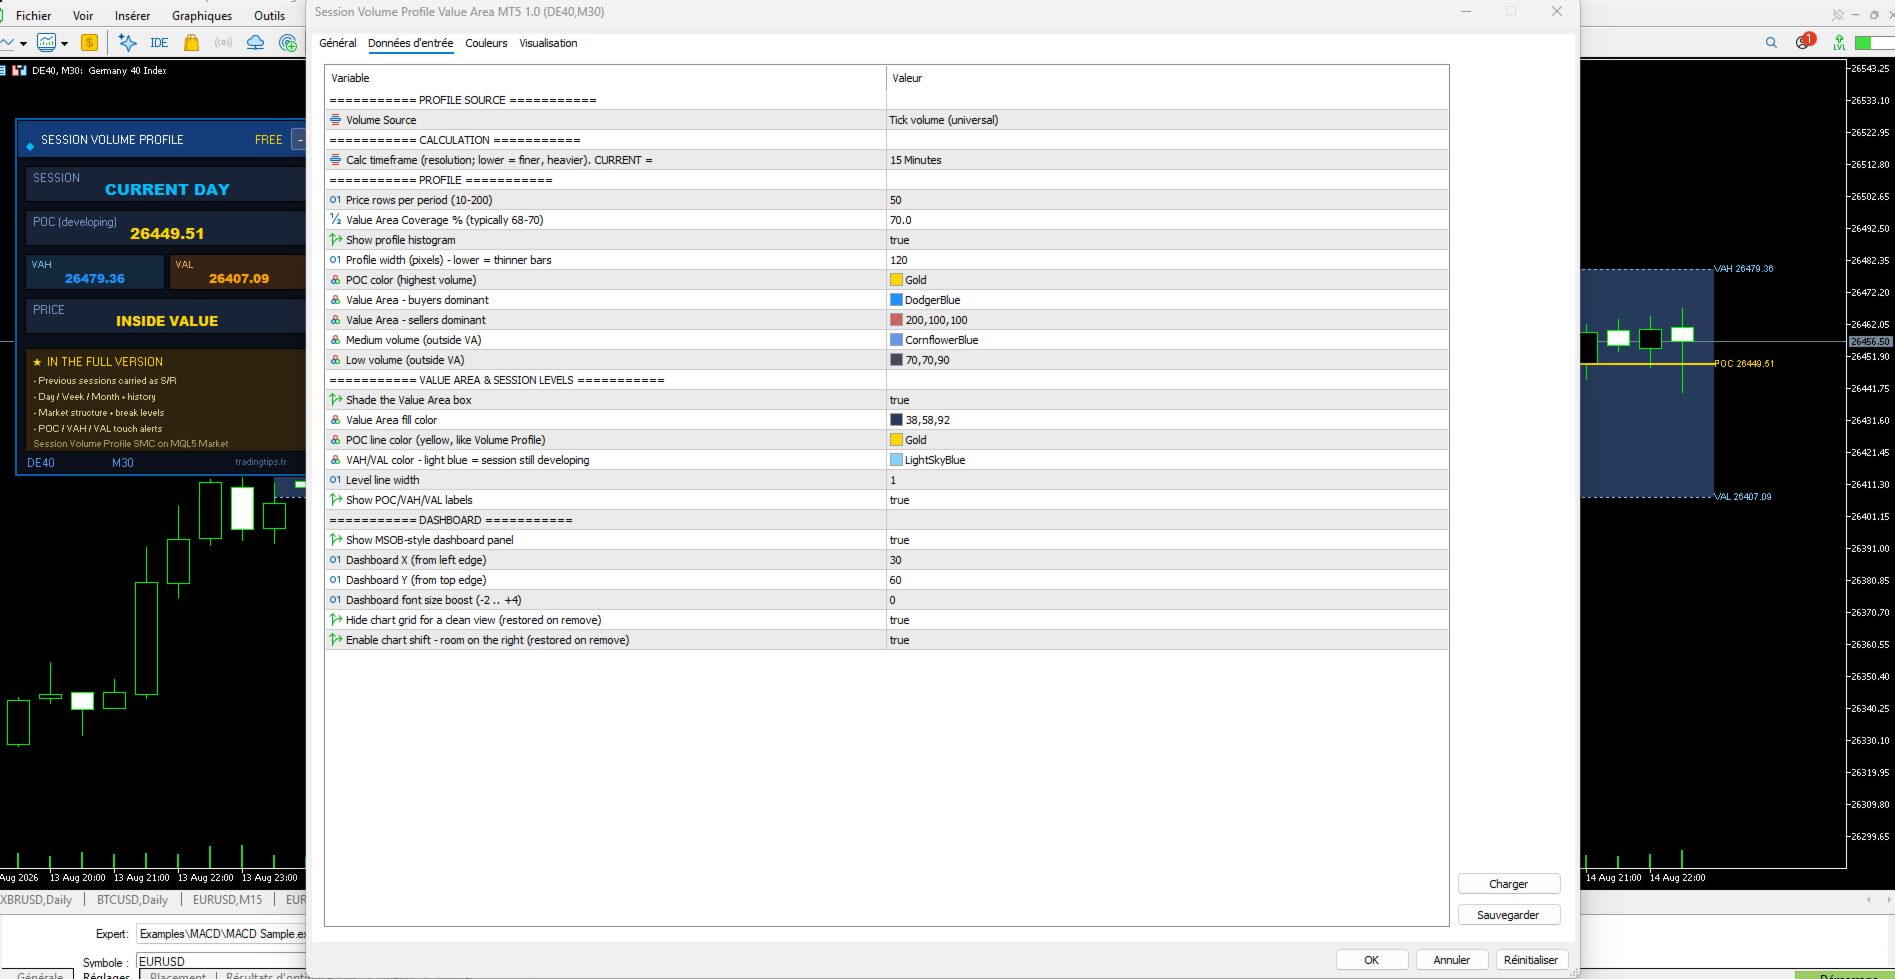
- Adjustable Value Area coverage, row count, profile width and colors.
- Calc timeframe - resolution of the data used to build the profile.
- Value Area Coverage % - share of volume held inside the Value Area (70% by default).
- Price rows and profile width - level of detail and on-screen width.
- Volume source - tick volume (universal) or real volume.
- Dashboard - position, font size, show or hide.
This edition profiles the current session only, so the levels it shows are still developing - they move as the session builds. A level becomes a fixed reference once its session has closed and is carried into the next one.
Session Volume Profile SMC MT5 adds exactly that: previous-session POC, VAH and VAL carried forward as support and resistance, Day / Week / Month periods with up to 24 sessions of history, HH / HL / LH / LL market structure with break levels, and touch alerts on POC, VAH and VAL.
https://www.mql5.com/en/market/product/182036
Getting started
Drag the indicator onto any chart and any symbol - the profile, the levels and the dashboard appear immediately. The defaults are ready to use.
Note
Educational and analysis tool. It places no orders and gives no buy or sell signals. Trading involves risk; the past behaviour of a level does not guarantee future results.