Session Volume Profile SMC MT4
- Indicators
-
Prime Horizon
 MT5 and MT4 developer. Market structure, Smart Money Concepts and risk management tools.
 - Version: 1.10
- Activations: 5
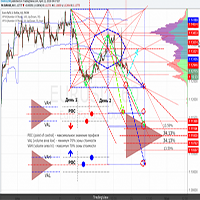
Session Volume Profile SMC shows you where the market actually traded - not just where price went. For every session (Day, Week or Month) it builds a horizontal volume profile directly on your chart, revealing the price levels that attracted the most activity and that price tends to respect later.
Most charts only show price. Volume Profile adds the missing dimension: how much was traded at each price. This indicator turns that into a clean, session-based read and layers a Smart Money Concepts (SMC) market-structure view on top, so volume and structure are visible in a single tool.
What it draws
For each session the indicator plots the full volume profile with the POC (Point of Control - the most traded price), the VAH and VAL (Value Area High and Low) and a shaded Value Area that holds the bulk of the session's volume. When a session closes, its POC, VAH and VAL are projected into the next session, where they frequently act as support and resistance - the levels left behind by order flow.
Volume and market structure in one view
On top of the profile, the indicator labels the market structure - Higher Highs, Higher Lows, Lower Highs and Lower Lows (HH / HL / LH / LL) - and tracks the break levels (Break of Structure). Levels that price has not broken yet are shown as dotted lines; levels already broken by a candle close are kept on the chart as solid lines. Reading a reaction at a previous POC together with a structure break gives context that price alone cannot.
Key features
Attach the indicator to any chart and symbol - the session profiles, levels, structure and dashboard appear immediately. Everything is configurable, and the defaults are ready to use.
Note
Educational and analytical tool. It does not place trades and does not send buy or sell signals. Trading involves risk; the past behaviour of any level does not guarantee future results.
Most charts only show price. Volume Profile adds the missing dimension: how much was traded at each price. This indicator turns that into a clean, session-based read and layers a Smart Money Concepts (SMC) market-structure view on top, so volume and structure are visible in a single tool.
What it draws
For each session the indicator plots the full volume profile with the POC (Point of Control - the most traded price), the VAH and VAL (Value Area High and Low) and a shaded Value Area that holds the bulk of the session's volume. When a session closes, its POC, VAH and VAL are projected into the next session, where they frequently act as support and resistance - the levels left behind by order flow.
Volume and market structure in one view
On top of the profile, the indicator labels the market structure - Higher Highs, Higher Lows, Lower Highs and Lower Lows (HH / HL / LH / LL) - and tracks the break levels (Break of Structure). Levels that price has not broken yet are shown as dotted lines; levels already broken by a candle close are kept on the chart as solid lines. Reading a reaction at a previous POC together with a structure break gives context that price alone cannot.
Key features
- One profile per session - Day, Week or Month, auto-selected from the chart timeframe, or set manually.
- POC, VAH, VAL and Value Area for every session, with adjustable Value Area coverage.
- Previous-session levels extended as dynamic support/resistance; weekend and holiday gaps are handled automatically.
- Independent calculation timeframe - build the profile from M1, M5 or M15 for a finer, accurate resolution on any chart timeframe.
- Market structure HH / HL / LH / LL labels (SMC).
- Break of Structure levels - pending (dotted) and confirmed (solid), kept across recent sessions.
- Buy / sell volume coloring inside the Value Area to show who was in control.
- Draggable, minimizable dashboard - session, POC, VAH/VAL, price versus Value Area, structure trend and pending levels at a glance.
- Works on all symbols and timeframes - Forex, indices, metals, crypto - with tick or real volume.
- Auto period - profile period follows the chart timeframe (Day / Week / Month); turn off to set it manually.
- Calc timeframe - data resolution used to build each profile.
- Periods to show - number of past sessions displayed.
- Value Area % - share of volume inside the Value Area (default 70%).
- Rows and width - profile detail and on-screen width.
- Show market structure / break lines / dashboard - independent toggles, colors and font size.
Attach the indicator to any chart and symbol - the session profiles, levels, structure and dashboard appear immediately. Everything is configurable, and the defaults are ready to use.
Note
Educational and analytical tool. It does not place trades and does not send buy or sell signals. Trading involves risk; the past behaviour of any level does not guarantee future results.