Double Top Bottom Head and Shoulders Levels MT5
- Indicators
-
Prime Horizon
 MT5 and MT4 developer. Market structure, Smart Money Concepts and risk management tools.
 - Version: 1.0
- Activations: 5
Double top, double bottom and head and shoulders indicator for MT5 with entry, stop and target levels
This MT5 indicator detects reversal chart patterns on closed bars: the double top and the double bottom (the M and W patterns), the head and shoulders and the inverse head and shoulders. Each pattern becomes three prices written on the chart: the entry on the neckline breakout, the stop and the measured target. A pattern is shown while it is still forming, is confirmed on a bar close, and each trade stays on the chart from the bar that triggered it to the bar that reached its exit. A dashboard gives the current setup, its levels, the last trade and a history of setups and trades, with alerts on confirmation.
User guide included: ask for it by message in the MQL5 chat.
What you see on the chart
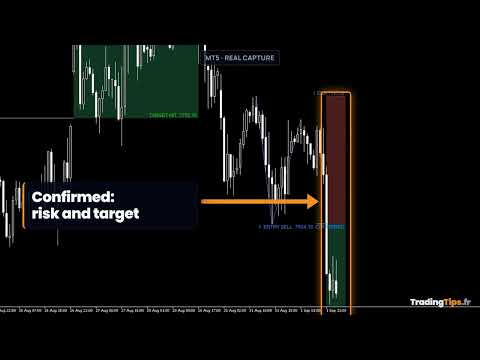
- ENTRY BUY or ENTRY SELL with its price, on the neckline. The label also says WAIT while nothing has happened, or CONFIRMED once a bar has closed beyond it.
- STOP and TARGET, each with its price and the number of its pattern, so that several patterns never mix.
- Trade areas: from the bar that triggers the trade, a red area between the entry and the stop and a green area between the entry and the target, drawn behind the candles.
- The outcome: once the trade ends, only the area of its outcome remains, up to the bar that touched the exit, with the verdict written on the chart: TARGET HIT, STOPPED OUT or FAILED BREAKOUT.
- Tooltips: resting the mouse on any line, area or outline tells what it is, its price, its pattern and where that pattern stands.
- Outline: thin lines through the pivots, so that the shape is easy to recognise.
How a pattern is followed
A pattern appears as soon as its last pivot is certain, together with the price that will confirm it. It is confirmed only when a bar closes beyond the neckline. While price has crossed the entry but the bar is still open, the panel says AWAITING BAR CLOSE.
Once a pattern is confirmed, the stop and the target are tested on the wick, like orders placed with a broker, and the panel shows TARGET TOUCHED or STOP TOUCHED as soon as the forming bar reaches them. A confirmed pattern whose price closes back on the other side of the entry, by a set share of the pattern height, ends as a failed breakout, before its stop.
The dashboard
The panel shows the current setup and its direction, its state, the entry, the stop with its distance in points, the target with its risk to reward ratio, the second pattern being watched, and how the last trade ended. It can be minimised and moved with the mouse.
The history section keeps setups and trades apart. A setup that never reached its entry is counted as no entry, not as a loss, because no trade was taken. Trades are counted as target hit, lost or running, and the lost ones are split between stops hit and failed breakouts. These are historical counts on the bars loaded, not a forecast and not a success rate. Below ten trades, the panel says that the sample is small.
Main settings
- Pivot strength: bars required on each side of a pivot. A higher value gives fewer and larger patterns.
- Peak symmetry tolerance: how different the two peaks may be, as a share of the pattern height, so that it behaves the same on any symbol.
- Maximum pattern width and height in ATR: filter out shapes that are too wide, too small or too tall to be traded.
- Stop and target: the stop as a share of the pattern height, the target as a multiple of it. The defaults give the classic measured move, a 1 to 1 ratio.
- Head and shoulders: on or off. Patterns shown: how many live patterns are drawn at once.
- Alerts: on confirmation, and optionally when a pattern starts waiting. Popup, sound, push notification and email are separate switches.
- Chart layout: the grid is hidden and the chart is shifted from the right edge while the indicator is on the chart. Both settings are given back when it is removed, and each can be switched off.
For automated trading
Two buffers are available through iCustom: buffer 0 carries the entry price of a confirmed bearish pattern, buffer 1 the entry price of a confirmed bullish pattern. A value is written only on the bar that closed the confirmation and is never rewritten. A program that reads the indicator this way keeps its own chart layout.
Good to know
- Works on any symbol and any timeframe. Tested on forex pairs, gold and a US stock index. Prices follow the digits of the symbol.
- Closed bars only: a pattern, a confirmation or a verdict does not move once it is displayed.
- Several copies can run on the same chart with different settings.
- No DLL, no external file, no internet connection.
- The demo runs in the Strategy Tester. In visual mode, patterns are drawn bar by bar as they become known, which shows that nothing is placed afterwards.
What it does not do
This indicator does not open, modify or close orders. BUY and SELL on a level name the direction of the chart pattern itself, which is part of its definition, not a recommendation: a double top is a bearish figure whether anyone trades it or not. Whether a setup fits your plan, what size to use and what risk to accept remain your decision.
Risk warning: trading on financial markets involves a risk of loss that may exceed your initial deposit. Past behaviour of a chart pattern does not indicate future results. This indicator is an analysis tool, not investment advice.