RSI Heatmap MT4
- Indicators
-
Agus Santoso
 DISCLAIMER ON : The author of EA will not be held responsible for your losses or problems of any kind if the EA is directly or indirectly responsible for any losses.
Our software is provided “as is”, without any warranty or condition of any kind, express, implied or statutory. - Version: 1.0
- Activations: 5
MQL5 Blogs : https://www.mql5.com/en/blogs/post/772494
MT4 Version : https://www.mql5.com/en/market/product/185408
MT5 Version : https://www.mql5.com/en/market/product/185407
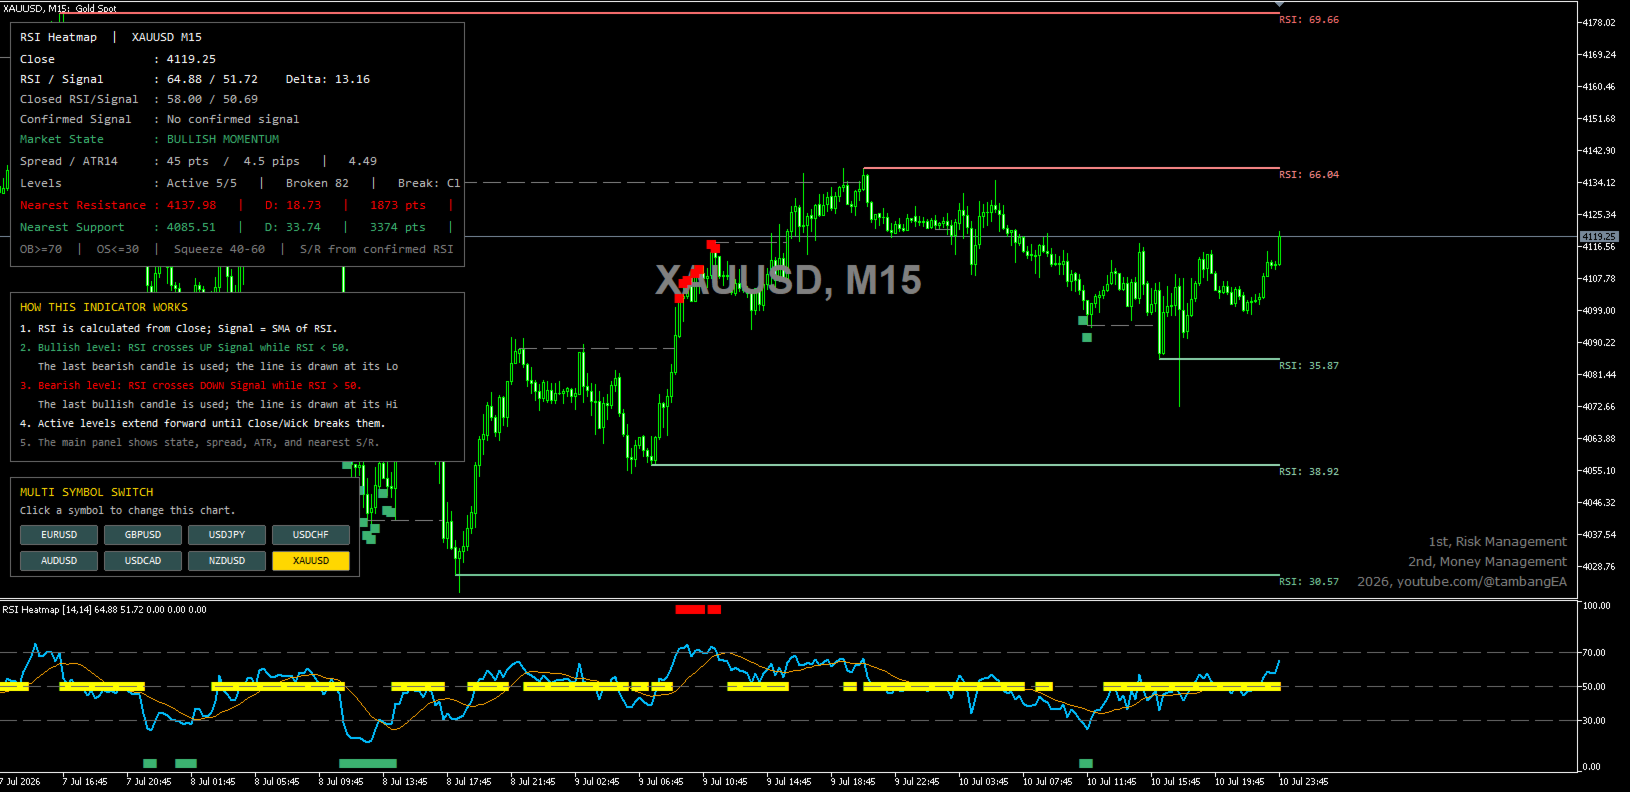
RSI HEATMAP [tambangEA] is a professional momentum and market-structure indicator that combines the Relative Strength Index, an RSI signal line, confirmed crossover logic, dynamic support and resistance levels, real-time market information, and fast multi-symbol chart navigation.
The indicator is designed to help traders understand momentum direction, identify important reaction levels, monitor volatility and trading costs, and quickly switch between selected symbols without manually reopening charts.
It is suitable for Forex, Gold, indices, commodities, and other instruments supported by MetaTrader.
Main Features
RSI oscillator with an SMA-based signal line
Confirmed RSI crossover detection
Dynamic bullish support levels
Dynamic bearish resistance levels
Nearest support and resistance calculation
Overbought, oversold, and squeeze visualization
Bullish and bearish confirmation markers
Real-time dashboard
Current and closed-candle RSI information
Spread and ATR monitoring
Active and broken level statistics
Close-based or wick-based level invalidation
Multi-symbol chart switch panel
Automatic preservation of the current timeframe when changing symbols
Customizable symbol list
Forex and XAU/GOLD point and pip normalization
Dark chart-compatible interface
Consolas dashboard font for clear numerical alignment
How the Indicator Works
RSI and Signal Line
The indicator calculates the standard RSI from closing prices.
The signal line is calculated as a Simple Moving Average of the RSI values.
This combination helps identify changes in momentum more clearly than using a single RSI line alone.
Bullish Level Logic
A bullish condition is confirmed when:
RSI crosses above its signal line
RSI remains below the 50 level at the time of the crossover
The crossover occurs on a completed candle
After confirmation, the indicator searches backward for the latest bearish candle within the configured lookback range.
The low of that bearish candle is used as a dynamic bullish support level.
The level extends forward until it is invalidated by the selected break condition.
Bearish Level Logic
A bearish condition is confirmed when:
RSI crosses below its signal line
RSI remains above the 50 level at the time of the crossover
The crossover occurs on a completed candle
After confirmation, the indicator searches backward for the latest bullish candle within the configured lookback range.
The high of that bullish candle is used as a dynamic bearish resistance level.
The level extends forward until it is invalidated by the selected break condition.
Break Logic
The indicator supports two level invalidation methods.
Close Break
A support or resistance level is considered broken only when a candle closes beyond the level.
This method helps reduce false invalidation caused by temporary wick penetration.
Wick Break
A level is considered broken as soon as the candle high or low crosses the level.
This method reacts faster but may produce more frequent level invalidation during volatile market conditions.
RSI Heatmap and Reference Zones
The RSI subwindow displays the RSI line, signal line, and momentum reference zones.
Overbought Zone
RSI greater than or equal to 70 indicates an overbought condition.
An overbought reading does not automatically mean that the market must reverse. During strong bullish trends, RSI may remain overbought for an extended period.
Oversold Zone
RSI less than or equal to 30 indicates an oversold condition.
An oversold reading does not automatically mean that the market must rise. During strong bearish trends, RSI may remain oversold for an extended period.
Midline Squeeze Zone
RSI between 40 and 60 represents a neutral or compressed momentum condition.
This area may indicate:
consolidation,
accumulation,
distribution,
reduced momentum,
or preparation for a new directional move.