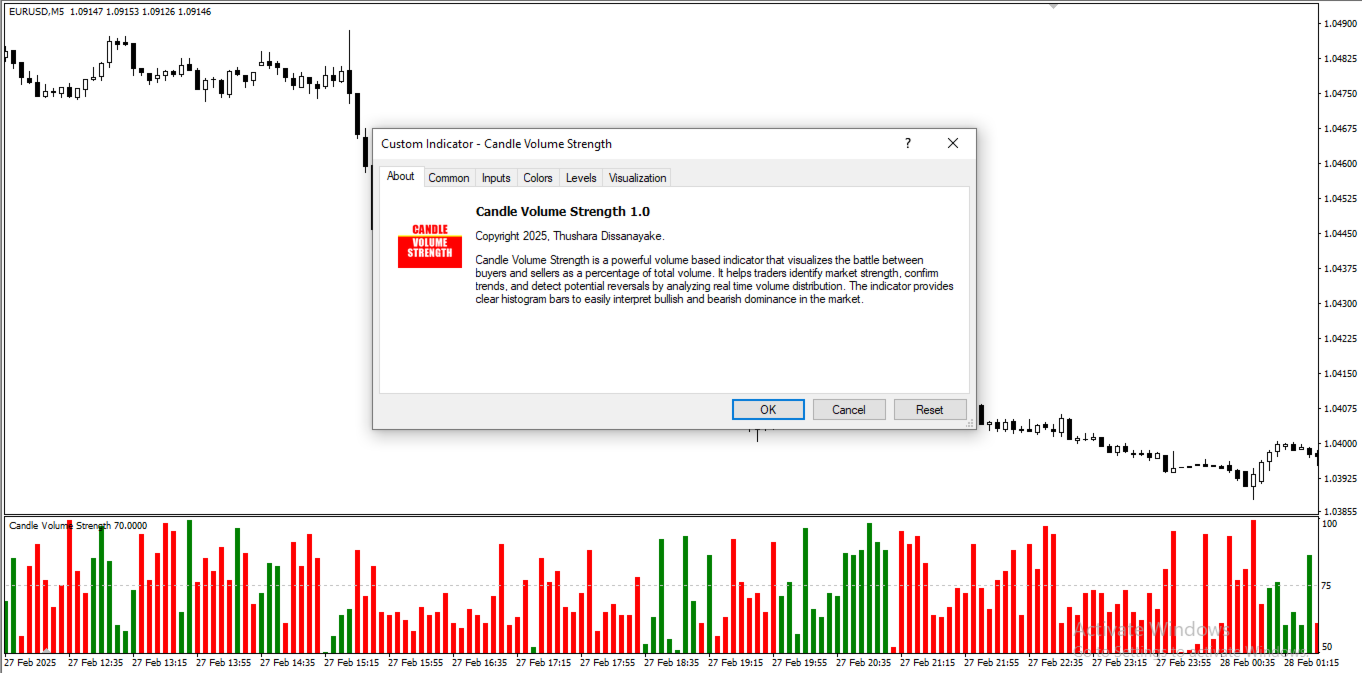
Candle Volume Strength
- Indicators
-
Thushara Dissanayake
 I’ve always loved exploring new trading strategies, testing them with indicators, and automating them with expert advisors (EAs). Welcome to my world of Forex Trading Robots, Indicators, and Trading Tools, all specially built for the MetaTrader platform.
 - Version: 1.0
- Activations: 5
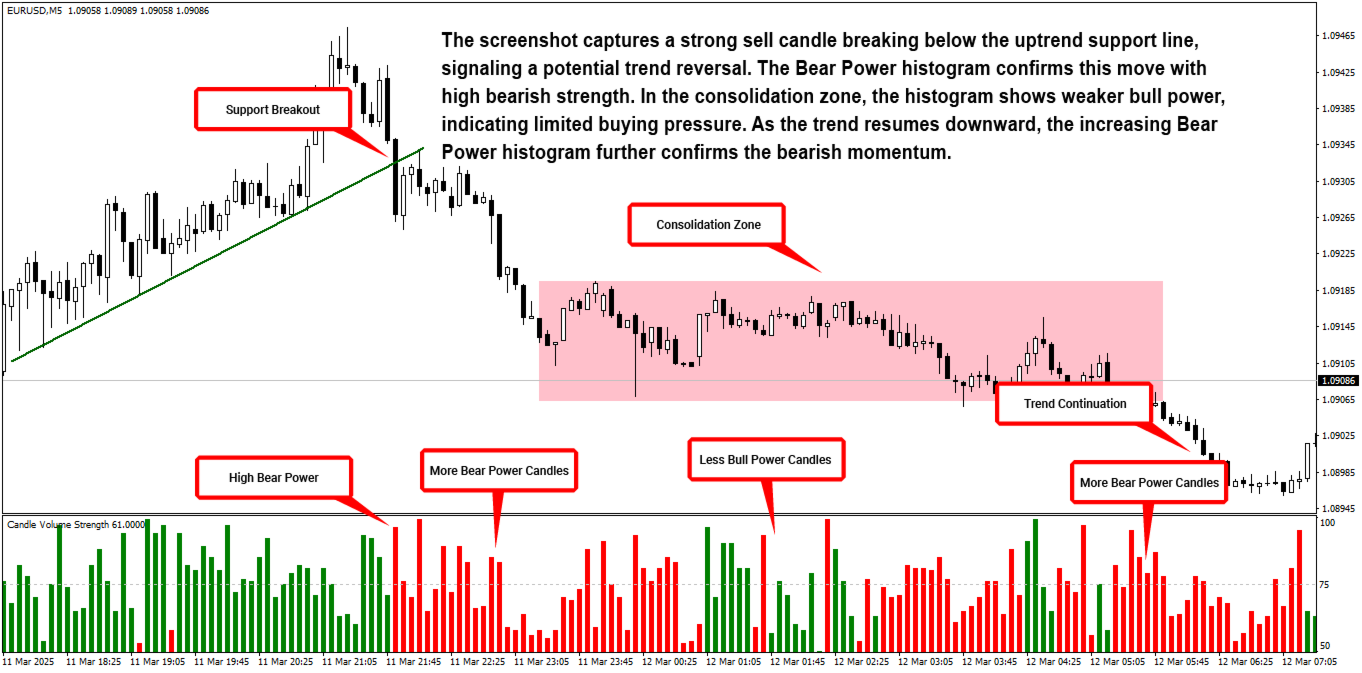
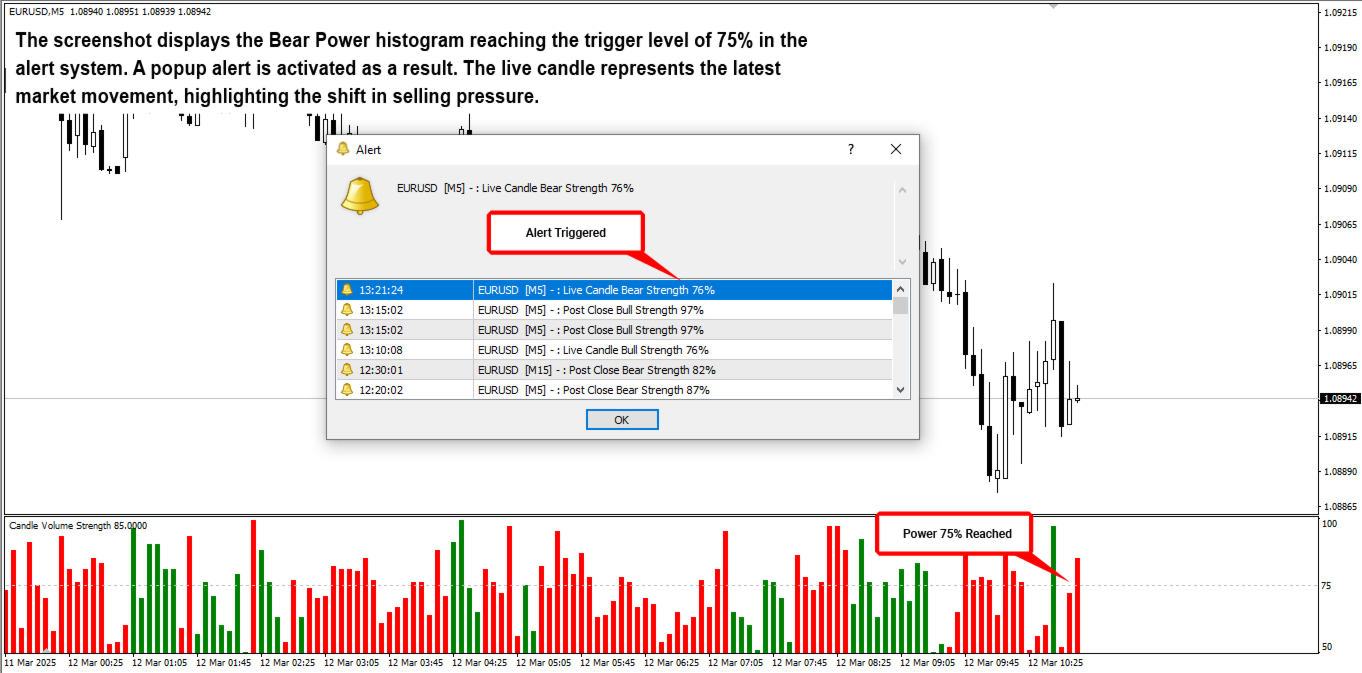
- Volume Based Confirmation – The indicator monitors tick volume changes and alerts when market power shifts between buyers and sellers.
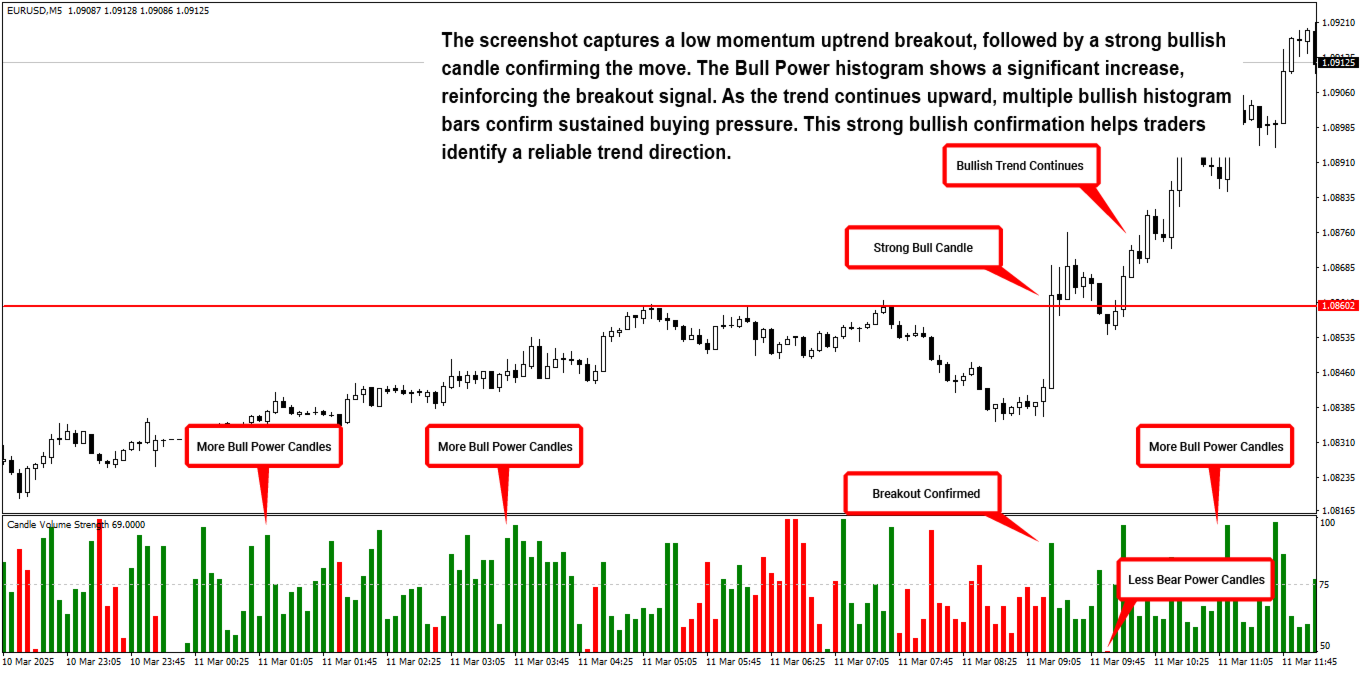
- Trend and Breakout Validation – By analyzing volume distribution, traders can confirm the strength of market trends and breakout signals.
- Reversal and Retracement Detection – Volume patterns help identify potential turning points in price movements.
- Support and Resistance Insights – Increased volume near key levels adds confidence in their reliability.
- Simple and Effective Visualization – Displays buy and sell strength as histogram bars for easy interpretation.
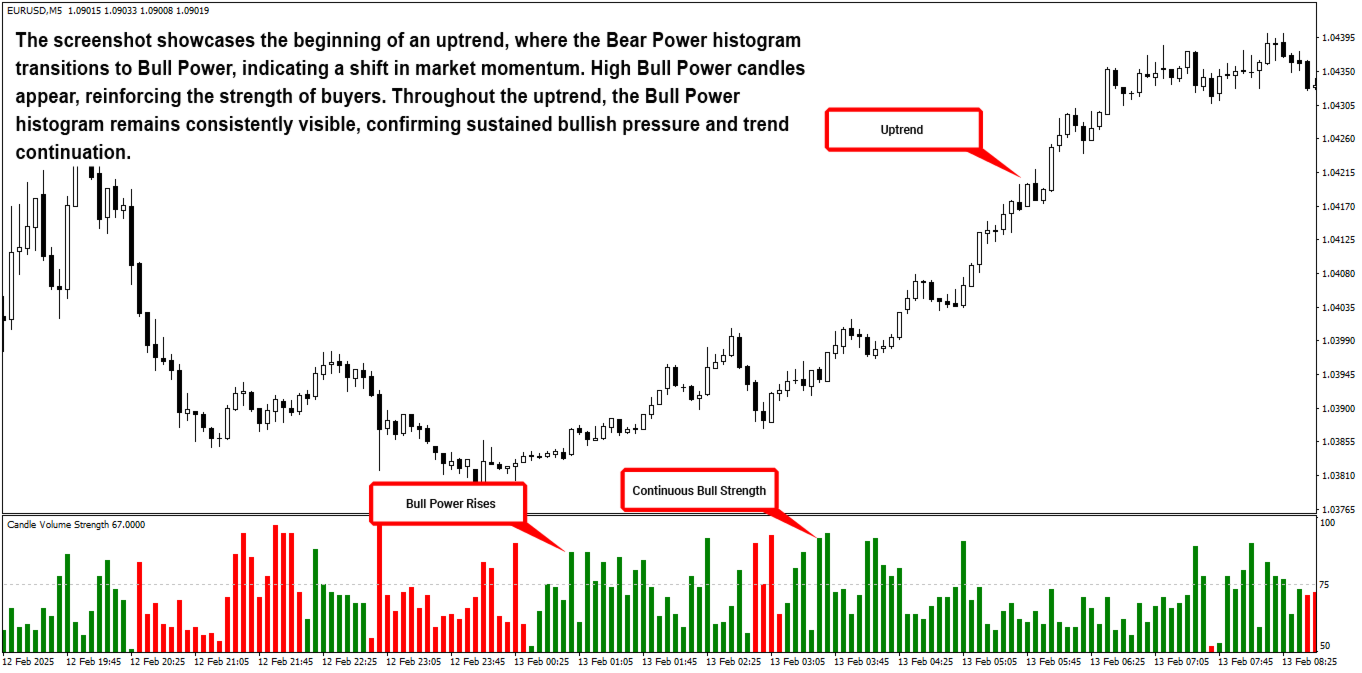
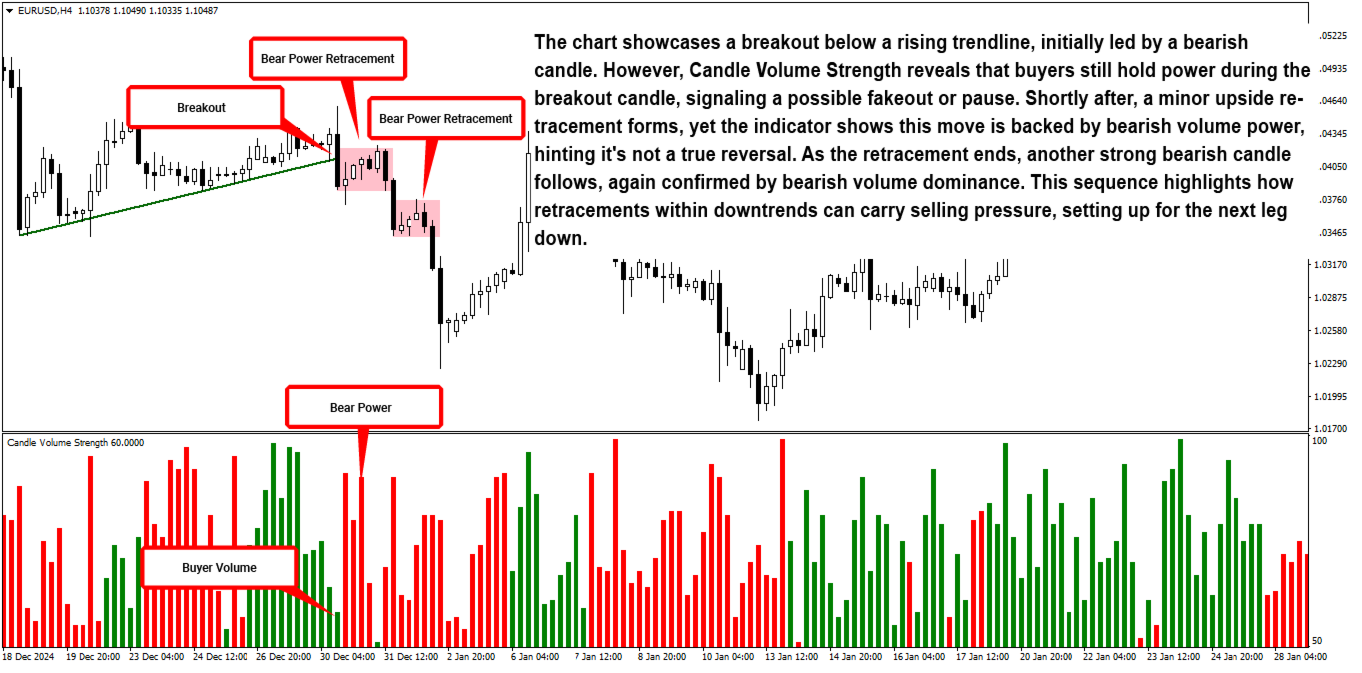
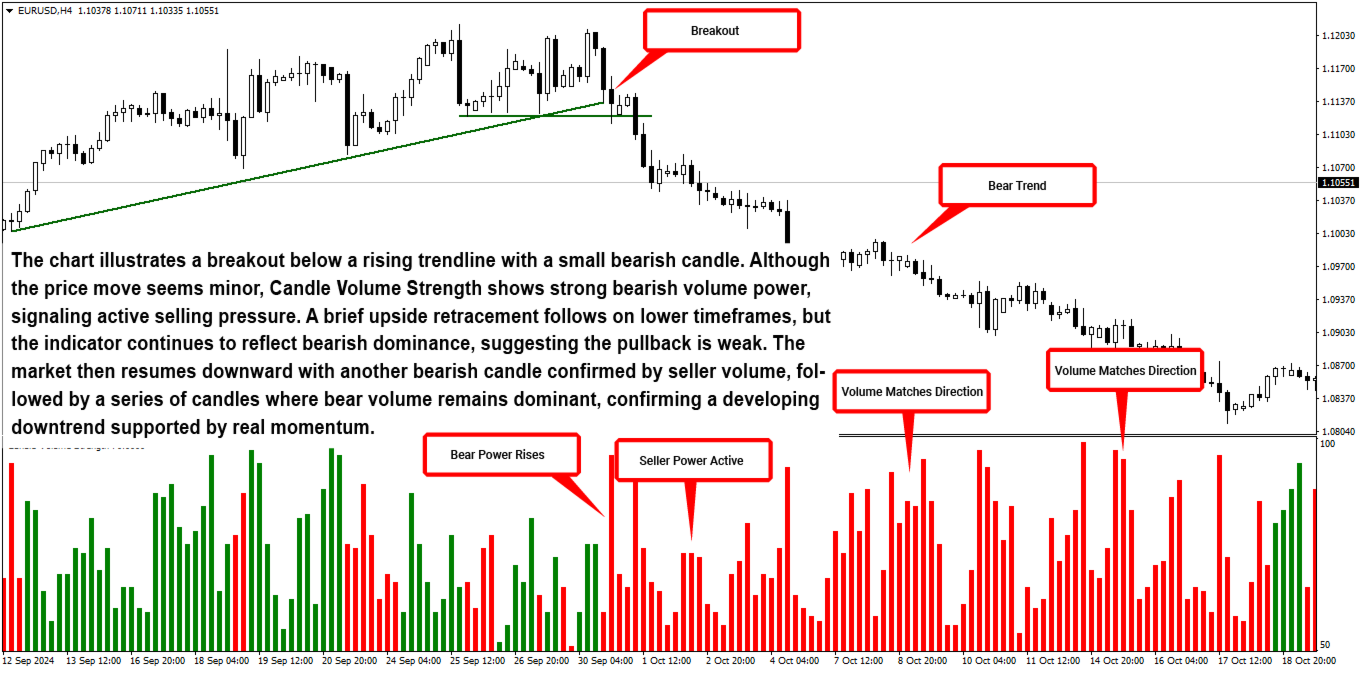
Candle Volume Strength helps traders make informed decisions by leveraging volume analysis to confirm market movements. During breakouts, high trading volume indicates strong market participation, reinforcing the validity of the breakout signal and reducing the likelihood of false moves. Understanding trend strength becomes easier as rising volume during an uptrend confirms sustained buying pressure, while increased volume in a downtrend signals strong selling activity, providing traders with greater confidence in trend continuation. Additionally, the indicator assists in spotting potential trend reversals by identifying divergences between price movement and volume activity. For instance, if prices continue to rise while volume declines, it may indicate a weakening trend and a potential reversal.
Moreover, volume based confirmations can significantly enhance trade execution by improving entry and exit points. By analyzing the volume of buyers and sellers, traders can better time their trades, ensuring they enter during strong price moves and exit before momentum fades. This approach helps minimize risk and maximize profitability by aligning trading decisions with real market dynamics. Candle Volume Strength is a powerful tool for those looking to integrate volume analysis into their trading strategy, offering valuable insights into market behavior and enabling more confident, data driven decision making.
Simple but great indicator. Thank you for this marevelous creation.