Gann Squaring Out of Time and Price

Gann Time–Price Square Cycles (MT5)

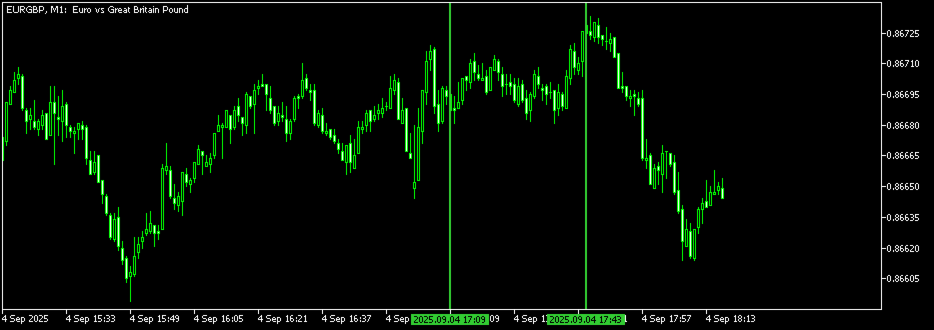
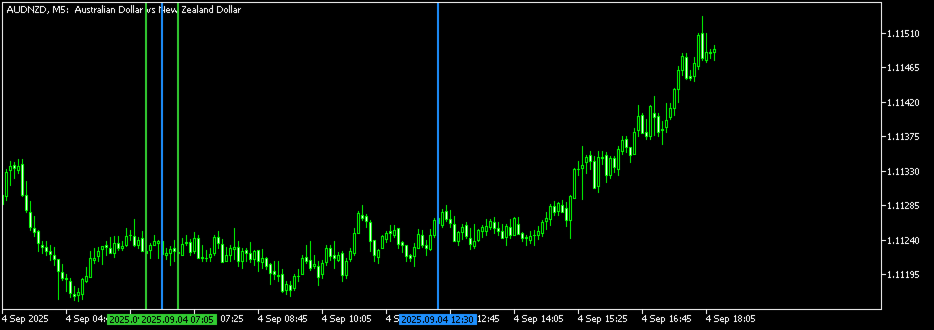
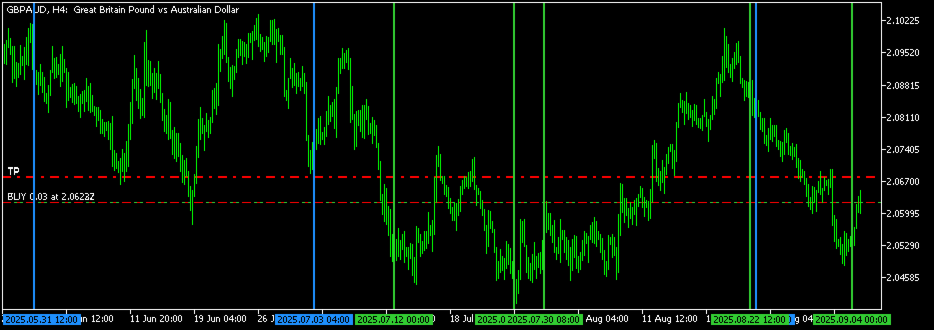
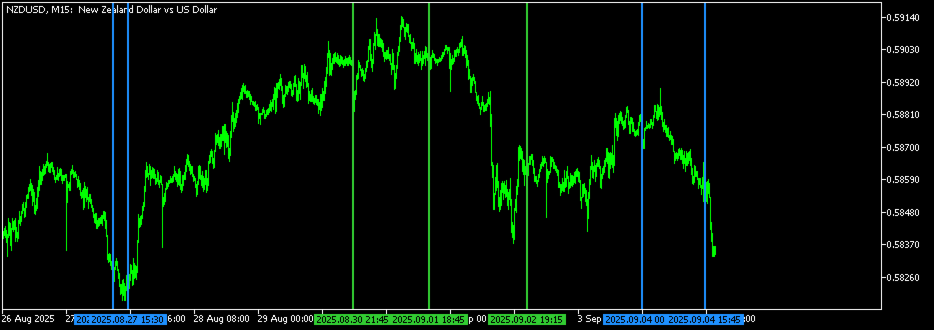
This indicator applies the concept of time–price balance introduced by W.D. Gann.
It detects price swings on the chart and projects Quarter, Half, and Full cycle time intervals forward, marking them with vertical lines.

The tool is designed to help traders study the relationship between swing size and elapsed time directly on MT5 charts.

Functions

  • Detects swing highs and lows based on pivot depth and minimum swing size.

  • Projects Quarter, Half, and Full harmonic intervals in time.

  • Draws vertical lines to indicate calculated cycle points.

  • Maintains drawn lines during chart navigation until the indicator is removed.

Features

  • Independent PivotDepth and MinSwingSize parameters for Quarter, Half, and Full cycles.

  • Refreshes automatically with new bars, when the symbol or timeframe is changed.

  • Designed to handle up to 5000 bars lookback.

  • Multiple instances can be applied on the same chart (each with its own Prefix).

  • Customizable line colors, styles, and width.

  • Automatically cleans its own objects when removed or reloaded.

Example Uses

  • Studying intraday cycles by setting smaller depth and swing values.

  • Observing longer-term cycles by applying larger depth and swing values.

  • Combining Quarter, Half, and Full projections to compare harmonic relationships.

How to Use

  1. Apply the indicator to any chart.

  2. Adjust PivotDepth and MinSwingSize for each harmonic cycle.

  3. Enable or disable Quarter, Half, or Full cycles as needed.

  4. The indicator will display vertical lines at projected cycle intervals.

Input Parameters

  • Quarter Cycle Settings
    • PivotDepthQuarter – detection depth for Quarter cycles.
    • MinSwingQuarter – minimum swing size for Quarter cycles.

  • Half Cycle Settings
    • PivotDepthHalf – detection depth for Half cycles.
    • MinSwingHalf – minimum swing size for Half cycles.

  • Full Cycle Settings
    • PivotDepthFull – detection depth for Full cycles.
    • MinSwingFull – minimum swing size for Full cycles.


Recommended products
Noize Absorption Index - is the manual trading system that measures the difference of pressure between bears forces and bulls forces. Green line - is a noize free index that showing curent situation. Zero value of index shows totally choppy/flat market.Values above zero level shows how powerfull bullish wave is and values below zero measures bearish forces.Up arrow appears on bearish market when it's ready to reverse, dn arrow appears on weak bullish market, as a result of reverse expectation.
Premium level is a unique indicator with more than 80% accuracy of correct predictions! This indicator has been tested for more than two months by the best Trading Specialists! The author's indicator you will not find anywhere else! From the screenshots you can see for yourself the accuracy of this tool! 1 is great for trading binary options with an expiration time of 1 candle. 2 works on all currency pairs, stocks, commodities, cryptocurrencies Instructions: As soon as the red arrow app
The SMC Venom Model BPR indicator is a professional tool for traders working within the Smart Money (SMC) concept. It automatically identifies two key patterns on the price chart: FVG   (Fair Value Gap) is a combination of three candles, in which there is a gap between the first and third candles. It forms a zone between levels where there is no volume support, which often leads to a price correction. BPR   (Balanced Price Range) is a combination of two FVG patterns that form a “bridge” - a zon
Volume Profile V6
Andrey Kolesnik
4.5 (2)
The volume profile indicator of the market + a smart oscillator. It works on almost all instruments-currency pairs, stocks, futures, cryptocurrency, on real volumes and on tick ones. You can set both the automatic definition of the profile range, for example, for a week or a month, etc., and set the range manually by moving the boundaries (two vertical lines red and blue). It is shown as a histogram. The width of the histogram at this level means, conditionally, the number of transactions condu
Was: $249  Now: $149   Market Profile defines a number of day types that can help the trader to determine market behaviour. A key feature is the Value Area, representing the range of price action where 70% of trading took place. Understanding the Value Area can give traders valuable insight into market direction and establish the higher odds trade. It is an excellent addition to any system you may be using. Inspired by Jim Dalton’s book “Mind Over Markets”, this indicator is designed to suit the
Trade smarter, not harder: Empower your trading with Harmonacci Patterns This is arguably the most complete harmonic price formation auto-recognition indicator you can find for the MetaTrader Platform. It detects 19 different patterns, takes fibonacci projections as seriously as you do, displays the Potential Reversal Zone (PRZ) and finds suitable stop-loss and take-profit levels. [ Installation Guide | Update Guide | Troubleshooting | FAQ | All Products ] It detects 19 different harmonic pri
Our   Basic Support and Resistance   indicator is the solution you need to boost your technical analysis. This indicator allows you to project support and resistance levels on the chart /   MT4 Version Features Integration of Fibonacci Levels:  With the option to display Fibonacci levels alongside support and resistance levels, our indicator gives you an even deeper insight into market behavior and possible reversal areas. Performance Optimization:  With the option to update extended lines onl
Overview Heiken Ashi CE Filtered MT5 is a technical indicator for the MetaTrader 5 platform. It integrates smoothed candlestick charting with a dynamic exit strategy and a customizable trend filter to deliver clear buy and sell signals. The indicator is designed to improve trend detection and signal reliability by reducing market noise. If you want to see more high-quality products or order the development/conversion of your own products, visit my partners' website: 4xDev Get 10% OFF on manual
Magic Finger can help you identify trends and trading opportunities clearly. The finger points to the open position signal, and the discoloration line is confirmed by the trend. If you are a day trader, you can choose to trade during a period of active trading, referring to the discoloration line as the basis for the next order, finger signal as a filter. If you are a trend trader, you can choose a period above H1, wait for the appearance of the finger signal in the key price area, and enter th
PipFinite Exit EDGE MT5
Karlo Wilson Vendiola
4.86 (29)
Did You Have A Profitable Trade But Suddenly Reversed? In a solid strategy, exiting a trade is equally important as entering. Exit EDGE helps maximize your current trade profit and avoid turning winning trades to losers. Never Miss An Exit Signal Again Monitor all pairs and timeframes in just 1 chart www.mql5.com/en/blogs/post/726558 How To Trade You can close your open trades as soon as you receive a signal Close your Buy orders if you receive an Exit Buy Signal. Close your Sell orders if
Trading Utility for Forex Currency Pairs Only not for Gold  Functions Auto Lot Calculation based on Risk Auto stoploss  Auto TakeProfit Breakeven Auto Close Half % Close in percentage with respect to the PIPs Pending Orders BuyLimit Sell Limit with distances BuyStop Sell Stop    with distances Trading Informations Risk in percentage For Multiple trades Combine Takeprofit and Combine Stoplosses
The Trend Catcher: The Trend Catcher Strategy with Alert Indicator is a versatile technical analysis tool that aids traders in identifying market trends and potential entry and exit points. It features a dynamic Trend Catcher Strategy , adapting to market conditions for a clear visual representation of trend direction. Traders can customize parameters to align with their preferences and risk tolerance. The indicator assists in trend identification, signals potential reversals, serves as a trail
FREE
Your Trend Friend
Luigi Nunes Labigalini
5 (1)
The trend is your friend! Look at the color of the indicator and trade on that direction. It does not  repaint. After each candle is closed, that's the color of the trend. You can focus on shorter faster trends or major trends, just test what's most suitable for the symbol and timeframe you trade. Simply change the "Length" parameter and the indicator will automatically adapt. You can also change the color, thickness and style of the lines. Download and give it a try! There are big movements w
##   ONLY GOLD ##   Тiльки Золото ## **Mercaria Professional Trading Zones - Complete Guide** ## **Mercaria Professional Trading Zones - Повний посібник** ### **How Mercaria Zones Work / Як працюють зони Mercaria** **English:** Mercaria Zones is an advanced trading indicator that identifies high-probability support and resistance areas using ZigZag extremes combined with mathematical zone calculations. The indicator works on multiple timeframes simultaneously, providing a comprehensive view
**   All Symbols   x   All Timeframes   scan just by pressing scanner button ** Discount: The price is $50$, But now it is just $35, Limited time offer is active. *** Contact me  to send you instruction and add you in "Trend Reversal group" for sharing or seeing experiences with other users. Introduction: Trendlines are the most famous technical analysis in trading . Trendlines continually form on the charts of markets across all the different timeframes providing huge opportunities for traders
This is a multi-symbol and multi-timeframe table-based indicator designed for a candlestick patterns detection with 46 patterns for META TRADER 5. Each formation has own image for easier recognition. Here you find most popular formations such as "Engulfing", "Hammer", "Three Line Strike", "Piercing" or Doji - like candles. Check my full list of patterns on my screenshots below. Also you can not only switch all bearish or bullish patterns from input, but also select formation for a specified symb
Mac-Binary option Signals is unique mathematical concept to trade iqoptions,binary,rocketoptions specter or any other binary options company 1 min 5 expiry run robot 30min everyday and fill profit and loss ratios inside mt2iq/mt2binary and run or 1min to 5min expiry ...go to setting in mt2iq robot allow otc and digital options. and select risk 500and profit 300$ per day it can stop automatically after profit or loss... If it can close after loss restart and Reset profit and loss button run again
An indicator of pattern #31 ("Long Island") from Encyclopedia of Chart Patterns by Thomas N. Bulkowski. The second gap is in the opposite direction. Parameters: Alerts - show alert when an arrow appears   Push - send a push notification when an arrow appears (requires configuration in the terminal) GapSize - minimum gap size in points ArrowType - a symbol from 1 to 17 ArrowVShift - vertical shift of arrows in points   ShowLevels - show levels ColUp - color of an upward line ColDn - color of a d
Owl Smart Levels MT5
Sergey Ermolov
3.97 (31)
MT4 version  |   FAQ The Owl Smart Levels Indicator is a complete trading system within the one indicator that includes such popular market analysis tools as Bill Williams' advanced fractals , Valable ZigZag which builds the correct wave structure of the market, and Fibonacci levels which mark the exact levels of entry into the market and places to take profits. Detailed description of the strategy Instructions for working with the indicator Advisor-assistant in trading Owl Helper Private User
Overview Harmonic Patterns MT5 is a technical analysis indicator designed for the MetaTrader 5 platform. It identifies and displays harmonic price patterns, such as Butterfly, Cypher, Crab, Bat, Shark, and Gartley, in both bullish and bearish directions. The indicator calculates key price levels, including entry, stop loss, and three take-profit levels, to assist traders in analyzing market movements. Visual elements and customizable alerts enhance usability on the chart. Features Detects six ha
Mine Farm
Maryna Kauzova
Mine Farm is one of the most classic and time-tested scalping strategies based on the breakdown of strong price levels. Mine Farm is the author's modification of the system for determining entry and exit points into the market... Mine Farm - is the combination of great potential with reliability and safety. Why Mine Farm?! - each order has a short dynamic Stop Loss - the advisor does not use any risky methods (averaging, martingale, grid, locking, etc.) - the advisor tries to get the most
Laguerre SuperTrend Clouds   adds an Adaptive Laguerre averaging algorithm and alerts to the widely popular SuperTrend indicator. As the name suggests,   Laguerre SuperTrend Clouds (LSC)   is a trending indicator which works best in trendy (not choppy) markets. The SuperTrend is an extremely popular indicator for intraday and daily trading, and can be used on any timeframe. Incorporating Laguerre's equation to this can facilitate more robust trend detection and smoother filters. The LSC uses the
Cumulative delta indicator As most traders believe, the price moves under the pressure of market buying or selling. When someone redeems an offer standing in the cup, the deal is a "buy". If someone pours into the bid standing in the cup - the deal goes with the direction of "sale". The delta is the difference between purchases and sales. A cumulative delta - the difference between the cumulative sum of purchases and sales for a certain period of time. It allows you to see who is currently contr
Due to limitations in MetaTrader 5, this indicator cannot be run in the Strategy Tester. To see it in action, you can download the demo version. SMC Drawing Tool User Guide Function Overview The SMC Drawing Tool is a professional technical analysis indicator for MetaTrader 5 that provides a variety of drawing tools, a smart labeling system, and supports multi-timeframe display and chart synchronization features. Main Functions Drawing Tools Trendline (Q key): Draws trendlines and adds labels.
Awesome Oscillator by Bill Williams with the ability to fine-tune and replace the averaging algorithms of the indicator, which significantly expands the possibilities of using this oscillator in algorithmic trading and brings it closer in its properties to such an indicator as the MACD. To reduce price noise, the final indicator is processed with an additional Smooth averaging. The indicator has the ability to give alerts, send mail messages and push signals when the direction of movement of th
VR Cub MT 5
Vladimir Pastushak
VR Cub is an indicator for getting high-quality entry points. The indicator was developed to facilitate mathematical calculations and simplify the search for entry points into a position. The trading strategy for which the indicator was written has been proving its effectiveness for many years. The simplicity of the trading strategy is its great advantage, which allows even novice traders to successfully trade with it. VR Cub calculates position opening points and Take Profit and Stop Loss targe
First of all Its worth emphasizing here that this Trading Tool is Non Repainting , Non Redrawing and Non Lagging Indicator , Which makes it ideal for professional trading . Online course, user manual and demo. The Smart Price Action Concepts Indicator is a very powerful tool for both new and experienced traders . It packs more than 20 useful indicators into one , combining advanced trading ideas like Inner Circle Trader Analysis and Smart Money Concepts Trading Strategies . This indicator focus
Fibo Channels
Jeffrey Quiatchon
Fibo Daily Channel Indicator The  Indicator is a powerful tool for traders, providing precise daily support and resistance levels based on Fibonacci retracement and extension calculations. This indicator automatically draws key pivot points (PP, R1, R2, S1, S2) as well as additional extension levels (R3, R4, S3, S4), helping traders identify potential reversal and breakout zones with ease. It includes customizable alerts and push notifications, allowing traders to receive updates whenever the pr
New Combined Indicator - 3 in 1 Are you looking for trading tools that can enhance your market analysis and investment strategies? We have combined three of our best indicators into a single powerful and convenient solution, allowing you to get the most value for your trading. 1. Order Block Indicator (previously sold for $32.90) The Order Block Indicator is an essential tool for identifying areas of strong institutional interest within the market. This indicator marks the highs and lows of orde
Volality Index Scalper
Lesedi Oliver Seilane
5 (1)
Volality Index scalper indicator  Meant for Volality pairs such as Volality 10, 25, 50, 75 and 100 The indicator works on all timeframes from the 1 minute to the monthly timeframe the indicator is non repaint the indicator has 3 entry settings 1 color change on zero cross 2 color change on slope change 3 color change on signal line cross Orange line is your sell signal Blue line is your buy signal.
Buyers of this product also purchase
ARIPoint
Temirlan Kdyrkhan
ARIPoint is a powerful trading companion designed to generate high-probability entry signals with dynamic TP/SL/DP levels based on volatility. Built-in performance tracking shows win/loss stats, PP1/PP2 hits, and success rates all updated live. Key Features: Buy/Sell signals with adaptive volatility bands Real-time TP/SL/DP levels based on ATR Built-in MA Filter with optional ATR/StdDev volatility Performance stats panel (Success, Profit/Loss, PP1/PP2) Alerts via popup, sound, push, or email Cu
Классификатор силы тренда. Показания на истории не меняет. Изменяется классификация только незакрытого бара. По идее подобен полной системе ASCTrend, сигнальный модуль которой, точнее его аппроксимация в несколько "урезанном" виде, есть в свободном доступе, а также в терминале как сигнальный индикатор SilverTrend . Точной копией системы ASCTrend не является. Работает на всех инструментах и всех временных диапазонах. Индикатор использует несколько некоррелируемых между собой алгоритмов для класси
FFx Universal Strength Meter PRO is more than a basic strength meter. Instead of limiting the calculation to price, it can be based on any of the 19 integrated strength modes + 9 timeframes. With the FFx USM, you are able to define any period for any combination of timeframes. For example, you can set the dashboard for the last 10 candles for M15-H1-H4… Full flexibility! Very easy to interpret... It gives a great idea about which currency is weak and which is strong, so you can find the best pai
The FFx Universal MTF alerter shows on a single chart all the timeframes (M1 to Monthly) with their own status for the chosen indicator. 9 indicators mode (MACD-RSI-Stochastic-MA-ADX-Ichimoku-Candles-CCI-PSAR). Each can be applied multiple times on the same chart with different settings. Very easy to interpret. Confirm your BUY entries when most of the timeframes are showing green color. And confirm your SELL entries when most of the timeframes are showing red color. 2 Alert Options : input to s
The FFx Watcher PRO is a dashboard displaying on a single chart the current direction of up to 15 standard indicators and up to 21 timeframes. It has 2 different modes: Watcher mode: Multi Indicators User is able to select up to 15 indicators to be displayed User is able to select up to 21 timeframes to be displayed Watcher mode: Multi Pairs User is able to select any number of pairs/symbols User is able to select up to 21 timeframes to be displayed This mode uses one of the standard indicators
FFx Patterns Alerter gives trade suggestions with Entry, Target 1, Target 2 and StopLoss .... for any of the selected patterns (PinBar, Engulfing, InsideBar, OutsideBar) Below are the different options available: Multiple instances can be applied on the same chart to monitor different patterns Entry suggestion - pips to be added over the break for the entry 3 different options to calculate the SL - by pips, by ATR multiplier or at the pattern High/Low 3 different options to calculate the 2 TPs -
MetaTrader 4 version available here : https://www.mql5.com/en/market/product/24881 FFx Basket Scanner is a global tool scanning all pairs and all timeframes over up to five indicators among the 16 available. You will clearly see which currencies to avoid trading and which ones to focus on. Once a currency goes into an extreme zone (e.g. 20/80%), you can trade the whole basket with great confidence. Another way to use it is to look at two currencies (weak vs strong) to find the best single pairs
MetaTrader 4 version available here: https://www.mql5.com/en/market/product/25793 FFx Pivot SR Suite PRO is a complete suite for support and resistance levels. Support and Resistance are the most used levels in all kinds of trading. Can be used to find reversal trend, to set targets and stop, etc. The indicator is fully flexible directly from the chart 4 periods to choose for the calculation: 4Hours, Daily, Weekly and Monthly 4 formulas to choose for the calculation: Classic, Camarilla, Fibonac
Recommended TimeFrame >= H1. 100% Non Repainted at any moment.  Use it carefully, only with Trend Direction. Trading Usage: 2 Variants: as Range System or as BreakOut System (Both Only With Trend Direction)::: (Always use StopLoss for minimise Risk); [1] as Range System: (Recommended) in UP TREND:  - BUY in Blue Line , then if price goes down by 50 points (on H1) open Second BUY.   Close in any Profit you wish: TrailingStop(45 points) or Close when Price touches upper Gold Line. in DOWN TREND
Spike Detector
Tete Adate Adjete
this indicator is a Spike detector indicator, it is specially designed to trade Boom 1000, Boom 500, Crash 1000 and Crash 500 We recommend using it on Deriv Boom and Crash indices only Its setting is intuitive, familiar, easy to use it has notification functions; audible notifications and push notifications. this tool is simple to use, easy to handle This update is based on different strategies for spikes
BC Scalper Aroow
Tete Adate Adjete
This indicator is based on the crossing of two Moving Average with the RSI It is intended for scalpers Specially designed for Boom and Crash syhtetic indices from Binary.com/Deriv.com It is easy to use and intuitive. We recommend its use on M1 and is equipped with three types of notification Email alert Sound notification Push notification these parameters can be activated and deactivated.
This indicator is a scalping indicator intended solely for the Boom and Crash indices of the Deriv Limited market It supports Boom 500, Boom 1000, Crash 500 and Crash 1000 Not repaint and no bug The settings are intuitive and easy to use The product activation number is 20 The Time Frame used depends on the user If you are an aggressive scalper then just use M1 For long trades use M15 If you are conservative use M5 Please contact me for more details of its use
ForexAndCryptoTradeTool
Gabriel Ferreira Da Silva
Quantitative analysis software, this indicator came from another country and thanks to my network today I can share this software with you! Russian Tool plots arrows on your asset, indicating the trend the asset will enter, easy to use and easy to install indicator We have been working with robots and indicators since 2018! We came to MQL5 to be able to bring better benefits at the time of payment by our customers!, our Instagram where we post daily stories of operations: https://www.instagr
MMM Gold Sniper MT5
Gilang Wardhana Purnama Putra
Indicator is based on   Market Maker Strategy.   NO REPAINT. MM's are traders and their objective is to make money.  This includes strategies to trade against retails traders.  The major difference between them and other traders is that they have the ability, through access to massive volumes, to move price at their will.  So to make money, they aim to buy at a lower price and then sell at a higher price. They achieve this by:  1. Inducing traders to take positions. This is achieved by using a
Magicx
Hasan Abdulhussein
The indicator places a buy or sell signal when the conditions of the strategy it was designed with are met. The strategy is guaranteed, strong, and has been tested for 9 years. The indicator is for binary options and can be converted into a bot by linking it to MT2Trading, where it sends the signal to this platform. This platform automatically opens a trade on the trading platform you are using, whether it is Pocket Option, IQ Option, or any other binary options platforms. The entry is on the n
CBT Quantum Maverick High-Efficiency Binary Trading System CBT Quantum Maverick is a finely tuned, high-performance Binary Options Trading System designed for traders seeking precision, simplicity, non-repaint signals and disciplined trading. No customization is required—this system is optimized for effective results right out of the box. Simply follow the signals, which can be mastered with a bit of practice. Key Features: Signal Precision: New-bar-based trading signals—targeting the next ca
Introducing to your attention an innovative expert advisor created specifically for the most juicy and volatility    currency     basket: GBPUSD, XAUUSD and EURJPY. This system is designed using the main features of this market's movement, making it an ideal choice for dynamic trading on high-trending and medium-volatile pairs.   The signals are focused on minimizing trading risks, aiming to reduce losses to a minimum. Main features ESignals is designed to show open and close arrows at the beg
ITF Trend Filter
Mayowa Daniel Sonaike
This strategy focuses on identifying and following clear market trends by filtering out noise and short-term fluctuations. Using advanced algorithms, it highlights significant upward and downward movements, enabling traders to make data-driven decisions. The indicator is designed for simplicity and precision, ideal for traders who prefer a systematic approach to trend trading. Whether you're a beginner or an experienced trader, this tool helps you stay aligned with the dominant market direction
In sadiq100
Xssadq Alseydy
مؤشر Smart Trend Candles هو أداة فعّالة في منصة MetaTrader 4، تجمع بين عناصر تحليل فني متعددة لتحديد اتجاهات السوق وقياس قوة المشترين والبائعين. يوفر هذا المؤشر متعدد الاستخدامات إشارات مرئية واضحة تُحسّن قرارات التداول الخاصة بك. الميزات الرئيسية 1. تحديد الاتجاه يستخدم شموع Heikin-Ashi المعدلة (اختياري) لتصفية ضوضاء السوق يتضمن متوسطًا متحركًا (فترة قابلة للتكوين) لتأكيد الاتجاه تنفيذ مؤشر القوة النسبية لقياس الزخم 2. قياس القوة تشير الشموع المرمزة بالألوان إلى شدة ضغط الشراء/البيع تحليل الحج
Advanced Analysis – Total Visual Clarity The Ichimoku Dashboard features three powerful dashboards to deliver precise trading signals based on a proven methodology. The color-coded panel design allows users to instantly identify the status of each monitored financial instrument at a glance. The combined table of the "Ichimoku Dashboard" for MetaTrader 5 is a key component that integrates and synthesizes trading signals generated by the indicators, providing a clear and immediate overview to su
Trend Frequency Market MT5 Carry out analysis and backtest even before opening your orders, check the strategy's Winrate and stay in favor of the Trend and the strength of the movement. The TFM indicator is specialized in providing you with the strength points of the movement, painting the candles GREEN or RED to report price aggression from the Players who are acting at the exact moment. Taking advantage of this detection, the indicator plots Arrow and Entry, Stop Loss and Take Profit levels
Neuro Future
Sergey Rozhnov
Neural Network Indicator with Built-In Learning. This is a real autonomous artificial intelligence system  powered by a multi-level customizable perceptron and advanced training settings to predict future price changes. You can train the indicator yourself on any finansial symbol, you don't need any special knowledge in machine learning, everything you need is collected in this tool and conveniently implemented with automatic mode and presets. Features: Train Directly in MT5.   You have a uniqu
TrendFlow Tracker
David Macharia Kamau
TrendCatcherBot: Find Your Edge in the Market Don't guess the trend—catch it. The TrendCatcherBot is an Expert Advisor designed for MetaTrader 5 that simplifies your trading strategy. By leveraging the power of moving average crossovers, this bot provides clear, visual signals directly on your chart, so you always know when to act. Watch for the unmistakable green, red, and black dots in the corner of your screen to instantly see if the market is signaling a buy, sell, or hold. It's the perfect
Divergence Bomber
Ihor Otkydach
4.98 (63)
Each buyer of this indicator also receives the following for free: The custom utility "Bomber Utility", which automatically manages every trade, sets Stop Loss and Take Profit levels, and closes trades according to the rules of this strategy Set files for configuring the indicator for various assets Set files for configuring Bomber Utility in the following modes: "Minimum Risk", "Balanced Risk", and "Wait-and-See Strategy" A step-by-step video manual to help you quickly install, configure, and s
Trend Screener Pro MT5
STE S.S.COMPANY
4.87 (90)
Unlock the Power of Trends Trading with the Trend Screener Indicator: Your Ultimate Trend Trading Solution powered by Fuzzy Logic and Multi-Currencies System! Elevate your trading game with the Trend Screener, the revolutionary trend indicator designed to transform your Metatrader into a powerful Trend Analyzer. This comprehensive tool leverages fuzzy logic and integrates over 13 premium features and three trading strategies, offering unmatched precision and versatility. LIMITED TIME OFFER : Tre
FX Volume MT5
Daniel Stein
4.84 (19)
FX Volume: Experience Genuine Market Sentiment from a Broker’s Perspective Quick Overview Looking to elevate your trading approach? FX Volume provides real-time insights into how retail traders and brokers are positioned—long before delayed reports like the COT. Whether you’re aiming for consistent gains or simply want a deeper edge in the markets, FX Volume helps you spot major imbalances, confirm breakouts, and refine your risk management. Get started now and see how genuine volume data can
***  Entry In The Zone and SMC Multi Timeframe is a real-time market analysis tool developed based on the Smart Money Concepts (SMC) framework. It automatically analyzes reversal points and key zones across multiple timeframes, emphasizing No Repaint signals and highlighting Points of Interest (POI) .It also features an Auto Fibonacci Level System that automatically draws Fibonacci lines to help detect pullbacks and reversal points instantly. Most importantly, the signals help identify potentia
Grabber System MT5
Ihor Otkydach
5 (15)
Let me introduce you to an excellent technical indicator – Grabber, which works as a ready-to-use "All-Inclusive" trading strategy. Within a single code, it integrates powerful tools for technical market analysis, trading signals (arrows), alert functions, and push notifications. Every buyer of this indicator also receives the following for free: Grabber Utility for automatic management of open orders Step-by-step video guide: how to install, configure, and trade with the indicator Custom set fi
How many times have you bought a trading indicator with great back-tests, live account performance proof with fantastic numbers and stats all over the place but after using it, you end up blowing your account? You shouldn't trust a signal by itself, you need to know why it appeared in the first place, and that's what RelicusRoad Pro does best! User Manual + Strategies + Training Videos + Private Group with VIP Access + Mobile Version Available A New Way To Look At The Market RelicusRoad is the
ARIScalping
Temirlan Kdyrkhan
ARIScalp is a powerful trading companion designed to generate high-probability entry signals with dynamic TP/SL/DP levels based on volatility. Built-in performance tracking shows win/loss stats, PP1/PP2 hits, and success rates all updated live. Key Features: Buy/Sell signals with adaptive volatility bands Real-time TP/SL/DP levels based on ATR Built-in MA Filter with optional ATR/StdDev volatility Performance stats panel (Success, Profit/Loss, PP1/PP2) Alerts via popup, sound, push, or email Cus
More from author
The Hull Moving Average (HMA) is renowned for its ability to smooth price movements effectively while maintaining responsiveness to recent price changes. When combined with a shifted Hull Moving Average crossover strategy, it offers a robust approach for identifying trends. Here's why: 1. Smoothness and Responsiveness : The HMA reduces noise in price data due to its weighted moving average calculation, which prioritizes recent prices. This smoothness helps filter out insignificant price fluctuat
Filter:
No reviews
Reply to review