
Entry In The Zone with SMC Multi Timeframe
- Utilitaires
- Version: 2.51
- Mise à jour: 23 septembre 2026
- Activations: 10

Prochaine mise à jour — Version 2.52 bientôt disponible ! [NOUVEAU]
Préparez-vous à découvrir 4 nouvelles fonctionnalités majeures conçues pour améliorer votre analyse du marché et votre flux de travail de trading
Nous faisons passer l’analyse du marché au niveau supérieur avec 4 nouvelles fonctionnalités conçues pour répondre à vos besoins en trading. Découvrez :
1. TRADE OVERVIEW DASHBOARD
2. CONFLUENCE AT ZONE
3. STRONG & WEAK HIGH/LOW
4. OTE
1. TRADE OVERVIEW DASHBOARD
Un tableau de bord qui vous aide à mieux comprendre la situation globale du marché, en fournissant des indications pour soutenir vos décisions de trading et vous aider à analyser le marché et à planifier vos trades de manière systématique, le tout sur un seul écran.
Vue d’ensemble du marché sur plusieurs unités de temps (Multi-Timeframe Market Overview)
Obtenez une compréhension plus claire de la direction du marché et de la structure des prix
Vérifiez rapidement les conditions du marché
Des indications pour une analyse systématique du marché et la planification des entrées.
2. CONFLUENCE AT ZONE
Lorsque le prix entre dans une zone clé... Vous saurez combien de facteurs de confirmation sont alignés
Les zones clés sont des endroits où les décisions de trading sont importantes. Mais le simple fait que le prix entre dans une zone ne suffit pas. Cette fonctionnalité vous aide à identifier les facteurs qui sont alignés, notamment les signaux et d’autres facteurs pertinents, avant d’entrer en position, afin de réaliser une analyse plus approfondie et de prendre des décisions mieux éclairées.
3. STRONG & WEAK HIGH/LOW
Identifie les sommets et creux forts (Strong High/Low) qui ont plus de chances d’être protégés par la structure du marché, ainsi que les sommets et creux faibles (Weak High/Low) qui ont plus de chances d’être cassés ou balayés pour récupérer de la liquidité. Aide les traders à analyser la structure du marché et à évaluer de manière systématique les objectifs potentiels de liquidité.
4. Optimal Trade Entry (OTE)
Met en évidence la zone de retracement optimale (généralement entre 61,8 % et 79 % de Fibonacci) au sein d’un mouvement impulsif afin d’aider à identifier les opportunités d’entrée potentielles alignées sur la structure du marché.
Analysez le marché de manière systématique. Tradez avec un plan.
FABLE Pro Suite : une suite d’indicateurs complémentaires pour Entry In The Zone and SMC Multi-Timeframe, sans frais supplémentaires. Prête à être utilisée immédiatement après l’achat, sans aucune approbation requise. Disponible gratuitement.
Indicateurs inclus :
- Price Action Radar
- Adaptive RSI Filter
- Bar Count Down
- Auto Volume Profile
- Adapt Nadaraya MTF
- Smart Strength
- Auto Multi Trendlines Breakout Signal Alerts
- Bientôt disponible*
Fonctionnalités principales de l’outil
La structure du marché passe toujours en premier
La structure du marché est le fondement des Smart Money Concepts (SMC). Une identification incorrecte de la structure du marché peut entraîner une mauvaise interprétation des BOS, CHoCH, Liquidity, Order Blocks et Supply & Demand.
1. Détection automatique de la structure du marché
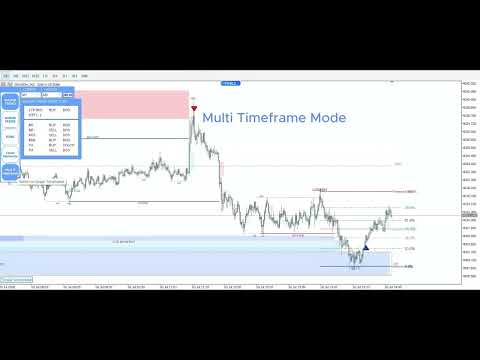
Détecte automatiquement les BOS, CHoCH, mBOS et mCHoCH, avec une distinction claire entre Major Trend et Minor Trend. Identifie les Swing Highs, Swing Lows et les étiquettes de structure du marché (HH, HL, LH et LL).
STRONG & WEAK HIGH/LOW : Identifie les sommets et creux forts (Strong High/Low) qui ont plus de chances d’être protégés par la structure du marché, ainsi que les sommets et creux faibles (Weak High/Low) qui ont plus de chances d’être cassés ou balayés pour récupérer de la liquidité. Aide les traders à analyser la structure du marché et à évaluer de manière systématique les objectifs potentiels de liquidité.
2. Identification automatique des principaux Points of Interest (POIs)
Identifie et trace automatiquement les principaux Points of Interest, notamment :
Order Blocks (OB) / Volumized Order Block (VOB)
Supply & Demand Zones
Fair Value Gaps (FVGs)
3. Toutes les informations essentielles du marché sur un seul graphique
Réunit les outils essentiels d’analyse SMC sur un seul graphique :
Liquidity et Liquidity Sweep Detection (LQS)
Equal Highs / Equal Lows
Previous Day High / Low (PDH / PDL)
Previous Week High / Low (PWH / PWL)
Premium & Discount Zones
Auto Fibonacci
OTE – (Version 2.52 bientôt disponible !)
Trading Sessions
4. Signaux et alertes BUY / SELL en temps réel
Logique No-Repaint : Fournit des signaux BUY / SELL avec des alertes et des notifications en temps réel lorsque des signaux de trading apparaissent.
Les alertes supplémentaires comprennent :
Alertes structurelles BOS et CHoCH
Notifications lorsque le prix atteint des zones clés
Notifications push mobiles pour vous aider à rester informé lorsque vous êtes loin de votre écran de trading
Le système de signaux BUY / SELL est conçu pour aider à réduire les faux signaux et à améliorer la qualité globale des opportunités de trading. Cependant, aucun système de signaux ne peut éliminer tous les faux signaux ni garantir des trades rentables.
5. Analyse en temps réel et données historiques
Les composants du marché sont mis à jour en fonction de l’évolution des prix en temps réel afin de maintenir l’analyse en adéquation avec les conditions changeantes du marché.
Les zones historiques restent visibles, facilitant l’examen des graphiques, le backtesting et le développement systématique de stratégies.
6. Analyse sur une seule unité de temps et analyse multi-unités de temps
Prend en charge l’analyse sur une seule unité de temps (Single-Timeframe Analysis) et l’analyse multi-unités de temps (Multi-Timeframe Analysis), permettant aux traders d’analyser la structure du marché et les zones clés sur l’unité de temps actuelle ou sur plusieurs unités de temps.
Convient à différents styles de trading, notamment :
Scalping
Intraday Trading
Swing Trading
Les éléments du graphique peuvent être activés ou désactivés selon les préférences d’analyse de chacun. L’indicateur s’intègre également à The FABLE Pro Suite pour aider à créer un espace de trading clair, organisé et facile à lire.
Conçu pour les débutants et les traders expérimentés
Pour les débutants : Visualisez la structure du marché et les principaux concepts SMC directement sur le graphique, réduisez le besoin de tracés manuels répétitifs et apprenez grâce à l’analyse pratique des graphiques.
Pour les traders expérimentés : Gagnez du temps sur les analyses répétitives du marché et concentrez-vous davantage sur l’évaluation des opportunités d’entrée et de sortie, le développement de stratégies de trading et la gestion des risques.
Si vous rencontrez des difficultés ou avez des questions lors de l’utilisation du produit, n’hésitez pas à me contacter à tout moment via le système de messagerie privée MQL5.
Merci pour votre confiance et votre soutien. Nous vous souhaitons un succès continu dans votre trading et continuerons à améliorer et à enrichir notre produit afin de vous offrir la meilleure expérience de trading possible.




















































It’s been about half a year since I bought it? I can’t remember exactly, but I open it every time I trade, and it’s really useful. However, it occasionally closes due to errors when switching between different timeframes. Overall, it’s still very good—keep up the support!