
Entry In The Zone with SMC Multi Timeframe
- Утилиты
- Версия: 2.51
- Обновлено: 23 сентября 2026
- Активации: 10

Следующее обновление — версия 2.52 уже скоро! [НОВОЕ]
Приготовьтесь к 4 новым важным функциям, призванным улучшить ваш анализ рынка и торговый процесс.
Мы выводим анализ рынка на новый уровень с помощью 4 новых функций, разработанных с учётом ваших потребностей в трейдинге. Представляем:
1. TRADE OVERVIEW DASHBOARD
2. CONFLUENCE AT ZONE
3. STRONG & WEAK HIGH/LOW
4. OTE
1. TRADE OVERVIEW DASHBOARD
Панель, которая помогает легче понимать общую картину рынка, предоставляя рекомендации для поддержки ваших торговых решений и помогая систематически анализировать рынок и планировать сделки на одном экране.
Обзор рынка на нескольких таймфреймах (Multi-Timeframe Market Overview)
Более чёткое понимание направления рынка и структуры цены
Быстрая оценка рыночных условий
Рекомендации для систематического анализа рынка и планирования точек входа.
2. CONFLUENCE AT ZONE
Когда цена входит в ключевую зону... Вы узнаете, сколько подтверждающих факторов совпадают.
Ключевые зоны — это области, в которых торговые решения имеют особое значение. Однако одного лишь входа цены в зону недостаточно. Эта функция помогает определить, какие факторы совпадают, включая сигналы и другие релевантные факторы, прежде чем входить в сделку. Это позволяет проводить более глубокий анализ и принимать решения на основе более полной информации.
3. STRONG & WEAK HIGH/LOW
Определяет сильные максимумы и минимумы (Strong High/Low), которые с большей вероятностью будут защищены рыночной структурой, и слабые максимумы и минимумы (Weak High/Low), которые с большей вероятностью будут пробиты или использованы для снятия ликвидности. Помогает трейдерам анализировать рыночную структуру и систематически оценивать потенциальные цели ликвидности.
4. Optimal Trade Entry (OTE)
Выделяет оптимальную зону коррекции (обычно в диапазоне уровней Fibonacci 61,8%–79%) внутри импульсного движения, помогая определять потенциальные возможности для входа в рынок, соответствующие рыночной структуре.
Анализируйте рынок систематически. Торгуйте по плану.
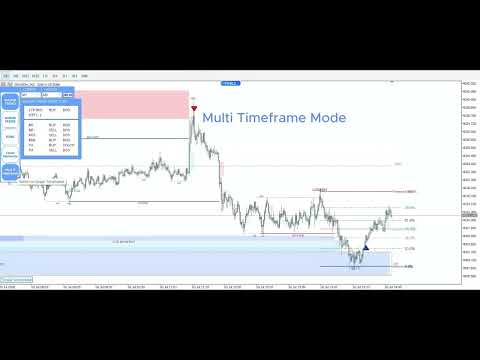
Entry In The Zone with SMC Multi Timeframe — это инструмент для анализа рынка в реальном времени, основанный на концепции Smart Money Concepts (SMC), предназначенный для анализа рыночной структуры, направления движения цены и ключевых торговых зон.
Инструмент поддерживает анализ на одном таймфрейме (Single-Timeframe Analysis) и анализ на нескольких таймфреймах (Multi-Timeframe Analysis), обеспечивая более наглядное представление общей структуры рынка на разных таймфреймах, а также сигналы BUY / SELL в реальном времени, разработанные со строгим соблюдением принципа No-Repaint (без перерисовки). Сигналы предназначены для фильтрации неясных торговых ситуаций и оценки торговых возможностей с учётом рыночной структуры (Market Structure), областей интереса (POIs), ликвидности (Liquidity) и управления рисками (Risk Management), помогая планировать точки входа и принимать торговые решения более систематично.
Для поддержки систематического управления рисками система включает Risk Per Trade Calculator, который автоматически рассчитывает подходящий размер лота на основе Stop Loss и выбранного процента риска, включая правильный тип ордера, помогая трейдерам поддерживать последовательный контроль риска по каждой позиции.
Всё, что нужно для чтения рынка, собрано на одном графике.
FABLE Pro Suite — набор вспомогательных индикаторов для Entry In The Zone and SMC Multi-Timeframe. Без дополнительной платы. Готов к использованию сразу после покупки, без необходимости получения одобрения. Доступен бесплатно.
Входящие в комплект индикаторы:
1. Price Action Radar
2. Adaptive RSI Filter
3. Bar Count Down
4. Auto Volume Profile
5. Adapt Nadaraya MTF
6. Smart Strength
7. Auto Multi Trendlines Breakout Signal Alerts
8. Скоро появится*
Скачать The FABLE Pro Suite можно здесь / Ознакомиться с полной документацией можно в блоге продукта: [Complete User Guide]
Перед покупкой, пожалуйста, прочитайте раздел 7 [Complete User Guide], чтобы понять различия между версией индикатора (Indicator Version) и версией утилиты (Utility Version, Risk Per Trade).
Основные функции инструмента
Рыночная структура всегда на первом месте
Рыночная структура является основой Smart Money Concepts (SMC). Неправильное определение рыночной структуры может привести к неверной интерпретации BOS, CHoCH, ликвидности (Liquidity), блоков ордеров (Order Blocks) и зон предложения и спроса (Supply & Demand).
1. Автоматическое определение рыночной структуры
Автоматически определяет BOS, CHoCH, mBOS и mCHoCH, чётко разделяя основной тренд (Major Trend) и второстепенный тренд (Minor Trend). Определяет Swing Highs, Swing Lows и обозначения рыночной структуры (HH, HL, LH и LL).
STRONG & WEAK HIGH/LOW: Определяет сильные максимумы и минимумы (Strong High/Low), которые с большей вероятностью будут защищены рыночной структурой, и слабые максимумы и минимумы (Weak High/Low), которые с большей вероятностью будут пробиты или использованы для снятия ликвидности. Помогает трейдерам анализировать рыночную структуру и систематически оценивать потенциальные цели ликвидности.
(Версия 2.52 — скоро появится!)
2. Автоматическое определение ключевых областей интереса (POIs)
Автоматически определяет и отображает ключевые области интереса (Points of Interest), включая:
Блоки ордеров (OB) / Объёмные блоки ордеров (VOB)
Зоны предложения и спроса (Supply & Demand Zones)
Дисбалансы справедливой стоимости (Fair Value Gaps, FVGs)
3. Вся необходимая информация о рынке на одном графике
Объединяет основные инструменты анализа SMC на одном графике:
Ликвидность и обнаружение снятия ликвидности (Liquidity Sweep Detection, LQS)
Равные максимумы / равные минимумы (Equal Highs / Equal Lows)
Максимум / минимум предыдущего дня (PDH / PDL)
Максимум / минимум предыдущей недели (PWH / PWL)
Зоны премиума и дисконта (Premium & Discount Zones)
Автоматический Fibonacci (Auto Fibonacci)
OTE — (Версия 2.52 — скоро появится!)
Торговые сессии (Trading Sessions)
4. Сигналы BUY / SELL и оповещения в реальном времени
Логика No-Repaint: Предоставляет сигналы BUY / SELL, а также оповещения и уведомления в реальном времени при появлении торговых сигналов.
Дополнительные оповещения включают:
Оповещения о структурных событиях BOS и CHoCH
Уведомления при достижении ценой ключевых зон
Push-уведомления на мобильные устройства, которые помогают оставаться в курсе событий, даже когда вы находитесь вдали от торгового экрана
Система сигналов BUY / SELL разработана для снижения количества ложных сигналов и повышения общего качества торговых возможностей. Однако ни одна система сигналов не может полностью исключить ложные сигналы или гарантировать прибыльные сделки.
5. Анализ в реальном времени и исторические данные
Компоненты рынка обновляются на основе текущего движения цены, помогая поддерживать соответствие анализа изменяющимся рыночным условиям.
Исторические зоны остаются видимыми, что позволяет просматривать графики, проводить бэктестинг и систематически разрабатывать торговые стратегии.
6. Анализ на одном и нескольких таймфреймах
Поддерживает анализ на одном таймфрейме (Single-Timeframe Analysis) и анализ на нескольких таймфреймах (Multi-Timeframe Analysis), позволяя трейдерам анализировать рыночную структуру и ключевые зоны на текущем таймфрейме или на нескольких таймфреймах.
Подходит для различных стилей торговли, включая:
Скальпинг (Scalping)
Внутридневную торговлю (Intraday Trading)
Свинг-трейдинг (Swing Trading)
Элементы графика можно включать и отключать в соответствии с индивидуальными предпочтениями анализа. Индикатор также интегрируется с The FABLE Pro Suite, помогая создать чистое, организованное и удобное для чтения торговое рабочее пространство.
Разработан для начинающих и опытных трейдеров
Для начинающих: Визуализируйте рыночную структуру и ключевые концепции SMC непосредственно на графике, сокращая необходимость многократного ручного построения и помогая обучаться посредством практического анализа графиков.
Для опытных трейдеров: Экономьте время на повторяющемся анализе рынка и уделяйте больше внимания оценке возможностей входа и выхода, разработке торговых стратегий и управлению рисками.
7. Risk Per Trade
Встроенный калькулятор Risk Per Trade Calculator автоматически рассчитывает подходящий размер лота (Lot Size) на основе выбранного процента риска (Risk Percentage) и уровня Stop Loss, а также рассчитывает соотношение риска к прибыли (Risk-to-Reward, RR) и автоматически определяет подходящий тип ордера (Order Type).
Основные функции:
Автоматический расчёт размера лота (Lot Size)
Расчёт соотношения риска к прибыли (Risk-to-Reward, RR)
Автоматическое определение типа ордера (Order Type)
Отложенные ордера (Pending Orders)
Рыночное исполнение (Market Execution)
Просто задайте допустимый уровень риска и настройте желаемые уровни входа, Stop Loss и Take Profit. Система автоматически рассчитает необходимые параметры сделки и отобразит тип ордера (Order Type), цену входа (Entry Price), размер лота (Lot Size), Stop Loss, Take Profit, риск (Risk) и RR прямо на графике.
Если у вас возникнут неудобства или вопросы при использовании продукта, пожалуйста, в любое время свяжитесь со мной через систему личных сообщений MQL5.
Спасибо за ваше доверие и поддержку. Желаем вам дальнейших успехов в торговле! Мы продолжим совершенствовать и улучшать наш продукт, чтобы обеспечить вам максимально комфортный торговый опыт.





















































It’s been about half a year since I bought it? I can’t remember exactly, but I open it every time I trade, and it’s really useful. However, it occasionally closes due to errors when switching between different timeframes. Overall, it’s still very good—keep up the support!