Open Day and ATR


Информационный индикатор, показывающий самые важные торговые уровни для внутридневной торговли, и не только.

О понятии уровней «Поддержка» и «Сопротивление».


Всем известно, что исторический ценовой диапазон цен состоит из уровней от которых в прошлом, были значимые движения.
И уровни работающие в прошлом, наверняка будут работать и сейчас. К примеру, уровень, находящийся снизу текущей цены
является уровнем «Поддержки», если от него ранее было значительное движение. К примеру, уровень, находящийся сверху
текущей цены, от которого был отскок вниз, является уровнем «Сопротивления».

В торговом терминале MetaTrader4 стандартные временные метки отображаются только по началу нового дня.
В данном индикаторе я отобразил четыре начала, четырёх дней. А также максимумы и минимумы, а также АТР каждого дня.


Работа индикатора.

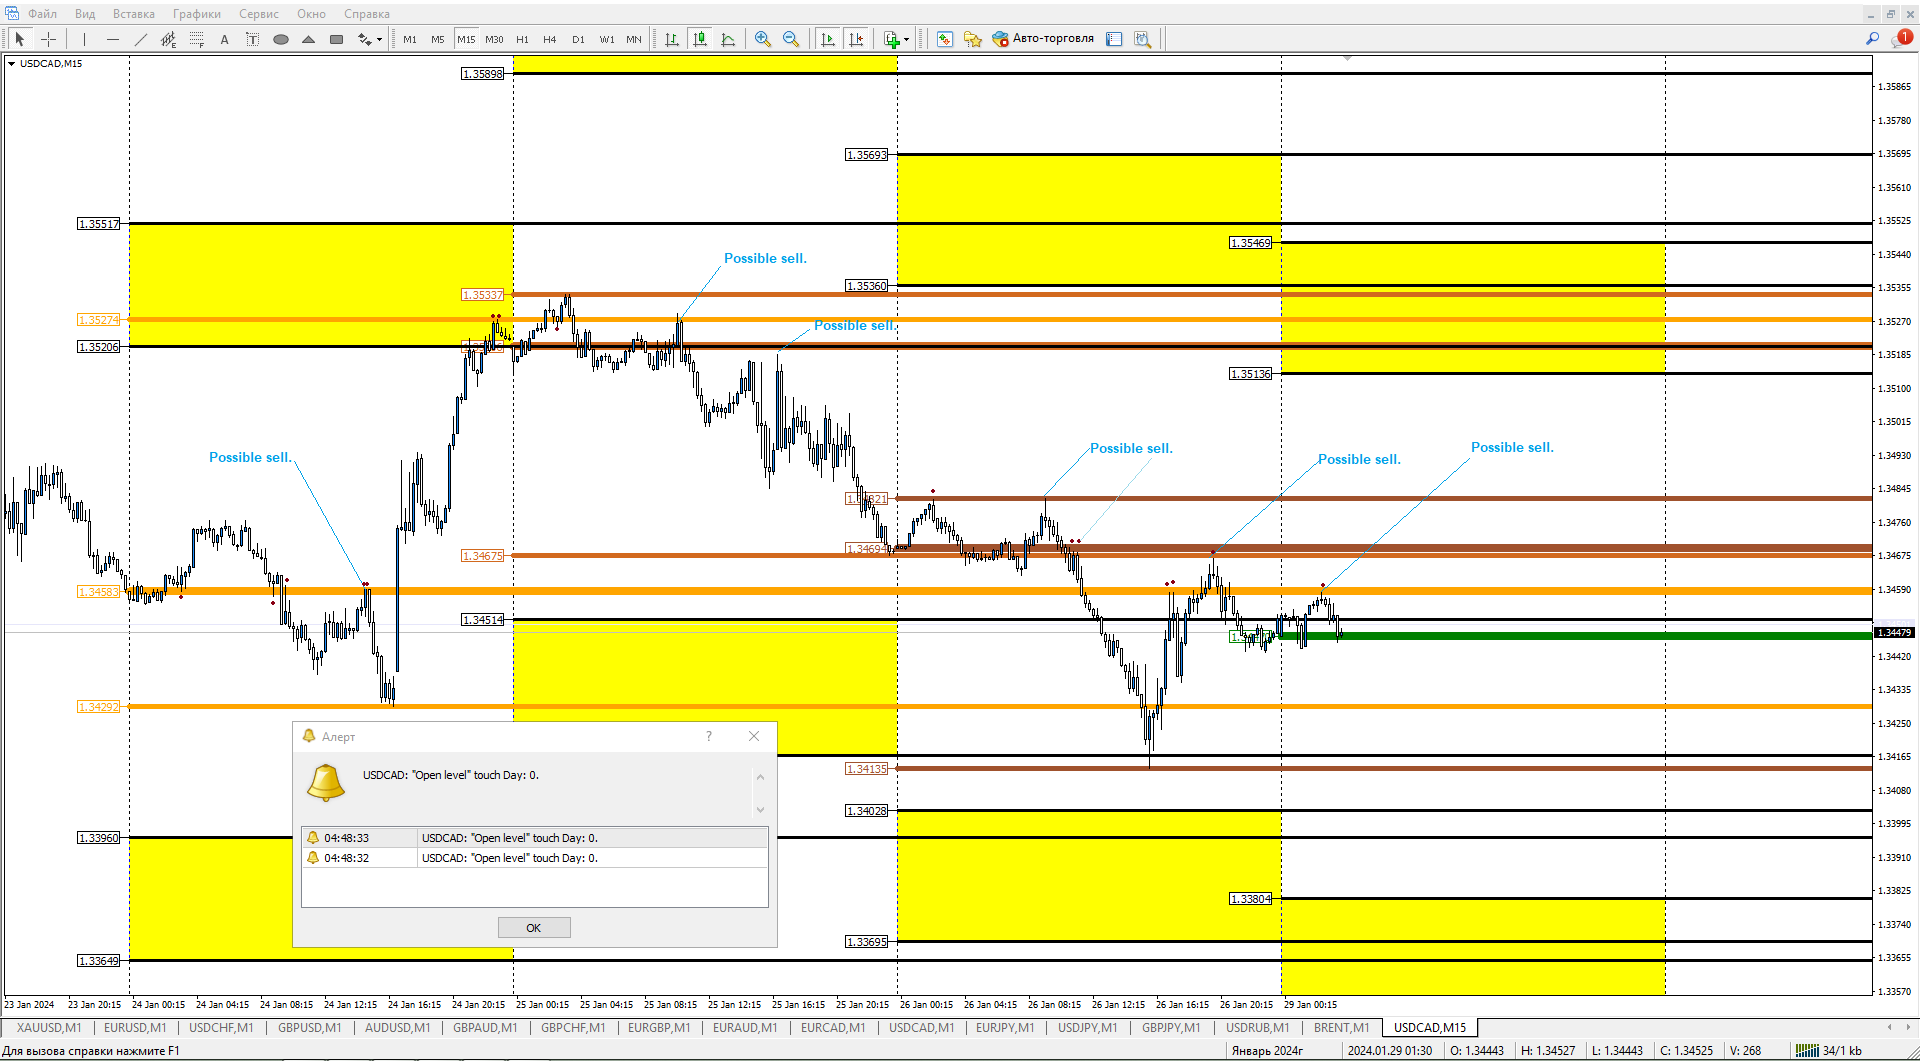
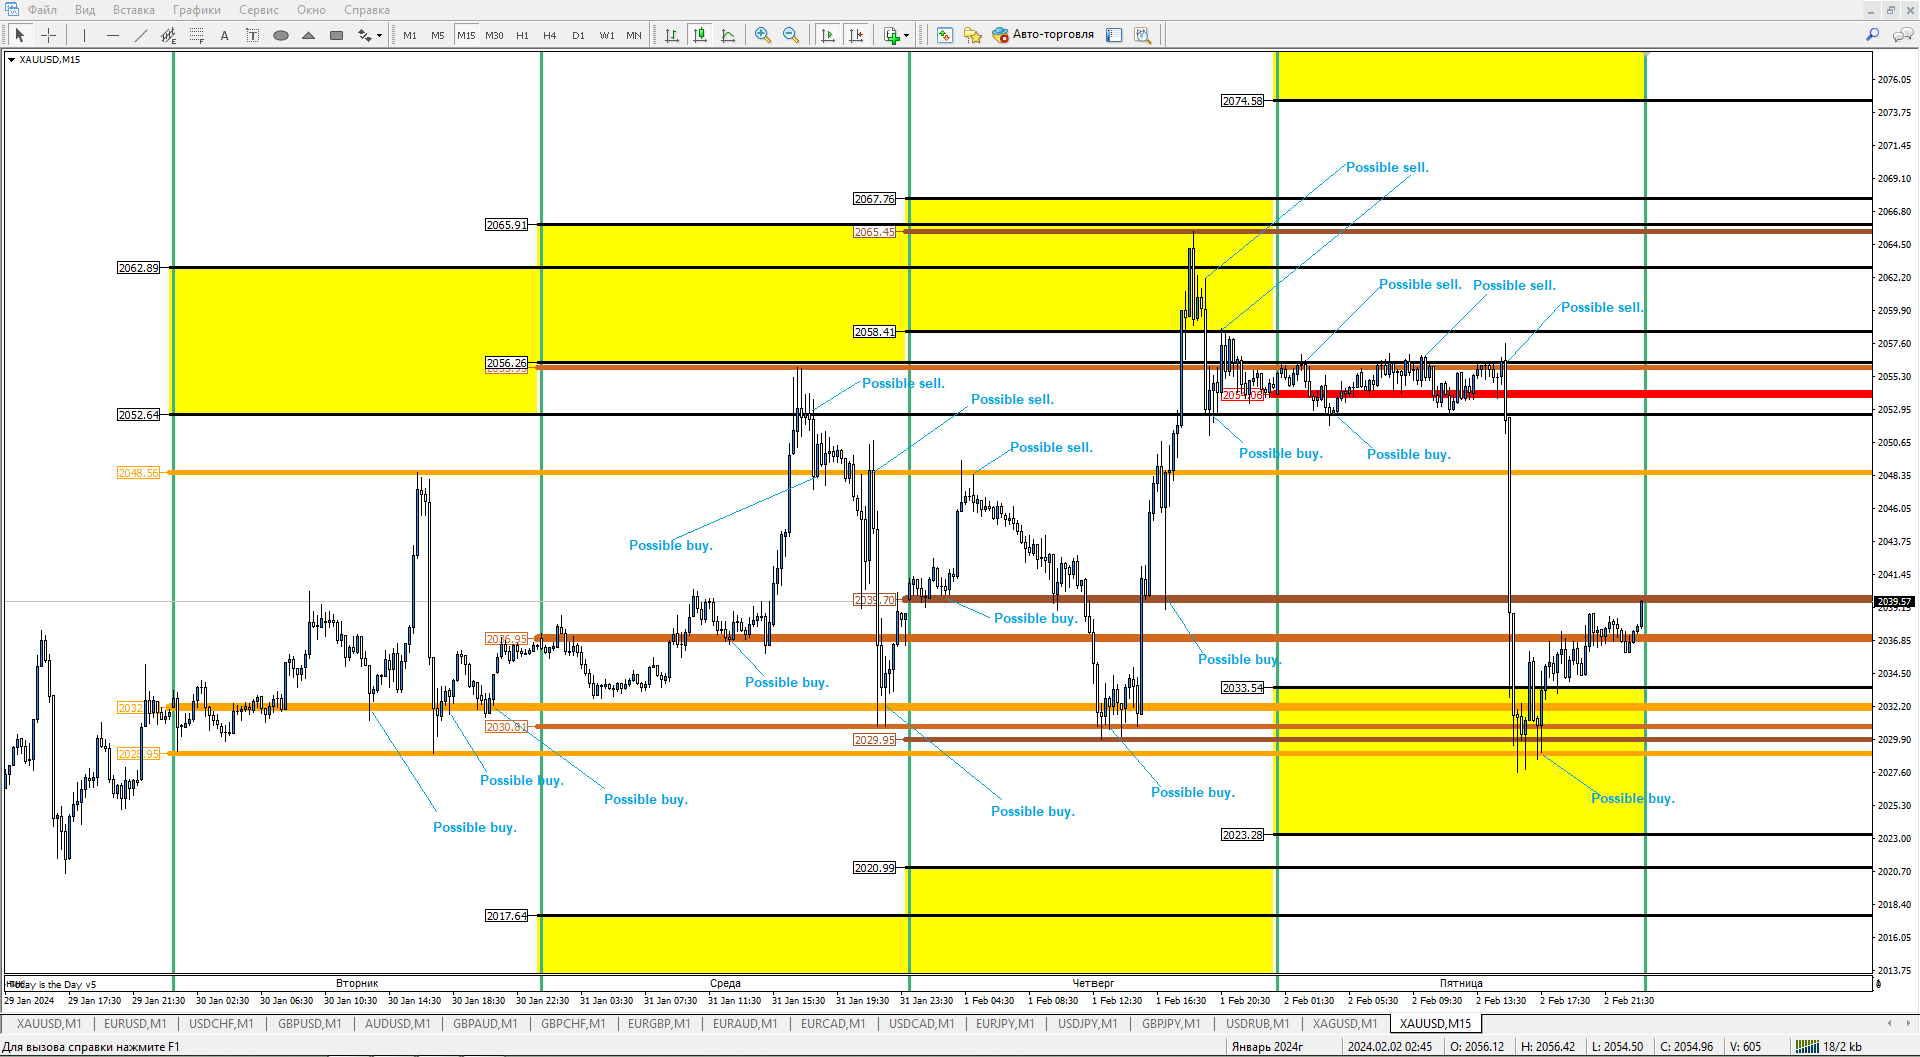
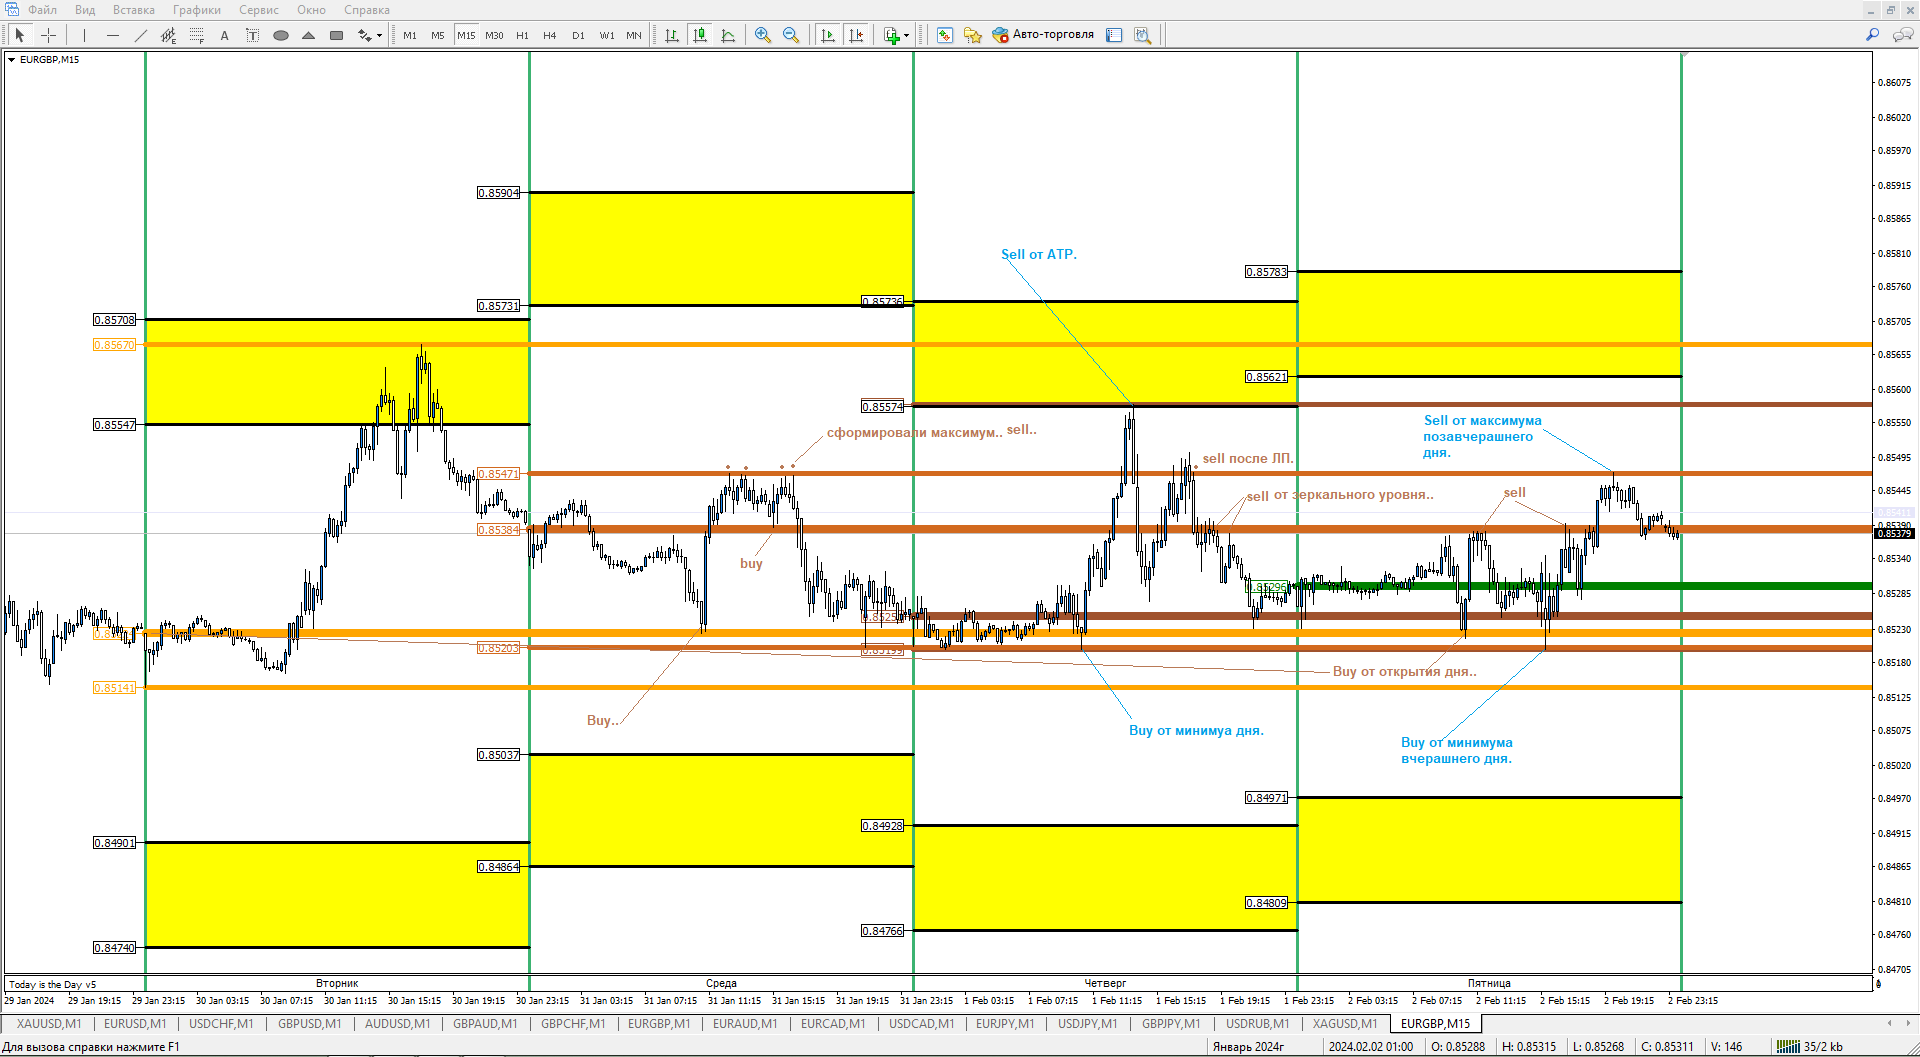
Данный индикатор наглядно на графике показывает: начало, максимумы и минимумы торговых дней. А также визуально
показывает запас хода по инструменту (АТР), прошедших трёх дней. При добавлении индикатора на график, индикатор
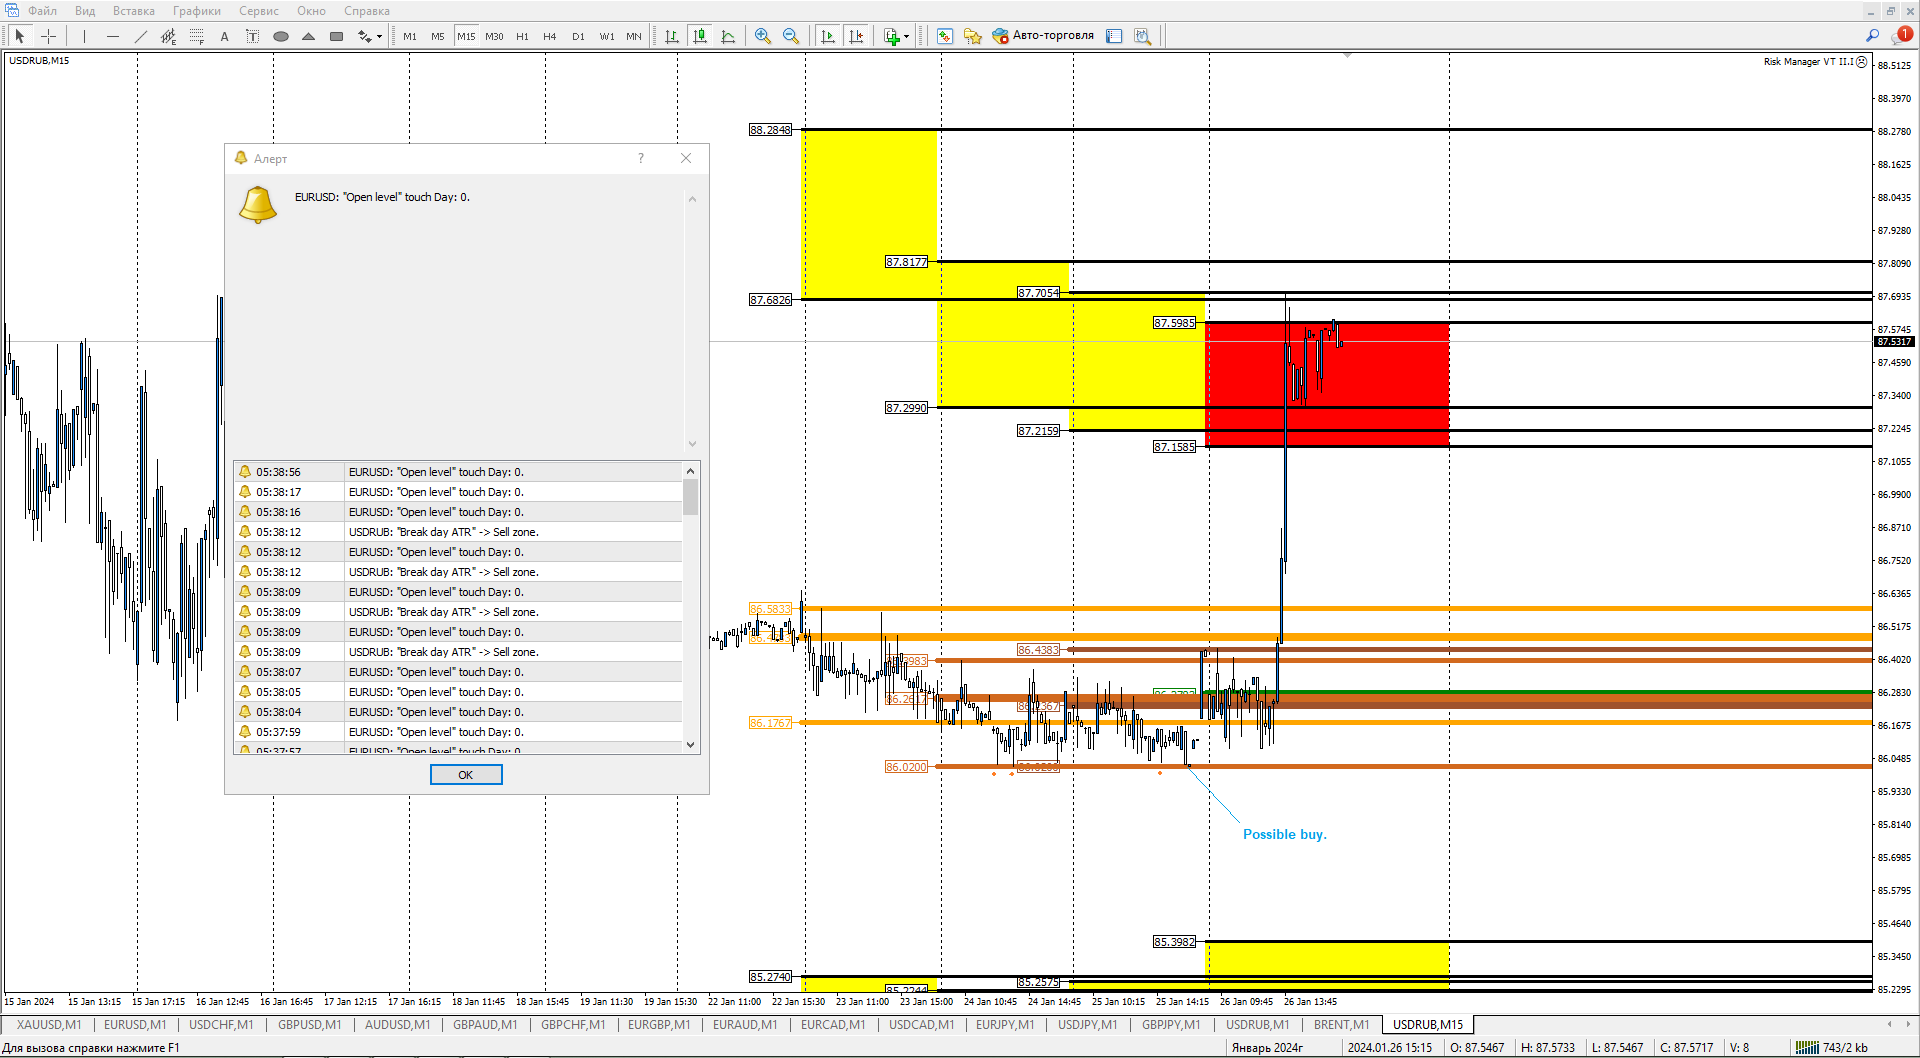
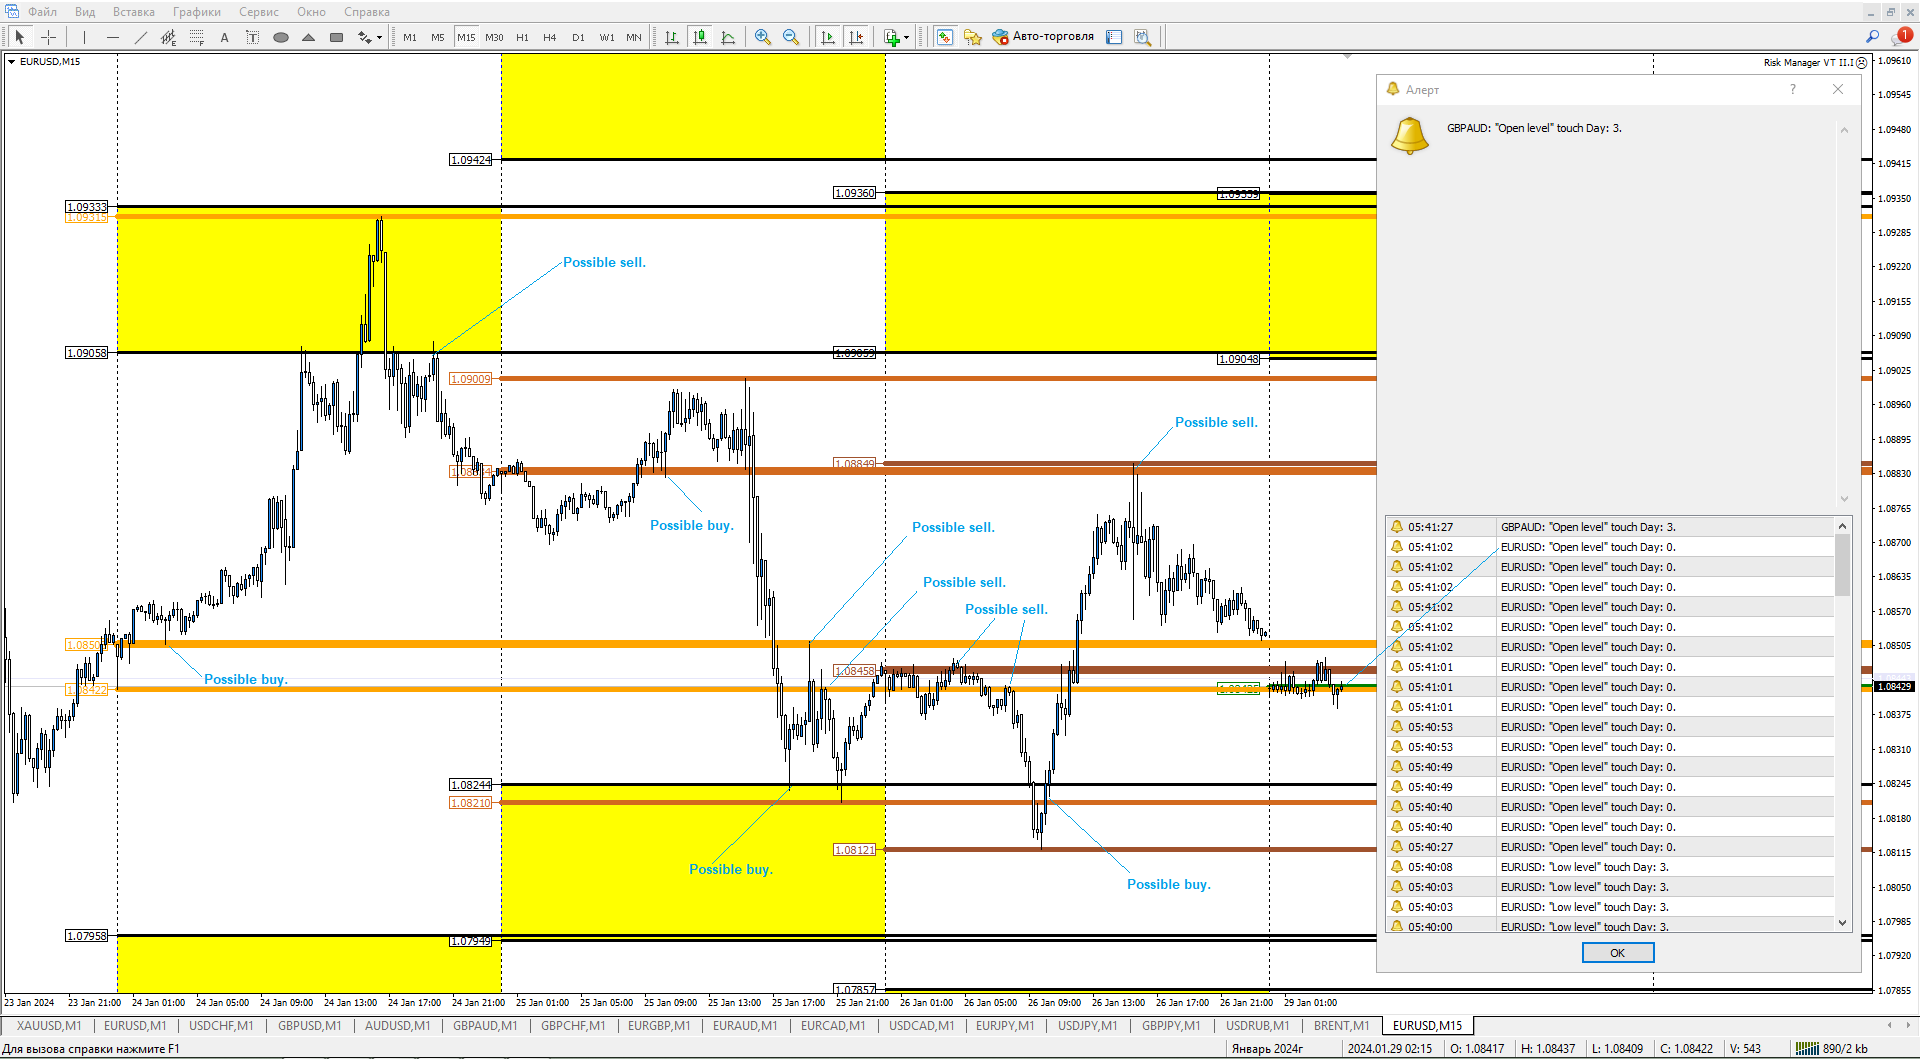
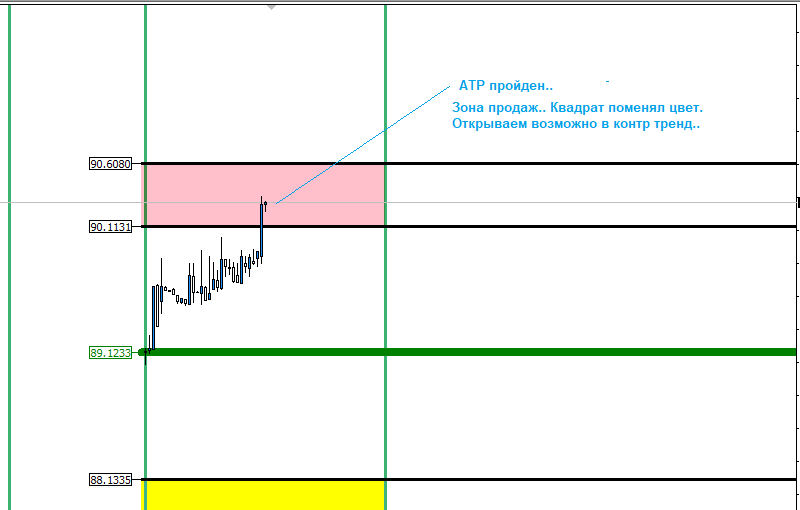
размещает графические объекты, относящиеся к ближайшим торговым дням. Жёлтый ценовой диапазон (прямоугольник)
показывает запас хода по инструменту (АТР). Горизонтальные ценовые уровни показывают уровни открытия текущего дня
и ещё три дня в историю.

Цвет уровней, ценовых меток и стили всех графических объектов можно менять во входных параметрах.
Индикатор очень упрощает понимание графика и движения цен за четыре дня.

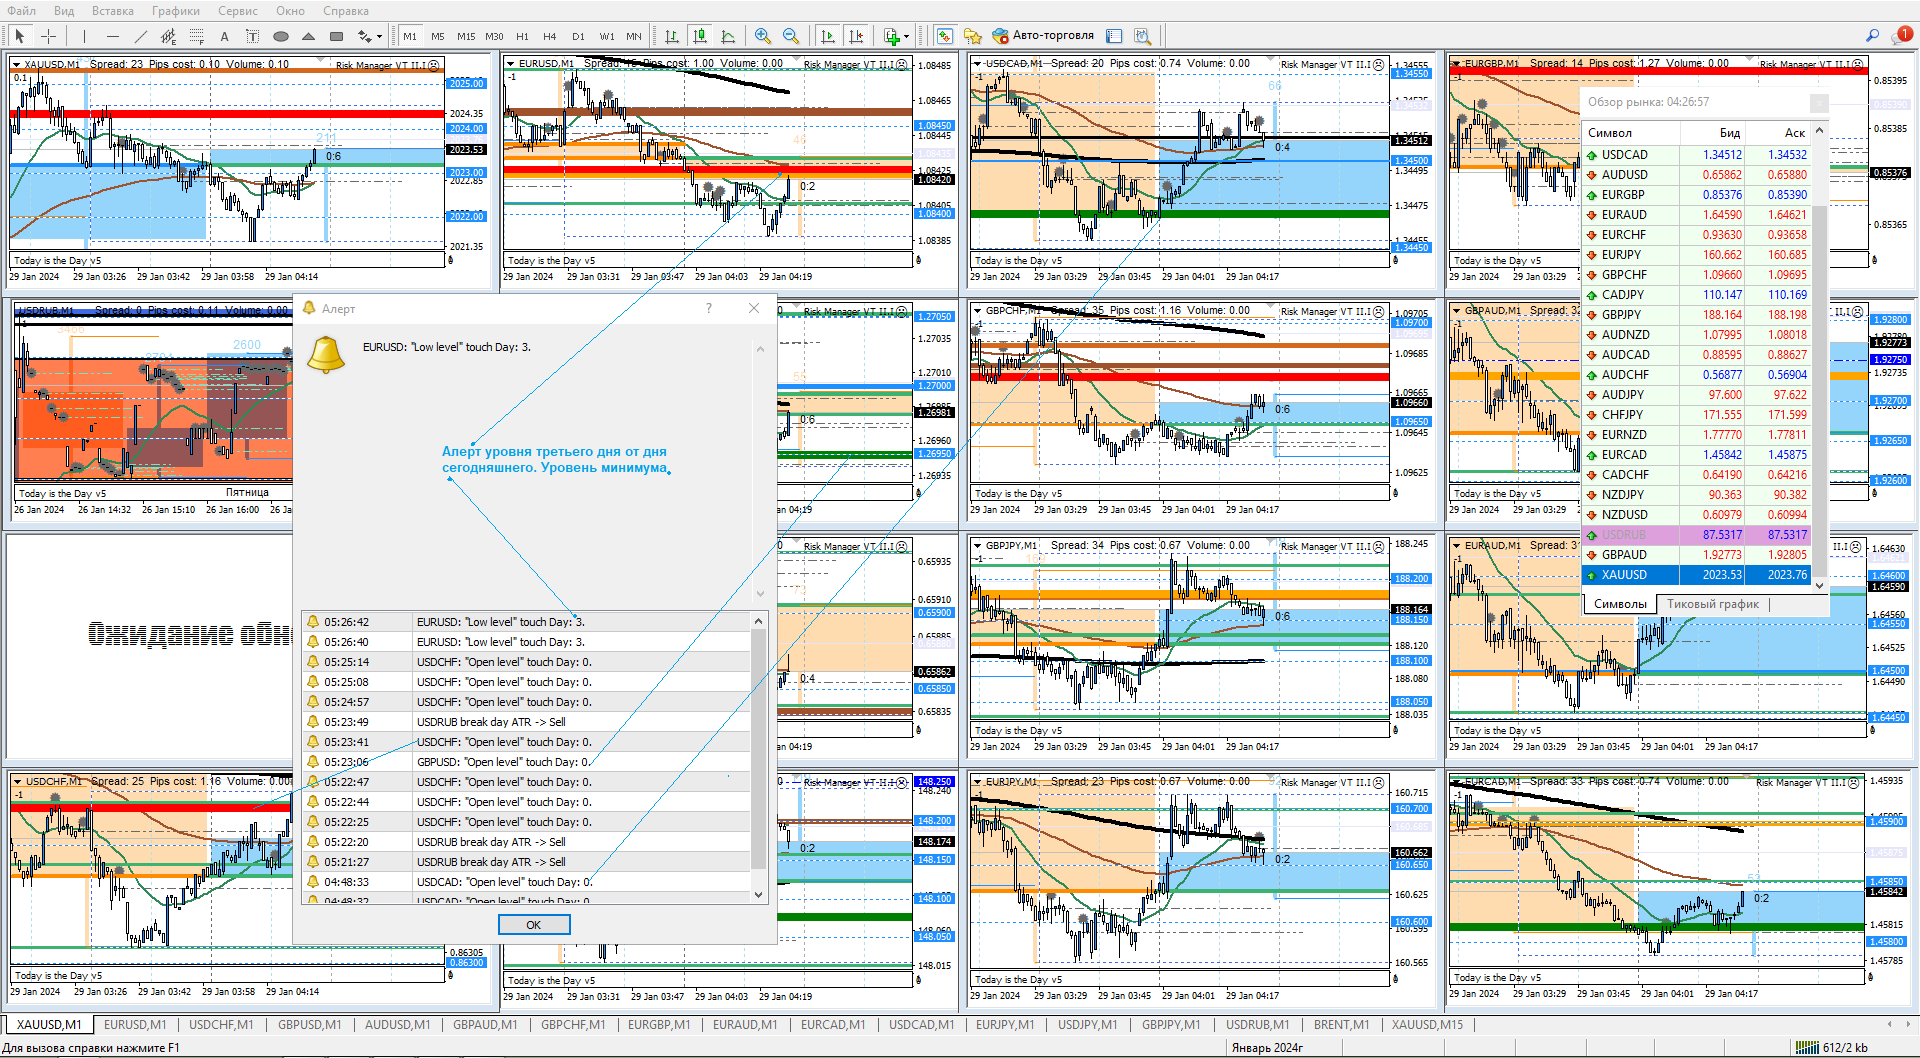
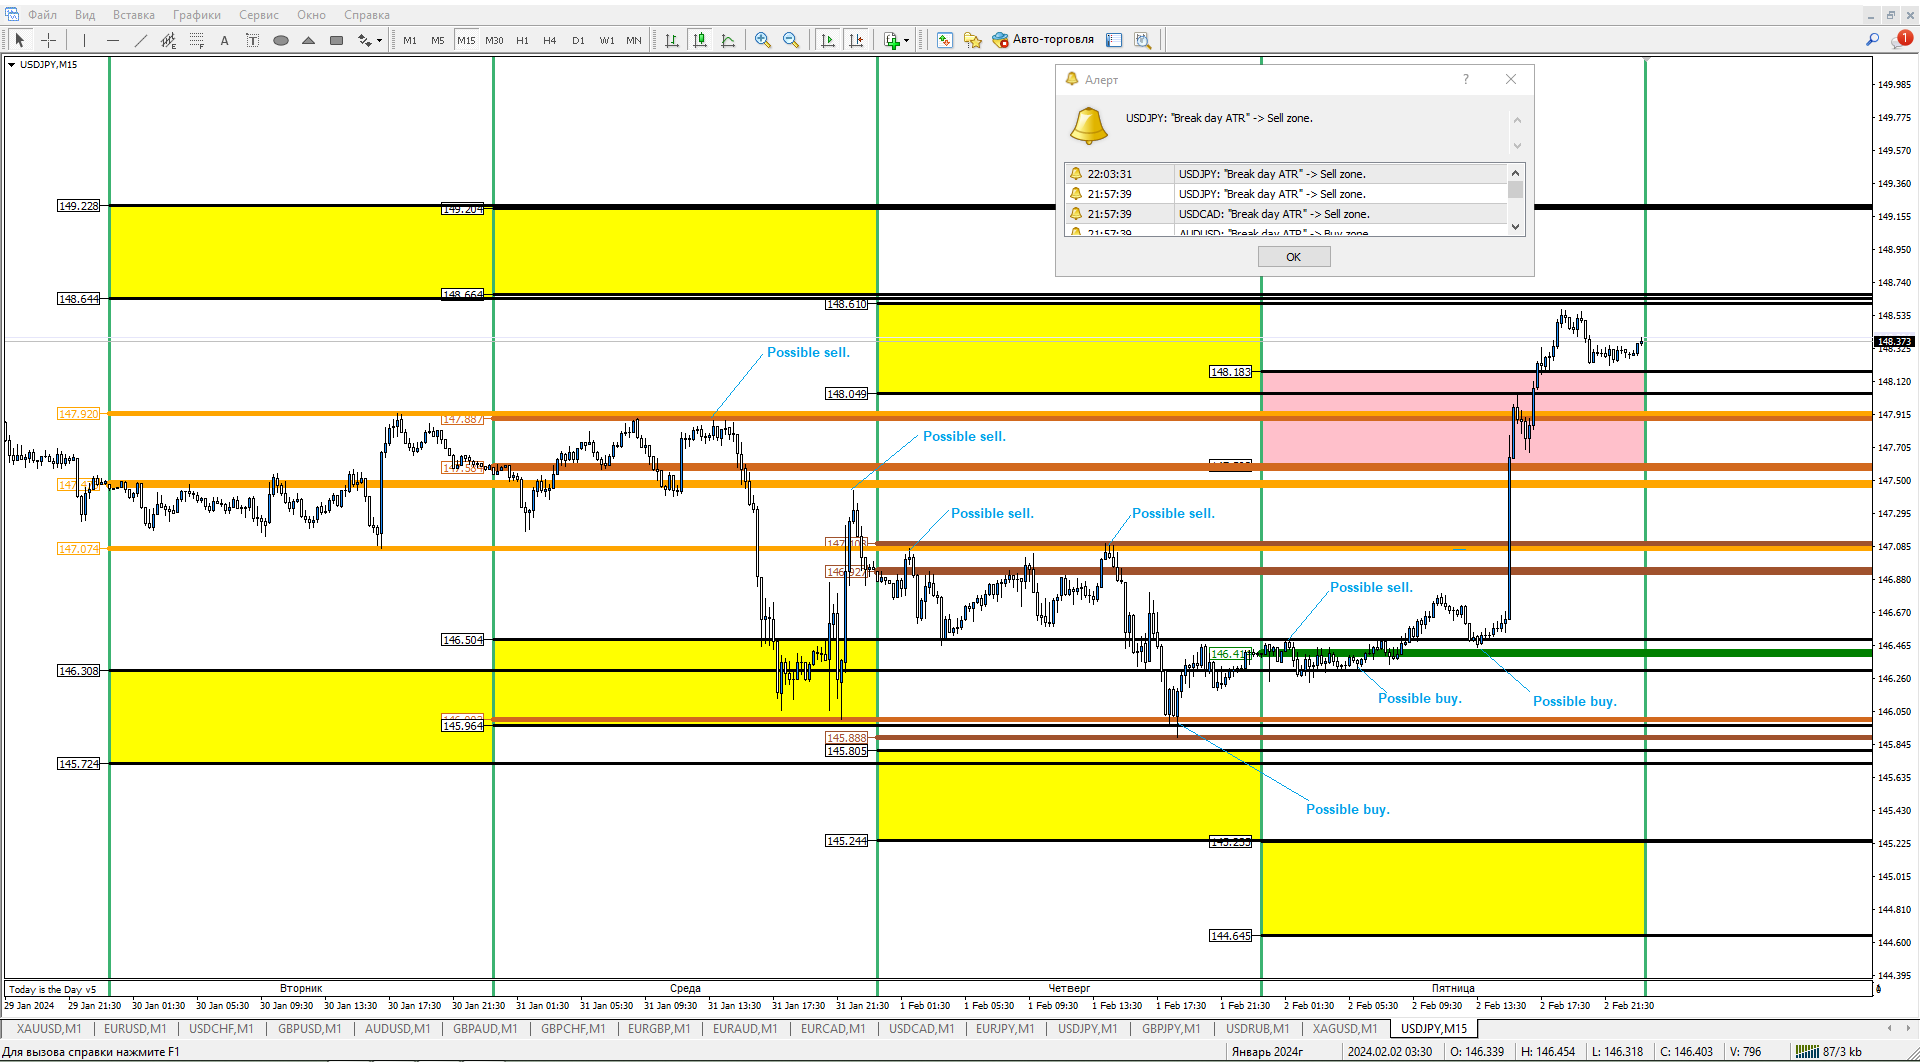
Данные уровни, как и любые другие уровни «Поддержки и Сопротивления» очень важны. Для того чтобы не упустить хорошую точку
входа в рынок, в данном индикаторе сделан, Визуальный и Звуковой Алерты.

АТР – среднее историческое значение, хода, валютного инструмента за предыдущие дни в пунктах. Считается, по следующей методике:
Замеряем расстояние между минимумом и максимумом предыдущего дня, также замеряем расстояние позавчерашнего дня..
И также замеряем расстояние между минимумами и максимумами на несколько дней в историю, складываем значения и делим
 на количество размеренных дней. Предыдущих дней. Это и будет является среднем значением запаса хода по валютному инструменту сегодня.
По умолчанию индикатор сам считает и отображает уровни АТР за 10 рабочих дней (жёлтый прямоугольник). Запас хода - расстояние от открытия,
 сегодняшнего дня, до жёлтого прямоугольника, сверху или снизу, текущей цены внутри сегодняшнего дня.


Некоторые параметры индикатора:

  • Number of Days to calculate all day ATR:  Количество дней для подсчёта АТР, по умолчанию: 10.
  • Price Tag all horizontal levels (on/off): – Показывать или не показывать ценовые метки горизонтальных уровней, по умолчанию: true.

  • I).Show Open level and ATR "Current Day" ( 0 ) level –  Показывать уровни текущего дня, по умолчанию: true.
  • II).Show Open High Low and ATR "Last Day" ( 1 ) level: - Показывать уровни вчерашнего дня, по умолчанию: true.
  • III).Show Open High Low and ATR "Second Day" ( 2 ) level: –  Показывать уровни позавчерашнего дня, по умолчанию: true.
  • IV).Show Open High Low and ATR "Third Day" ( 3 ) level: - Показывать уровни три дня в историю, по умолчанию: true.

  • Alert touch all levels (on/off): - Включить Алерт прикосновения всех уровней, по умолчанию: true.
  • Alert ( Color Signal ) touch all levels: - Включить Цветовой Алерт прикосновения всех уровней, по умолчанию: Aqua. Т.е. меняется цвет фона графика,
    при прикосновении текущей ценой, линией 
    bid уровней индикатора.
    0 - день текущий.
    1 - день вчерашний.
    2 - день позавчерашний. 
    3 - день четвёртый в историю от текущего. 


Примечание
: Таже в индикаторе можно менять: цвет, толщину и стиль всех линий. Возможные варианты отображения, на скринах в описании индикатора.

Важно в помощь трейдеру: Если за вчерашний день АТР не был пройден, то сегодня есть большая вероятность того, что дойдём до вчерашнего уровня АТР.

И помним: На уровне поддержки - покупаем, на уровне сопротивлении - продаём. Стопы прячем за уровень, от которого была открыта сделка. Рекомендуемый размер (
sl): два спреда. 


Recommended products
Double HMA lines MTF
Pavel Zamoshnikov
5 (1)
This is a multi-timeframe version of the popular Hull Moving Average (HMA). The Double HMA MTF Light indicator combines two timeframes on a single chart. The HMA of the higher timeframe defines the trend, and the HMA of the current timeframe defines short-term price movements. The indicator is freely distributed and hasn't audio signals or messages. Its main function is the visualization of price movements. If you need advanced functionality of the HMA multi-timeframe indicator (information ab
FREE
Auto Fibo Pro m
DMITRII GRIDASOV
"Auto FIBO Pro"   Crypto_Forex  indicator  - is great auxiliary tool in trading! Indicator automatically calculate and place on chart Fibo levels and local trend lines (red color). Fibonacci levels indicate key areas where price can reverse. Most important levels are 23.6%, 38.2%, 50% and 61.8%. You can use it   for reversal scalping  or for zone grid trading. There are plenty of opportunities to  improve your current system using Auto FIBO Pro indicator as well. It has Info Spread Swap Displa
Extremum Reverse Bar
Yurij Izyumov
2.8 (5)
This indicator has been created for finding the probable reversal points of the symbol price. A small candlestick reversal pattern is used it its operation in conjunction with a filter of extremums. The indicator is not redrawn! If the extremum filter is disabled, the indicator shows all points that have a pattern. If the extremum filter is enabled, the condition works – if the history Previous bars 1 candles back contains higher candles and they are farther than the Previous bars 2 candle, such
FREE
Price Magnet — Price Density and Attraction Levels Indicator Price Magnet is a professional analytical tool designed to identify key support and resistance levels based on statistical Price Density. The indicator analyzes a specified historical period and detects price levels where the market spent the most time. These zones act as “magnets,” attracting price action or forming a structural base for potential reversals. Unlike traditional Volume Profile tools, Price Magnet focuses on price-time d
The new update makes this indicator a complete tool for studying, analyzing and operating probabilistic patterns. It includes: On-chart Multi-asset percentage monitor. Configurable martingales. Twenty-one pre-configured patterns , including Mhi patterns and C3. An advanced pattern editor to store up to 5 custom patterns. Backtest mode to test results with loss reports. Trend filter. Hit operational filter. Martingale Cycles option. Various types of strategies and alerts. Confluence between patte
Trend Ray
Andriy Sydoruk
The indicator shows the potential trend direction by cyclical-wave dependence. Thus, all the rays of the intersection will be optimal rays, in the direction of which the price is expected to move, taking into account the indicator period. Rays can be used as a direction for potential market movement. But we must not forget that the approach must be comprehensive, the indicator signals require additional information to enter the market.
EARLY REMINDER: The Starting price is 65 price will rise soon up to 365$ and then 750$ after first 10 copies of sales. Grab this offer now! Introduction Hello, traders! Welcome to the demonstration of the Forex Beast Indicator , a comprehensive tool designed to assist aspiring traders in navigating the complexities of the forex market. This indicator incorporates seven essential components to provide a well-rounded trading experience: Moving Averages Colored Zones Support and Resistance Levels
High Low Open Close MT4
Alexandre Borela
4.81 (21)
If you like this project, leave a 5 star review. This indicator draws the open, high, low and closing prices for the specified period and it can be adjusted for a specific timezone. These are important levels looked by many institutional and professional traders and can be useful for you to know the places where they might be more active. The available periods are: Previous Day. Previous Week. Previous Month. Previous Quarter. Previous year. Or: Current Day. Current Week. Current Month. Current
FREE
Night ghost
Dmitriy Kashevich
Night Ghost - Arrow indicator for binary options. This is a reliable assistant to you in the future! - No redrawing on the chart -Works great on EUR/USD currency pairs! -Indicator accuracy up to 90% (Especially at night) -No long setup required (Perfectly set up for Binary Options) - Not late signals - The appearance of a signal on the current candle -Perfect for M1 period (No More!) - Eye-friendly candle color (Red and Blue) -Installed Alert Working with it: - Blue arrow shows signa
Free automatic Fibonacci is an indicator that automatically plots a Fibonacci retracement based on the number of bars you select on the BarsToScan setting in the indicator. The Fibonacci is automatically updated in real time as new highest and lowest values appears amongst the selected bars. You can select which level values to be displayed in the indicator settings. You can also select the color of the levels thus enabling the trader to be able to attach the indicator several times with differe
FREE
Market Profile
Artem Titarenko
5 (1)
The "Market Profile" indicator displays the profiles and volumes of periods – weekly, daily, session (8-hour), 4-hour, hour, summary. The VAH/VAL price area is automatically highlighted by a dotted line for each profile (except for the summary). The indicator includes chroma Delta, which colors the profile areas. The areas of prevailing Buys is colored in green, that of Sells - in red. The intensity histogram features blue/red respectively. In the filter mode, the indicator displays the volume a
The indicator allows you to trade binary options. The recommended time frame is М1 and the expiration time is 1,2,3 minutes. The indicator suitable for auto and manual trading. A possible signal is specified as a arrows above/under a candle. You should wait until the candle closes! Arrows are not re-painted Trade sessions: TOKYO section (Half-end) Currency pairs: USD/JPY Working time frame: M1 Expiration time: 1,2,3 minutes. The indicator also shows good results when using the martingale strateg
FREE
VR Cub
Vladimir Pastushak
VR Cub is an indicator for getting high-quality entry points. The indicator was developed to facilitate mathematical calculations and simplify the search for entry points into a position. The trading strategy for which the indicator was written has been proving its effectiveness for many years. The simplicity of the trading strategy is its great advantage, which allows even novice traders to successfully trade with it. VR Cub calculates position opening points and Take Profit and Stop Loss targe
Smart FVG Indicator MT4   delivers professional Fair Value Gap (FVG) detection, monitoring, and alerting directly on your charts. It combines   ATR-based filtering   with structure-aware logic to remove noise, adapt to liquidity, and keep only the most relevant imbalances for precise decisions. Key Advantages Accurate FVG detection:   Identifies genuine inefficiencies, not just simple candle gaps. ATR-based precision:   Adaptive sensitivity filters out low-quality signals across markets and time
FREE
Spread and Close MT4
Alexander Denisovich Jegorov
Spread & Candle Close Timer Indicator for MT4  Optimize your trading with this lightweight and efficient indicator, designed to display the real-time spread and candle close countdown directly on your MT4 chart. Features: Live Spread Monitoring – Instantly see market conditions. Candle Close Timer – Stay prepared for the next price movement. Simple & Non-Intrusive Design – No unnecessary settings, just clear and accurate data. Ideal for scalpers, day traders, and those who need real-time exec
Rainbow MT4
Jamal El Alama
Rainbow MT4 is a technical indicator based on Moving average with period 34 and very easy to use. When price crosses above MA and MA changes color to green, it’s a signal to buy. When price crosses below MA and MA changes color to red, it’s a signal to sell. The Expert advisor ( Rainbow EA MT4) based on Rainbow MT4 indicator, as you can see in the short video below is now available here .
FREE
"Dynamic Scalping Oscillator" - is an advanced custom Crypto_Forex indicator - efficient Trading tool for MT4!  - New generation of Oscillators - see pictures to check how to use it. - Dynamic Scalping Oscillator has adaptive Oversold/Overbought zones. - Oscillator is an auxiliary tool to find exact entry points from dynamic OverSold/OverBought areas. - Oversold values: below Green line, Overbought values: over Orange line . - This indicator is great to combine with Price Action patterns as we
Traditional MACD MT4
Daniel Lewis
4.58 (55)
MACD indicator in MetaTrader 4/5 looks different than MACD does in most other charting software. That is because the MetaTrader 4/5 version of MACD displays the MACD line as a histogram when it is traditionally displayed as a line. Additionally, the MetaTrader 4/5 version computes the Signal line using an SMA, while according to MACD definition it is supposed to be an EMA. The MetaTrader 4/5 version also does not compute a true MACD Histogram (the difference between the MACD/Signal lines). This
FREE
ENTRY AND EXIT ARROWS Indicator – Description The Entry and Exit Arrows indicator is a simple yet effective momentum-based tool designed to highlight potential buy and sell opportunities directly on the chart using visual arrows. It works by comparing two internal momentum measurements with different sensitivities. When both measurements align in the same direction, the indicator confirms a stronger directional bias and plots a signal. How It Works Buy Signal (Lime Arrow Below Candle): Appea
Adjustable Consecutive Fractals  looks for 2 or more fractals in one direction and sends out a on screen alert, sound alert and push notification, for strong reversal points . Adjustable Consecutive Fractals, shows the fractals on chart along with a color changing text for buy and sell signals when one or more fractals appear on one side of price. Adjustable Consecutive Fractals is based Bill Williams Fractals . The standard Bill Williams fractals are set at a non adjustable 5 bars, BUT withe th
PZ Penta O MT4
PZ TRADING SLU
2.33 (3)
The Penta-O is a 6-point retracement harmonacci pattern which usually precedes big market movements. Penta-O patterns can expand and repaint quite a bit. To make things easier this indicator implements a twist: it waits for a donchian breakout in the right direction before signaling the trade. The end result is an otherwise repainting indicator with a very reliable trading signal. The donchian breakout period is entered as an input. [ Installation Guide | Update Guide | Troubleshooting | FAQ | A
FREE
Super Reversal Pattern
Parfait Mujinga Ndalika
Super Reversal Pattern Indicator Unlock the power of advanced pattern recognition with our Super Reversal Pattern Indicator. Designed for traders seeking precision and reliability, this indicator identifies one of the most effective reversal patterns in technical analysis, offering a significant edge in your trading strategy. Key Features: Non-Repainting Accuracy: Enjoy the confidence of non-repainting technology. Once a Super Reversal Pattern is detected, it remains static, providing consiste
SX Supply Demand Zones accurately identifies and draws high-probability Supply and Demand zones using a sophisticated algorithm. Unlike traditional indicators that clutter your chart, this indicator is designed with a focus on performance and a clean user experience. New Unique Feature: Interactive Legend System What truly sets this indicator apart from everything else is the Interactive Control Legend. You have a professional dashboard directly on your chart that allows you to: Show/Hide: Ins
FREE
Hammer Shooting Star v1.1 – Advanced Candlestick Pattern Scanner Author: LIANG1990 Are you searching for a reliable tool to identify market reversals with precision? Hammer Shooting Star v1.1  is a professional MT4 indicator designed to scan and detect high-quality Hammer and Shooting Star candlestick formations. Unlike basic pattern indicators, this tool applies multiple built-in filters (shape, size, trend alignment, and contextual conditions) to reduce false signals and highlight only the cle
Trendline indicator
David Muriithi
2 (1)
Are you tired of drawing trendlines every time you're analyzing charts? Or perhaps you would like more consistency in your technical analysis. Then this is for you. This indicator will draw trend lines automatically when dropped on a chart. How it works Works similar to standard deviation channel found on mt4 and mt5. It has 2 parameters: 1. Starting Bar 2. Number of bars for calculation The   starting bar   is the bar which drawing of the trend lines will begin, while the   number of bars for c
FREE
Your Good Friends — this is not just an indicator, but your reliable trading assistant, designed for traders who value simplicity, clarity, and stability. It combines the best classic methods of technical analysis — support and resistance levels, reversal signals, visual cues — and presents them in the clearest, most user-friendly format possible. Suitable for both beginners and experienced traders — especially those who want to eliminate chaos, reduce stress, and trade based on clear signals.
Candle Countdown — Accurate Time to Close for MT4 Candle Countdown is a simple and precise tool that shows the remaining time until the current candle closes directly on the chart. When your entry depends on the candle close, even a few seconds matter. This indicator helps you see the exact time and make decisions without rushing or guessing. An indicator for precise control over candle closing time. The indicator displays: time remaining until candle close current server time spread Stop Level
FREE
GANN Forecaster – Precision Tool for Forex Traders (MT4) Elevate your trading with the Gann Forecaster Scanner for MetaTrader 4. This powerful, interactive tool provides precise price and time projections, giving you a professional edge across Forex, Gold, Indices, and Crypto markets. Building on the robust functionality of the Gann Forecaster indicator, this advanced scanner offers multi-pair analysis, continuously calculating Gann levels and alerting you to optimal trade entry points. A clea
SMA Indicator
Nitu Brijesh Yadav
Arrow Indicator (Buy/Sell Alerts) – Simple Yet Powerful Tool!             Product Version: 1.01           Indicator Type: Trend Reversal Signals           Timeframes Supported: All (Recommended: H1, H4, D1)           Key Features: Buy Signal: Green upward arrow () appears below the candle  Sell Signal : Red downward arrow () appears above the candle Accurate Trend Reversal Detection – Based on tried and tested SMA strategy. ️ Clean Chart View – Minimalist, non-i
FREE
Master Max
Abdulkarim Karazon
MASTER MA is a moving average cross based indicator, using 3 moving averages with different periods cross to generate signals, the strategy is very simple, but the indicator has stats dashboard that shows useful instant back test results such as win rate/total profits won…etc., this indicator has TP and SL inputs in points so you can have your TP and SL wanted visible on the chart in form of green dot for TP and red x for SL, the indicator will use those values to calculate win/loss percentage.
Buyers of this product also purchase
Scalper Inside PRO
Alexey Minkov
4.74 (69)
Scalper Inside PRO – Since 2020. An exclusive indicator that utilizes an innovative algorithm to swiftly and accurately determine the market trend. The indicator automatically calculates opening, closing, and profit levels, providing detailed trading statistics. With these features, you can choose the most appropriate trading instrument for the current market conditions. Additionally, you can easily integrate your own arrow indicators into Scalper Inside Pro to quickly evaluate their statistics
Quantum Breakout Indicator PRO
Bogdan Ion Puscasu
4.96 (26)
Introducing   Quantum Breakout PRO , the groundbreaking MQL5 Indicator that's transforming the way you trade Breakout Zones! Developed by a team of experienced traders with trading experience of over 13 years, Quantum Breakout PRO is designed to propel your trading journey to new heights with its innovative and dynamic breakout zone strategy. Quantum Breakout Indicator will give you signal arrows on breakout zones with 5 profit target zones and stop loss suggestion based on the breakout box. I
Apex Edge No Repaint Professional Non-Repainting Trading Indicator for MT4 Apex Edge No Repaint is a premium, clean, and reliable trading tool designed for serious forex and cryptocurrency traders who want clear signals without the frustration of repainting arrows. Key Features: 100% No Repaint – Signals remain fixed once they appear on the chart Dual signal system: RAW signals for early opportunities and CONF signals for high-probability confirmed entries Simple one-click toggle buttons: RAW ON
New Update of Smart Trend Trading System MT5 For  2026 Market: If You Buy this Indicator you will Get my Professional   Trade Manager + EA  for   FREE . First of all Its worth emphasizing here that this Trading System is   Non-Repainting   , Non Redrawing and Non Lagging Indicator   Which makes it ideal from both manual and robot trading .  [Online course] ,   [manual]   and   [download presets] . The Smart Trend Trading System MT5 is a comprehensive trading solution tailored for   new   and   e
This indicator has been designed to integrate with the Elliott Wave theory, providing two distinct methods of operation: Automatic Work: In this mode, the indicator operates autonomously by detecting all five motive waves on the chart according to Elliott Wave theory. It offers predictions and identifies potential reversal zones. Additionally, it has the capability to generate alerts and push messages to notify traders of significant developments. This automated functionality streamlines the pro
PZ Harmonacci Patterns
PZ TRADING SLU
3.17 (6)
Trade smarter, not harder: Empower your trading with Harmonacci Patterns This is arguably the most complete harmonic price formation auto-recognition indicator you can find for the MetaTrader Platform. It detects 19 different patterns, takes fibonacci projections as seriously as you do, displays the Potential Reversal Zone (PRZ) and finds suitable stop-loss and take-profit levels. [ Installation Guide | Update Guide | Troubleshooting | FAQ | All Products  ] It detects 19 different harmonic pric
Please send me Direct message on MQL5 CHAT after purchasing the Indicator for Training and Installation Support There are some additional files that is important to use with the Indicator . So be sure to contact me after purchasing the Indicator So that I can add you for training and support . If you find any difficulty with installation then send me Direct message here So that I can connect with you via Anydesk or Teamview for the product installation. " Smart Order Block Indicator " to find m
GoldRush Trend Arrow Signal V1.6 The GoldRush Trend Arrow Signal indicator V1.6 continues to provide precise, real-time trend analysis tailored for high-speed, short-term scalpers in XAU/USD , but it now has additional features and improved efficiency and reliability. Built specifically for the 1-minute time frame, this tool displays directional arrows for clear entry points, allowing scalpers to navigate volatile market conditions with confidence. The indicator consists of PRIMARY and SECONDARY
The " Dynamic Scalper System " indicator is designed for the scalping method of trading within trend waves. Tested on major currency pairs and gold, compatibility with other trading instruments is possible. Provides signals for short-term opening of positions along the trend with additional price movement support. The principle of the indicator. Large arrows determine the trend direction. An algorithm for generating signals for scalping in the form of small arrows operates within trend waves.
PZ Trend Trading
PZ TRADING SLU
4.8 (5)
Capture every opportunity: your go-to indicator for profitable trend trading Trend Trading is an indicator designed to profit as much as possible from trends taking place in the market, by timing pullbacks and breakouts. It finds trading opportunities by analyzing what the price is doing during established trends. [ Installation Guide | Update Guide | Troubleshooting | FAQ | All Products ] Trade financial markets with confidence and efficiency Profit from established trends without getting whips
GOLD Impulse with Alert
Bernhard Schweigert
4.67 (12)
This indicator is a super combination of our 2 products  Advanced Currency IMPULSE with ALERT  and  Currency Strength Exotics . It works for all time frames and shows graphically impulse of strength or weakness for the 8 main currencies plus one Symbol! This Indicator is specialized to show currency strength acceleration for any symbols like Gold, Exotic Pairs, Commodities, Indexes or Futures. Is first of its kind, any symbol can be added to the 9th line to show  true currency strength accelerat
PZ Turning Points MT4
PZ TRADING SLU
1 (1)
Identify key turning points with reliable fractal analysis This indicator examines the price structure of fractals of different periods to determine possible reversal points in the market, providing timing to positional traders that already have a fundamental or technical valuation model. Unlike its younger brother, Reversal Fractals , this indicator won't miss reversals because of the period selected, and will find reversal fractals on a zig-zag fashion, ignoring those reversals which do not
PZ Support Resistance
PZ TRADING SLU
3.33 (3)
Unlock key market insights with automated support and resistance lines Tired of plotting support and resistance lines? This is a multi-timeframe indicator that detects and plots supports and resistance lines in the chart with the same precision as a human eye would. As price levels are tested over time and its importance increases, the lines become thicker and darker, making price leves easy to glance and evaluate. [ Installation Guide | Update Guide | Troubleshooting | FAQ | All Products ] Boos
They say history repeats itself. What if you could prove it in real-time? The Propfolio Ghost Pattern is an advanced algorithmic pattern-matching engine. It empowers you to select any current price action structure on your chart and instantly scan thousands of historical candles to find the exact moment in the past where the market did the exact same thing. Once it finds the highest probability match, it projects the historical outcome into the future as "Ghost Candles"—giving you a highly calcu
CURRENTLY 26% OFF !! This indicator is a super combination of both our main indicators ( Advanced Currency Strength 28 &  Advanced Currency IMPULSE with ALERT ). It shows Currency Strength values for TICK-UNITS and alert signals for 28 Forex pairs. 11 different Tick-Units can be used. Those are 1, 2, 3, 4, 5, 6, 10, 12, 15, 20, and 30 Seconds. The Tick-Unit bar in the sub-window will be shown and shifted to the left when there is at least 1 tick within the second’s timer.  With only ONE chart y
Atomic Analyst
Issam Kassas
5 (5)
First of all Its worth emphasizing here that this Trading Indicator is   Non-Repainting , Non Redrawing and Non Lagging Indicator   Indicator, Which makes it ideal from both manual and robot trading.  User manual: settings, inputs and strategy . The Atomic Analyst  is a PA Price Action Indicator that uses Strength and Momentum of the price to find a better edge in the market. Equipped with Advanced filters which help remove noises and false signals, and Increase Trading Potential. Using Multiple
Technical indicator that structures charts and identifies cyclical price movements. Can work on any charts. Several types of alerts. There are additional arrows on the chart itself. Without redrawing on history, works on closing a candle. Recommended TF from M5 and higher. Easy to use and configure parameters. When using 2 indicators with different parameters, you can use without other indicators. Has 2 input parameters Cyclicality and Signal duration These 2 parameters work with the processin
KuKl
IGOR KIRIANEN
The indicator is built on a non-standard Zig Zag, it draws accumulations after which if the price leaves this zone and a test of this zone occurs, then a sound signal is given and an arrow appears - after the test candle closes.The indicator does not redraw its signals, it is very easy to use, there are only three settings 1- this is the zig zag parameter 2- this is the minimum price exit from the zone 3- this is the maximum price exit from the zone. The lower the parameter for Zig Zag, the more
Delta Fusion Pro
Francesco Secchi
5 (2)
Delta Fusion Pro – Advanced Order Flow Analysis for Intraday Trading Delta Fusion Pro is a professional indicator for MetaTrader 4 that reveals aggressive order flow, showing the intensity and direction of institutional pressure in real time. Unlike traditional volume indicators, it analyzes the delta between Ask and Bid volumes to anticipate reversals, confirm trends, and identify professional interest zones. Key Features Intelligent Auto-Tuning System Automatically adjusts all parameters ba
Gold PL MTF - this is a fine stock technical indicator. The indicator algorithm analyzes the movement of the asset price and automatically reflects the important Pivot Levels of the specified timeframe (TF) using the Fibonacci method (golden section). Live Signal of manual trading >>>   [ Click Here ] The indicator perfectly describes the price trajectory of the selected timeframe (day, week, month, year), determines the beginning of a trend and the beginning of a correction, which may develop i
Gold Venamax MT4
Sergei Linskii
3 (2)
Gold Venamax - this is a best stock technical indicator. The indicator algorithm analyzes the price movement of an asset and reflects volatility and potential entry zones. Live Signal of manual trading >>>   [ Click Here ] Indicator features: This is a super indicator with Magic and two Blocks of trend arrows for comfortable and profitable trading. Red Button for switching blocks is displayed on the chart. Magic is set in the indicator settings, so that you can install the indicator on two chart
RFI levels PRO
Roman Podpora
5 (1)
The indicator accurately shows the reversal points and price return zones where the   Major players . You see where new trends are forming and make decisions with maximum precision, maintaining control over every trade. VERSION MT5     -     Reveals its maximum potential when combined with the   TREND LINES PRO   indicator What the indicator shows: Reversal structures and reversal levels with activation at the beginning of a new trend. Display of   TAKE PROFIT   and   STOP LOSS   levels with mi
First of all Its worth emphasizing here that this Trading Tool is Non-Repainting Non-Redrawing and Non-Lagging Indicator Which makes it ideal for professional trading . [Online course] ,   and   [manual] The Smart Price Action Concepts Indicator is a very powerful tool for both new and experienced traders . It packs more than 20 useful indicators into one combining advanced trading ideas like Inner Circle Trader Analysis and Smart Money Concepts Trading Strategies . This indicator focuses on Sm
NAM Divergences
NAM TECH GROUP, CORP.
5 (1)
MT4 Multi-timeframe Divergence and Overbougt/Oversold detection indicator. Features - Fully customizable on chart control panel, provides complete interaction. - Hide and show control panel wherever you want. - Real time information about non-capitalized divergences. - Real time information about overbougt / oversold situations. - Real time information about regular divergences. - Real time information about hidden divergences. - Oscillators available for divergences detection: AO, RSI, CCI, MA
Super Signal – Skyblade Edition Professional No-Repaint / No-Lag Trend Signal System with Exceptional Win Rate | For MT4 / MT5 It works best on lower timeframes, such as 1-minute, 5-minute, and 15-minute charts. Core Features: Super Signal – Skyblade Edition is a smart signal system designed specifically for trend trading. It applies a multi-layered confirmation mechanism to detect only strong, directional moves supported by real momentum. This system does not attempt to predict tops or bottoms
RelicusRoad Pro
Relicus LLC
4.65 (106)
RelicusRoad Pro: Quantitative Market Operating System 70% OFF LIFETIME ACCESS (LIMITED TIME) - JOIN 2,000+ TRADERS Why do most traders fail even with "perfect" indicators? Because they trade Single Concepts in a vacuum. A signal without context is a gamble. To win consistently, you need CONFLUENCE . RelicusRoad Pro is not a simple arrow indicator. It is a complete Quantitative Market Ecosystem . It maps the "Fair Value Road" price travels on, distinguishing between random noise and true structur
The elite (V3) multi-indicator suite from JoaquinTrading specifically geared towards Forex & binary options, including regulated exchanges such Nadex, Cantor Exchange, and other binary option brokers. The Probability Tool Suite Elite will provide the given win/loss outcome probabilities of up to 10 strike levels, a specific expiration duration, based on a combination of up to 16 indicators, rules, or conditions and derivative behavior (i.e. expiry, touch, touch & retrace).  Using this indicato
KURAMA GOLD SIGNAL PRO (MT4) — Complete XAUUSD Trading System with 7-Layer Filter, Auto TP/SL, and Quality Scoring NON-REPAINTING. NON-REDRAWING. NON-LAGGING. Every signal is permanent. What you see is what you get. BONUS: Buy the lifetime license and receive AI Zone Radar ($59 value) + full PDF manual FREE. Message me after purchase. AI Zone Radar: https://www.mql5.com/en/market/product/175834 TRUSTED BY TRADERS: Already used by an active community of Gold traders. Praised for accuracy and
TPSpro RFI Levels
Roman Podpora
4.86 (28)
INSTRUCTIONS RUS   /   INSTRUCTIONS   ENG   -   VERSION  MT5 Main functions: Displays active zones of sellers and buyers! The indicator displays all the correct first impulse levels/zones for purchases and sales. When these levels/zones are activated, where the search for entry points begins, the levels change color and are filled with certain colors. Arrows also appear for a more intuitive perception of the situation. LOGIC AI - Display of zones (circles) for searching entry points when activa
Route Lines Prices is an indicator designed for finding price directions. Its simple interface contains multiple algorithms for price behavior and future direction calculations. These algorithms include volatility calculations and price smoothing based on the timeframes used. The indicator has a single parameter for changing the " Calculating Price Values " value. The default value of 1 provides a balanced automatic calculation, which can be used without manually configuring the indicator. By m
More from author
Spread and Cost pips
Alexander Shienkov
5 (2)
It is another simple information indicator. This indicator shows the current spread of a financial instrument and the value of one point with a volume of 0.10 lot. About the Spread Spread is the difference between the Ask and the Bid price of an asset in the stock or currency exchange. Let's refer to Central Banks and currency exchange in these banks, in order to understand why Spread is so important in currency trading. In Central Banks, we always see the difference between the buying and the
FREE
Today is the Day
Alexander Shienkov
5 (3)
This simple information indicator shows the name of the current day and past working days, months and years. On the concept of time and timeframe It is common knowledge that a timeframe is a time interval considered in technical analysis of free financial markets, during which the price and other market data changes occur when the price charts are plotted. In the MetaTrader 4 trading terminal, these periods are separated by vertical dashed line, which can be enabled or disabled by simply pressi
FREE
Indicator of vertical lines on the timeframes М5 and М1. It draws the lines for the period of the current day and the previous day. This indicator visualizes visually shows the trader the beginning and end of the chart hour, as well as the past hourly periods, 30-minute and 5-minute chart intervals. The advantage provided by this indicator is that the trader using this indicator on a chart of a currency pair with the smaller timeframe will always be aware of when the new hour begins. On the con
FREE
EMA Above Below Bid price Технический индикатор в помощь трейдеру. Данный индикатор, показывает расположение пяти ЕМА,  пяти средних скользящих, относительно цены формирующей японские свечи или бары (цена Bid ). О понятии ЕМА. Скользящая средняя (moving average, MA)  — это дополнительная линия на графике цены актива.  Внешне она повторяет график цены, но с небольшим запозданием и более гладко, без колебаний. Основные характеристики: 1.     Показывает тренды. Если скользящая устремлена ввер
FREE
Opening Candle Time
Alexander Shienkov
5 (1)
A simple information indicator showing the time left before the opening of the next candlestick or bar. About the concept of a timeframe A timeframe is the time interval considered in the technical analysis of free financial markets (the same applies to the global currency market), during which the price and other market data change. The smallest timeframe is the so-called tick. A timeframe is the time interval used to group quotes when drawing elements of a price chart (bars, Japanese candlest
FREE
High and Low Levels EMA Технический индикатор в помощь трейдеру. Однажды пришла идея при изучении индикатора Moving A verage ( MA ). Так как мувинги эти сглаженное, среднее значения цены за выбранный период, то как и у обычной цены и у мувинга должны быть «хаи и лои». Данный индикатор, показывает уровни High и Low . Динамических уровней поддержки и сопротивления. О понятии High и Low . Хай  — от английского  high  — обозначает наиболее высокую цену («рынок на  хаях » — капитализация актив
FREE
ATR info panel
Alexander Shienkov
5 (1)
Индикатор таблица, постоянно меняющихся значений, пройденных ценой пунктов от начало дня (D1) , от начала недели (W1) и от начала текущего месяца (MN) . Индикатор также показывает средний дневной АТР за выбранный период. Параметры всей таблицы регулируются. Перемещение по осям монитора, для расположения в удобном месте, цвета текстов и заполнений ячеек, размеры столбцов, строк, цифр и текстов. Пользоваться можно на белом и тёмном фоне. По индикатору трейдер может легко определить настроение на р
Indicator of the Margin Call, Stop Out and Plus 100 (one hundred percent of profit to the deposit) levels. It has been designed to better visualize and maintain money management when trading financial instruments. The levels drawn by the indicator have different colors. They visualize the price range, at which a broker generates a notification (Margin Call) and force closes the deals (Stop Out) due to the shortage of funds on the account, in case the price goes against the positions opened by a
An indicator of round levels. A range of important price levels with sound and text alerts, which are generated when the current Bid price of a currency pair is equal to a round number. This indicator visually shows the trader true support and resistance levels, which are used by most of traders and trading robots. The advantage provided by this indicator is that the trader using this indicator on a chart does not need to draw any additional levels. Round price levels represent a certain barrier
Doji Marker Point
Alexander Shienkov
This indicator shows the levels and signal dots of the Doji pattern. The indicator allows traders to easily determine possible location of a price rebound. Doji is a candlestick with Open and Close price equal, or almost equal. It should also have shadows of approximately the same size on both sides. Doji denotes the balance between buyers and sellers, or the absence of major players, or level testing. This pattern can mean both a reversal and a continuation of the trend. Indicator Parameters I
This indicator visualizes the intersection of two moving averages. (SМА, EMA, SMMA, LWMA). It has been created for visibility of signals and notification about intersections of Moving Average. Moving Average is simply the averaged value of the price for the selected timeframe (TF). Therefore, the moving averages are used on a wide variety of timeframes, from 1 minute to a year and even decades. Possible types of moving averages in the indicator SMA (Simple Moving Average); EMA (Exponential Movi
This indicator visualizes the intersection of two moving averages in the MACD oscillator. It uses the histogram color to signal about the moving averages crossing the zero level of the indicator. The MACD (Moving Average Convergence/Divergence) indicator is a popular oscillator actively used by traders when working in the currency and stock markets to determine trends and to search for trading signals. This linear indicator allows obtaining a variety of trading signals: crossing the zero line; d
Folding meter 4 Trend Lines
Alexander Shienkov
4.5 (2)
Folding rule of 4 trend lines The indicator has been created based on the "Folding rule" trading strategy. It shows four pairs of inclined resistance and support lines. These lines are plotted based on the nearest High and Low of the ZigZag technical indicator with four given input parameters. The indicator draws dots above and below the price extremums that have been used for plotting the trend lines. The indicator of trend lines facilitates the plotting of trend lines, channels and technical p
Kiss III EMA
Alexander Shienkov
Индикатор динамического уровня сопротивления и поддержки Moving Average. Визуально показывает момент прикосновение цены Bid , одной или трёх скользящих средних с   заданными во входных параметрах свойствами. Создан для наглядности сигналов и оповещения состоявшегося пересечения (прикосновения) цены Bid и Moving Average. Скользящая средняя — это просто усредненное значение цены за выбранный период времени, он же таймфрейм (ТФ). Именно поэтому скользящие используются на самых разнообразных ТФ,
Open High Low Close Внешняя Свеча Индикатор внешних свечей наложенных на график с выбранными вами тайм фреймом. Наглядно отображаете уровни OHLC и пройденное значение ATR текущей свечи и свечей в истории. OHLC — аббревиатура, дословно расшифровывается как: O — open (цена открытия интервала (бара или японской свечи)). H — high (максимум цены интервала). L — low (минимум цены интервала). C — close (цена закрытия интервала). Данный индикатор наглядно покажет трейдеру, уровень открытия, закрыт
ATR Sessions Pips
Alexander Shienkov
Ещё один простой информационный индикатор, показывающий самые важные торговые сессии валютного рынка. О понятии торговых сессий. Всем известно, что торговая сессия – это промежуток времени, в течение которого банки и другие участники рынка ведут активную торговлю, при этом активизируются   в определённые часы рабочего дня. Валютный рынок, рынки акций и сырьевые рынки   работают круглосуточно с понедельника по пятницу, кроме праздничных дней. Когда в одной стране ещё спят, в другой рабочий ден
Risk Manager VT
Alexander Shienkov
Risk Manager VT Робот - помощник, от команды VT. О рискменеджменте в торговле: Грамотный риск менеджмент в трейдинге – это залог успеха при решении основных Ваших задач, при активной ручной торговле, на биржевом рынке: дисциплина и контроль эмоций! Данный помощник поможет вам с лёгкостью ограничивать риски на каждую сделку, и правильно выставить уровни прибылей. Те кто долго торгуют, на валютном рынке, уже знают, что правильное соотношение риск/прибыль, является эффективным инструментом в
History VT
Alexander Shienkov
History VT Информационный индикатор. Показывает на графике, сразу после открытия сделки, стрелку именно на той японской свече, где позиция открыта. То есть там, где появилась штрихпунктирная линия открытой сделки, в терминале. Далее, после открытия сделки, как обычно, трейдер ставит SL и TP  и ждёт итога своего выбора направления движения. После того как сделка закрылась, по « sl » или « tp » или «вручную», индикатор отображает на графике уровни и текстовые сноски параметров сделки. Сноски
Auto Multi Channels VT Ещё один технический индикатор в помощь трейдеру. Данный индикатор, автоматически показывает, наклонные каналы в восходящем, нисходящем и боковом движении цены, т.е. тренды. (Внутри дня. Среднесрочные и долгосрочные, а также Восходящие, нисходящие и боковые). О понятии Тренд. На бирже, трендом называется  направленное движение ценового графика в одну из сторон (вверх или вниз) . То есть, тренд в трейдинге — это ситуация, когда цена определенное время возрастает или сниж
Old Time Frame EMA
Alexander Shienkov
Old Time Frame EMA   Индикатор двух динамических уровней сопротивления и поддержки Moving Average. Данный индикатор рисует на открытом графике младшего тайм фрейма, ЕМА со старшего тайм фрейма.   Создан для наглядности сигналов, для входа в рынок, для тех трейдеров, у кого Средние Скользящие Цены (ЕМА или МА), являются основным сигналом для открытия или закрытия сделок. А также ориентиром, направлением тренда в движении текущих цен, внутри дня и в среднесрочной торговле. Возможные типы сред
Filter:
No reviews
Reply to review