MetaTrader 5용 기술 지표 - 20

The ChanLun or Chan theory is one of the most popular trading theories in China. But it seems like that it has little influence in western countries. Actually, the Chan Theory is based on a sophisticated mathematical model. The basic idea ChanLun is to simplify the bar chart by its model. With the help of ChanLun, a trader can analyze and predict the trend of future goods, stocks.
In ChanLun, there are several basic elements called fractals, strokes, line segments and pivots . A trader should pa

Boom and Crash Gold miner v2 Trading indicator based on market momentum works on m1 for boom and crash 1000 and M5 time frame for normal trading pairs wait for blue arrow to appear plus change of candle stick color and candlesticks must be above the 2 modified moving averages then you can buy the market. wait for orange arrow to appear plus change of candle stick color and candlesticks must be below the 2 modified moving averages then you can sell the market.
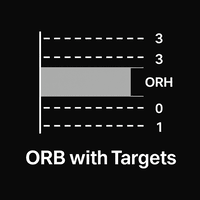
Opening Range Breakout Pro MT5: Stop Guessing, Start Trading the Open. Most traders spend the first 30 minutes of the market open sweating over their keyboards, wondering which way the wind is blowing. Opening Range Breakout Pro does the heavy lifting for you, pinning down the Initial Balance like a pro wrestler so you can stop chasing candles and start hitting targets. Whether it is the London Open volatility or the New York chaos, this indicator draws the line in the sand. You just decide whi
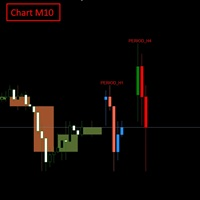
FULL PRODUCT DESCRIPTION Multi-Timeframe Candle Overlay Pro lets you view higher-timeframe candles directly on your current chart with absolute accuracy. When trading lower timeframes like M1–M15, understanding what the H1–H4 candles are forming is a major advantage: you avoid counter-trend entries, read market context faster, and trade with more confidence.
The indicator supports up to 2 higher timeframes, drawing full OHLC candles with precise positioning—no misalignment, no distortion. C
FREE
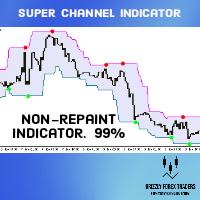
Super Signals Channel Indicator Its channel is a non-repaint indicator that reacts more with recent price movements. For this reason, the Super Signals Channel Indicator is a better match for short-term or day trading strategy. The Super Signals Channel only plots swing trading opportunities. So most of its trade signals appear during consolidation or sidelined periods of the market. Super Signals Channel Indicator for MT5 Explanation The green band below the price shows the dynamic support lev

This indicators automatically draws the support and resistances levels (key levels) for you once you've dropped it on a chart. It reduces the hustle of drawing and redrawing these levels every time you analyse prices on a chart. With it, all you have to do is drop it on a chart, adjust the settings to your liking and let the indicator do the rest.
But wait, it gets better; the indicator is absolutely free! For more information: https://youtu.be/rTxbPOBu3nY For more free stuff visit: https:
FREE

지표는 차트에 중요한 기술 수준을 표시합니다. 이 수준은 가격 움직임에 대한 지지 또는 저항 역할을 합니다.
가장 중요한 수준은 100 점과 50 점의 배수입니다. 25포인트의 배수로 레벨을 표시할 수도 있습니다.
가격이 수준에 도달하면 경고 또는 푸시 알림이 표시됩니다.
MT4용 버전 https://www.mql5.com/ko/market/product/69486 설정 Show Levels 100 pips - 100핍의 배수로 레벨 표시 Show Levels 50 pips - 50핍의 배수로 레벨 표시 Show Levels 25 pips - 25핍의 배수로 레벨 표시 Color Levels 100 pips - 100핍으로 나눌 수 있는 수준의 선 색상 Color Levels 50 pips - 50핍으로 나눌 수 있는 수준의 선 색상 Color Levels 25 pips - 25핍으로 나눌 수 있는 레벨의 선 색상 Send Alert - 알림 보내기 Send Push - 푸시
FREE

시장 모멘텀을 정밀하게 시각화하세요 MultiMA_ICHIMOKU_STO_Color 는 세 가지 강력한 지표를 하나의 스마트 시스템으로 결합하여 명확한 시장 신호를 제공하도록 설계된 포괄적인 기술적 분석 도구입니다. 이 지표는 사용자 정의 가능한 세 가지 이동 평균선(MA), 일목균형표(Ichimoku Cloud)의 주요 구성 요소, 그리고 스토캐스틱 오실레이터를 통합합니다. 독특한 특징은 시장 상황을 즉시 보여주는 지능형 캔들 색상 시스템입니다: 강세 (파란색): 가격이 세 가지 MA 모두 위에 있고 스토캐스틱이 50을 초과하여 강력한 상승 모멘텀을 나타냅니다. 약세 (빨간색): 가격이 세 가지 MA 모두 아래에 있고 스토캐스틱이 50을 초과하여 강력한 하락 모멘텀을 알립니다. 중립 (회색): 혼조세 또는 약한 모멘텀 (스토캐스틱 50 미만). 장점: 차트의 복잡함을 없애고 여러 지표 사이를 전환할 필요를 제거합니다. 확률 높은 매매 기회를 한눈
FREE

Wave123 BOS Indicator (XAUUSD M15 Optimized) Wave123 BOS Indicator is a modern, chart-based Break of Structure (BOS) + Breakout (BO) visualization tool built for traders who want clear market structure signals directly on the chart — with a strong focus on XAUUSD (Gold) on the M15 timeframe . Gold moves fast and often breaks structure with sharp impulses and quick retraces. This indicator is designed to highlight those moments clearly, so you can trade with better direction, timing, and confiden
FREE

HMA Color – Master Smoothed A clean, high-precision visual Hull Moving Average indicator with fully smoothed trend color display. Designed for professional scalpers and algorithmic traders who want a simple, fast, powerful trend view without noise. This indicator is built with a double smoothing system , making the Hull curve extremely soft and responsive.
When the trend is bullish, the HMA line automatically switches to Green and shows upward candles.
When the trend is bearish, the HMA line swi
FREE

Overview: The US Dollar Index (DXY) is a key financial indicator that measures the strength of the US Dollar against a basket of six major world currencies. This index is crucial for traders and investors as it provides a comprehensive view of the overall market sentiment towards the US Dollar and its relative performance. All Products | Contact Composition: The DXY's composition is as follows: Euro (EUR): 57.6% Japanese Yen (JPY): 13.6% British Pound (GBP): 11.9% Canadian Dollar (CAD): 9.1%
FREE

Price Sessions is an exclusive MetaTrader 5 indicator that integrates symbol information and trading sessions into your chart. It does not link to any account information or external sources, ensuring user safety. Main Features: 1. Symbol Information Current Symbol Live Price Live Spread 2. Trading Sessions (Time zone UTC/GMT+0) Tokyo session London session New York session If you find this utility helpful, please rate it. If you encounter any issues or have suggestions, pleas
FREE

Free forever simple pip meter for MT5 with customizable font color. Display profit or loss in both points count and currency value. Supports 4 currency symbols ($,€,£ ,¥). For unsupported currencies, it shows a 3-character currency short form. Enhance your trading interface with clarity and precision. Easy to use and tailored for diverse Forex traders. Perfect for MT5!
FREE

Candle Time Countdown is a professional MT5 indicator developed to displays in real-time the countdown showing the remaining time until candle close across multiple timeframes simultaneously. The indicator features intelligent color-coded visual feedback where each timeframe's text dynamically changes to bright lime green for bullish candles and red for bearish candles, with each timeframe updating independently based on its own candle direction.
Key Features Multi-Timeframe Support: M1, M5, M1
FREE

Major Swing Fibonacci Indicator - Professional Trading Tool What It Does Automatically detects major swing points not internal noise Generates buy/sell signals at key Fibonacci levels Displays professional GUI panel with real-time analysis Marks major swings with visual indicators Trading Strategy BUY at 38.2%-61.8% Fibonacci support in uptrends SELL Past performance is not indicative of future results. This indicator is for educational and informational purposes only and does not constitute in
FREE

AllTF Trend Bias Indicator is a professional tool to visualize market bias, designed mainly for 1-minute charts. The colors are not trading signals by themselves, but a visual compass to guide your decision-making: HiddenEdge release model
All HiddenEdge tools follow the same structured release plan.
Each indicator is released initially for free to collect feedback.
After reaching a stable user base, it moves to a fixed paid tier.
Some utilities remain permanently free as part of the Hidde
FREE

This is an indicator of trading sessions that can display all levels (Open-High-Low-Close) for four sessions . The indicator can also predict session levels. Sessions can be drawn with lines or rectangles (empty or filled), lines can be extended to the next session. You can easily hide/show each session by pressing hotkeys (by default '1', '2', '3', '4'). You can see ASR (Average Session Range) lines (default hotkey 'A'). This is similar to the ADR calculation, only it is calculated based on

Market Hours Pro shows Tokyo, London, and New York trading sessions directly on your MT5 chart, including scheduled overlap periods. It’s designed to give you a clear view of global market timing so you can plan trades, spot high-activity periods, and align strategies with standard Forex hours. How It Works Displays scheduled session times visually on your chart. Highlights session overlaps for London/New York and Tokyo/London. Automatically adjusts times for your timezone or broker time. Shows
FREE

Overlay indicator on chart between 2 pairs
The Timeframe Overlay indicator displays the price action of timeframes on a single chart, allowing you to quickly assess different timeframes from a single chart. The advantage is to observe and follow the correlations of price movements in real time to help you find potential trades at a glance.
---- Symbol 1 ----
Symbol = EURUSD
Correlation Inverse = false
Display = true
Ratio
FREE

Pro ADX Histogram: Visual Momentum & Trend Strength Indicator Elevate your technical analysis with ADX Histogram, an innovative MetaTrader 5 tool that transforms the classic Average Directional Index (ADX) into an intuitive, visual powerhouse. This indicator combines trend strength and momentum direction into a single, easy-to-read histogram, allowing you to assess market conditions and spot potential trading opportunities faster and with greater clarity. Trading Idea & Core Logic The indicator
FREE
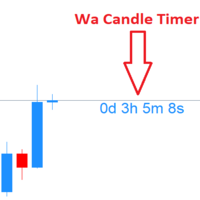
Wa Candle Timer MT5는 MT5 차트에서 다음 캔들이 형성될 때까지 남은 시간을 표시하는 강력하고 사용자 친화적인 지표입니다. 이 도구는 트레이더가 캔들 마감 시간을 인식하여 더 나은 거래 실행과 결정에 도움이 됩니다. 또한, 사용자가 직접 설정한 퍼센트에 도달하면 알림을 받을 수 있어 시간 관리가 훨씬 더 정밀해집니다.
주요 기능: 현재 캔들의 카운트다운을 표시 남은 시간이 사용자가 설정한 비율보다 작아지면 색상 변경 설정한 비율에 도달하면 알림 제공 글꼴 및 색상 완전 커스터마이징 가능 거래 시간 관리 및 정확성 향상
사용자 설정 가능 항목: 1️⃣ 임계값 이상일 때의 타이머 색상 2️⃣ 임계값 이하일 때의 타이머 색상 3️⃣ 글꼴 크기 4️⃣ 글꼴 스타일 5️⃣ 알림이 울릴 퍼센트 설정 (예: 95%, 80% 등)
이 인디케이터는 정확한 캔들 타이밍에 의존하는 모든 트레이더에게 꼭 필요한 도
FREE

This indicator was created as an MT5 version inspired by a TMA RSI Divergence indicator found on TradingView.
This indicator detects both Regular and Hidden divergences using RSI pivot points, similar to TradingView's pivot-based divergence logic.
-------------------------------------------------- Features -------------------------------------------------- • Regular Bullish / Bearish divergence • Hidden Bullish / Bearish divergence • Pivot-based detection (Left / Right bars) • Optional RSI SM
FREE
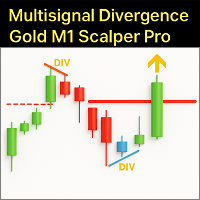
Master the volatile Gold (XAUUSD) market on the M1 timeframe with the Multisignal Divergence Gold M1 Scalper Pro . This indicator is not just another tool, but an advanced trading engine, meticulously designed to provide scalpers with high-precision entry signals, filtering out noise and focusing on robust confluences. The Challenge of Gold M1 Scalping:
Scalping, especially on an asset like Gold on the M1, demands speed, precision, and an exceptional ability to identify momentary reversals and

This indicator displays two important pieces of information on the MT5 chart: Current Spread - Trading cost measured in points, helping traders assess optimal entry timing when spread is low. Time Countdown - Remaining time (minutes:seconds) until the current candle closes and a new candle forms, supporting candle-based trading strategies. Information is displayed as compact text in a chart corner (default top-right), with customizable position, color, and font size. The indicator updates in rea
FREE

Introduction
The PF Maximizer is a game-changing non-repainting technical tool engineered to help traders distinguish genuine trend signals from erratic market fluctuations. By employing sophisticated algorithms and cutting-edge data analysis, this indicator efficiently filters out unwanted noise, empowering traders to identify the precise starting and ending points of substantial market moves.
Signal
Potential buy signal is generated when moving average is going up and the blue line cross a
FREE

Gold TL MTF - this is a fine stock technical indicator. The indicator algorithm analyzes the movement of the asset price and reflects trend lines along the fractals of a specific timeframe (TF).
Benefits of the indicator: The indicator produces signals with high accuracy. The confirmed signal of the indicator does not disappear and is not redrawn. You can trade on the MetaTrader 5 trading platform of any broker. You can trade any assets (currencies, metals, cryptocurrencies, stocks, indices e
FREE

Market Session and Custom Session draws market session zones (Asia, London, New York) plus a user-defined session directly on your chart — including session highs/lows, optional filled areas, labels and hover tooltips. Built for intraday traders, scalpers and analysts who need to spot session structure and recurring levels quickly. Highlights Immediate visual reference for major trading sessions. Automatic session High/Low markers — great for breakout setups and volatility analysis. User-definab
FREE
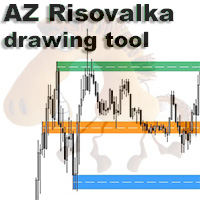
AZ Risovalka levels drawing tool An indicator for simplifying the drawing of levels. Select the indicator mode for the body, shadow, or the whole candle in the settings. Click the 'Draw' button on the drawing panel to create a level, then click on the body or shadow of the candle and select the level color in the color menu that appears. The 'Delete' button to delete level you select, 'Color' to select the color of an already created level. You can set your own colors in the indicator menu (6 co
FREE
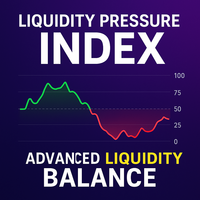
Liquidity Pressure Index (LPI) is an advanced technical indicator designed to uncover the hidden battle between buyers and sellers in the market. Unlike conventional oscillators that only rely on price movements, LPI integrates market depth (order book data), ATR-based volatility compression, and adaptive smoothing to give traders a deeper view of true liquidity dynamics.
By combining price action with volume absorption and order flow pressure, the LPI helps traders anticipate shifts in market
FREE

Support Resistance Indicator The "Support Resistance" indicator is a versatile tool designed to help traders identify key support and resistance levels based on an underlying algorithm. These levels indicate price points where an asset historically experiences buying (support) or selling (resistance) pressure. The indicator allows traders to visualize these levels on their charts, making it easier to make informed decisions. All Products | Contact PARAMETERS: Timeframe :
Users can select the
FREE
The Round Level Indicator automatically draws psychologically significant price levels directly on your chart.
These round numbers often act as key support and resistance zones across all markets and timeframes.
Round Levels are used in my automated EA: Opal This indicator works best when combined with other tools and strategies, e.g.: Price Action Strategies
Round levels often align with key support/resistance. Use it with candlestick patterns (like pin bars or engulfing bars) to confirm high
FREE

With this system you can spot high-probability trades in direction of strong trends. You can profit from stop hunt moves initiated by the smart money!
Important Information How you can maximize the potential of the scanner, please read here: www.mql5.com/en/blogs/post/718109 Please read also the blog about the usage of the indicator: Professional Trading With Strong Momentum.
With this system you have 3 reliable edges on your side: A strong trend (=high probability of continuation) A deep pull

포라 평균은 트렌드 탐지의 새로운 단어입니다. 정보 기술의 발전과 많은 참가자들로 인해 금융 시장은 구식 지표에 의한 분석에 덜 민감해지고 있습니다. 이동 평균이나 정작과 같은 기존의 기술적 분석 도구는 순수한 형태로 추세의 방향이나 역전 방향을 결정할 수 없습니다. 하나의 지표가 14 년의 역사를 기반으로 매개 변수를 변경하지 않고 미래 가격의 올바른 방향을 나타낼 수 있습니까? 동시에,옆으로 시장의 움직임과 적절성을 잃지 않는다? 답변:예,할 수 있습니다. 우리 팀은 변화하는 시장 상황에 적응하기 위해 상당히 강력하고 효과적인 메커니즘을 가진 지표를 개발했습니다. 2025 년에 선도적 인 추세 지표"평균"은 새로운 개발 단계에 진입하고 있습니다. 현대 암호 화폐 및 주식 시장은이 지표를 위해 만들어진 것 같습니다. 고유 한 스무딩 공식을 사용하면 통화 쌍 또는 기타 악기의 모든 기능에 대한 표시기를 조정(패턴 식별)할 수 있습니다. 지금,이익을 만들기 위해,하나의 지표는 충분하다

Verve AI Reversal Pro Indicator Pro는 정밀한 정확도와 탁월한 시장 통찰력을 추구하는 트레이더를 위한 궁극의 동반자입니다. 최첨단 인공지능 기술을 활용하여 가격 움직임, 거래량, 변동성을 실시간으로 지속 분석함으로써 되돌림이 완전히 형성되기 전에 고확률 전환 지점을 포착합니다. 고급 머신러닝 알고리즘과 검증된 기술적 분석 원칙을 완벽히 결합한 Verve AI는 복잡한 데이터를 명확하고 자신감 있는 신호로 변환하여, 가장 불안정한 시장에서도 안심하고 거래할 수 있도록 돕습니다.
Verve AI Reversal Pro Indicator Pro의 주요 기능:
• 지능형 전환 탐지: AI 엔진이 수백 개의 가격 패턴과 통계 지표를 실시간으로 스캔하여 주요 추세 변화를 예고하는 미묘한 단서를 식별합니다. • 동적 지지선 및 저항선 매핑: 전환이 발생하기 쉬운 핵심 가격 수준을 자동으로 강조 표시하여 정확한 진입 및 청산 포인트를 시각적으로 가이드합니다.

KT OBV Divergence는 가격과 OBV(온밸런스 볼륨) 오실레이터 사이에 형성되는 일반 및 숨겨진 다이버전스를 표시합니다.
기능
비대칭 다이버전스는 정확도를 높이고 시각적 혼란을 줄이기 위해 자동으로 제외됩니다. 추세 전환 및 추세 지속 전략 모두에 활용 가능합니다. Expert Advisor에 완벽히 통합 가능한 구조로 설계되었습니다. 진입 신호뿐만 아니라 청산 신호로도 활용할 수 있습니다. MetaTrader의 모든 알림 기능을 지원합니다.
다이버전스란 무엇인가요?
기술적 분석에서 일반적으로 가격이 더 높은 고점을 만들면 오실레이터도 더 높은 고점을 만들어야 하며, 가격이 더 낮은 저점을 만들면 오실레이터도 같이 낮아져야 합니다. 이와 같은 정상적인 관계가 무너질 때, 가격과 오실레이터 간에 다이버전스가 발생한 것으로 봅니다. 다이버전스는 크게 두 가지 유형이 있습니다: 일반적인 강세 다이버전스: 가격은 더 낮은 저점을 만들지만, 오실레이터는 더 높은 저점을 만듭

MACD ADVANCED - BRIEF DESCRIPTION INTRODUCTION MACD Advanced is an enhanced version of the traditional MACD indicator featuring an intelligent 4-color system that helps traders easily identify market trends and momentum. KEY FEATURES 1. Smart 4-Color System Bright Green (Lime) - Strong Bullish: MACD > 0 and MACD > Signal Light Green (DarkSeaGreen) - Weak Bullish: MACD > 0 but MACD < Signal ️ Bright Red (Red) - Strong Bearish: MACD < 0 and MACD < Signal Orange Red (OrangeRed)
FREE

KT Volume Profile은 Y축에 히스토그램 형태로 거래량 누적 데이터를 시각화하여, 특정 시간대 및 가격 수준에서의 거래 활동을 확인할 수 있게 해주는 도구입니다. 이 기능은 트레이더가 거래가 집중된 가격 구간을 식별하는 데 매우 유용합니다.
볼륨 프로파일에서의 POC (Point of Control)
POC는 전체 프로파일 중 가장 많은 거래량이 발생한 가격 수준을 나타냅니다. 일반적으로 주요 지지 또는 저항 영역으로 활용되며, 시장이 본격적인 방향 전환 전에 되돌림을 보이는 핵심 레벨로 작용할 수 있습니다.
주요 기능 사용법이 매우 간단합니다. 사각형을 차트에서 드래그 앤 드롭하면 실시간으로 볼륨 프로파일이 업데이트됩니다. 가격이 POC를 돌파할 경우 알림을 설정할 수 있습니다. 처음부터 경량화된 코드로 설계되어 CPU 및 메모리 자원 사용이 최소화됩니다.
입력 설정 볼륨 소스: 틱 볼륨 / 실제 거래량 프로파일 색상: 히스토그램 막대의 색상 박스 너비:

Introducing Order Blocks Breaker , a brand-new way to identify and leverage order blocks in your trading strategy. After developing multiple order block tools with unique concepts, I’m proud to present this tool that takes things to the next level. Unlike previous tools, Order Blocks Breaker not only identifies order blocks but also highlights Breaker Order Blocks —key areas where the price is likely to retest after a breakout. MT4 - https://www.mql5.com/en/market/product/124101/ This t

Original supertrend indicator in Tradingview platform. Indicator type: Price Action indicator Introduction: The Supertrend Indicator - Enhancing Your Trend Analysis. If you haven't yet found a Supertrend indicator with good graphics on the MQL5 platform, this is the indicator for you. Overview: The Supertrend Indicator is a powerful tool designed to provide traders with valuable insights into the current and historical trends of financial markets. It serves as a valuable addition to any t
FREE

수익성 있는 거래 기회를 쉽게 식별하는 데 도움이 되는 강력한 외환 거래 지표를 찾고 계십니까? Beast Super Signal보다 더 이상 보지 마십시오. 사용하기 쉬운 이 추세 기반 지표는 시장 상황을 지속적으로 모니터링하여 새로운 개발 추세를 찾거나 기존 추세에 뛰어들 수 있습니다. Beast Super Signal은 모든 내부 전략이 정렬되고 서로 100% 합류할 때 매수 또는 매도 신호를 제공하므로 추가 확인이 필요하지 않습니다. 신호 화살표 알림을 받으면 구매 또는 판매하기만 하면 됩니다.
구매 후 비공개 VIP 그룹에 추가되도록 저에게 메시지를 보내주세요! (전체 제품 구매만 해당).
최신 최적화된 세트 파일을 구입한 후 저에게 메시지를 보내주세요.
MT4 버전은 여기에서 사용할 수 있습니다.
여기에서 Beast Super Signal EA를 받으세요.
최신 결과를 보려면 댓글 섹션을 확인하세요!
Beast Super Signal은 1:1, 1:2
Spike Detector Rider – Intelligent Trading in Volatile Markets Introduction
The Spike Detector Rider is an advanced system for MetaTrader 5 designed to detect explosive price movements in high-volatility assets such as synthetic indices and commodities.
It combines volatility filters, trend analysis, and automated risk management to provide intelligent trade confirmations. After purchase, please send me a private message via MQL5 to receive the installation manual and setup instructions. Asset

Eagle Spikes Detector v1.50 - Professional Trading Signal System Ultimate Precision Trading with Advanced SuperTrend Filtering Technology join my telegram channel to trade with me: https://t.me/ +9HHY4pBOlBBlMzc8
The Eagle Spikes Detector is a sophisticated, professional-grade trading indicator designed for serious traders who demand precision, reliability, and visual excellence. Combining advanced multi-timeframe analysis with cutting-edge SuperTrend filtering, this indicator identifi
FREE

This indicator recognizes a special type of Inside Bar formation which is formed by a big Master candle followed by 4 smaller candles (please see the strategy explanation below). Features Plots buy/sell stop lines on the chart as well as well as take profit and stop loss levels. The TP/SL levels are based on the Average True Range (ATR) indicator. Object colors are changeable. Sends you a real-time alert when a Master candle formation is identified - sound / popup / email / push notification. On
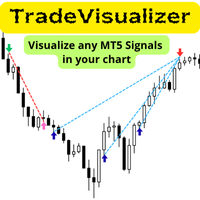
Trade Visualizer 지표는 거래 데이터를 시각화하여 MT5 차트에 전체 거래 내역을 직접 표시합니다. 자신의 성과를 분석하거나 MQL5 시그널 트레이더를 연구할 때, 이 도구는 원시 데이터를 직관적인 시각 자료로 변환합니다. 각 거래는 진입/청산 화살표, 연결선, 가격·수익·거래량·핍 수치 등의 정보로 표시됩니다. 참고: 인디케이터를 다운로드하셨다면 이메일 주소와 함께 메시지를 보내주시면 Trade Visualizer Template 무료 사본을 보내드립니다. 특징:
• 최신 ProTrading Analytics Excel Template v1.7 과 완벽히 통합.
• 여러 트레이더/전략을 동일 심볼에서 비교 가능.
• 매수·매도 색상, 선 스타일, 화살표 크기 완전 사용자 정의.
• GMT 기준 자동 시간대 조정.
• 다양한 브로커 심볼 접미사 지원.
• 전략 논리, 진입/청산 타이밍 분석에 이상적.
FREE

Fibomathe Indicator: Support and Resistance Tool for MT5 The Fibomathe Indicator is a technical analysis tool designed for MetaTrader 5 (MT5) that assists traders in identifying support and resistance levels, take-profit zones, and additional price projection areas. It is suitable for traders who use structured approaches to analyze price action and manage trades. Key Features Support and Resistance Levels:
Allows users to define and adjust support and resistance levels directly on the chart.
FREE

Enjoy the Free Candle Color indicator.
Kijun Sen is an element of Ichimoku Kinko Hyo Indicator, it's far too complicated for many traders hence they tend to be confused. We have simplified it so the Kijun Sen will change colors as it activates without the Tenkan Sen, Senkou Span, Up Kumo and Down Kumo. Customize to your period parameter and colors of your choice. Great for beginners and seasoned traders. Set your period and enjoy
GOOD LUCK and ALL THE BEST IN YOUR TRADING JOURNEY !!!!!
FREE

"HiperCube USD INDEX (DXY /USDX) "는 주식, 채권 또는 상품과 같은 특정 자산 그룹의 성과를 나타내는 재무 벤치마크로, 가치는 미국 달러로 표시됩니다. 이러한 지수는 투자자가 특정 부문 또는 시장의 성과를 시간 경과에 따라 추적하고 비교하는 데 도움이 됩니다. USD로 표시되므로 지수는 자산의 기본 통화 또는 지리적 위치에 관계없이 투자를 평가하는 데 일관된 척도를 제공합니다. 다윈엑스 제로 20% 할인 코드: DWZ2328770MGM_20
성과 정보를 더 명확하게 유지하기 위한 별도 창에 대한 지표 색상이 변경되는 사용자 지정 캔들 설치가 쉽고 필요한 경우에만 활성 이름 변경 Chat gpt와 AI를 사용하여 개발되었습니다.
HiperCube USD 지수 이해: 성과 지표: 지수는 특정 시장 또는 부문의 성과를 보여줍니다. 지수 USD가 상승하면 기본 자산의 가치가 일반적으로 증가하고 있음을 나타냅니다. 반대로 지수가 하락하면 가치가 감소함을 나타냅
FREE

이 강력한 도구는 자동으로 추세 라인을 식별하여 거래 전략을 간소화하고보다 정보에 근거한 결정을 내릴 수 있도록 도와줍니다. MT4 버전
주요 기능 자동 추세 라인 감지 : "기본 추세선"표시기는 잠재적 인 추세 라인에 대한 시장을 스캔하고 차트에 즉시 표시합니다.이것은 귀중한 시간을 절약하고 중요한 트렌드를 놓치지 않도록합니다. 사용자 친화적 인 패널 : 우리의 지표에는 다양한 트렌드 라인을 쉽게 그릴 수있는 아름답고 직관적 인 패널이 제공됩니다.이 패널은 모든 경험 수준의 거래자를 위해 설계되어 몇 번의 클릭만으로 추세선을 추가, 편집 또는 제거 할 수 있습니다. 좋아하는 트렌드 라인을 저장하고 관리하십시오. : 가장 중요한 트렌드 라인을 추적하십시오.우리의 지표는 선호하는 추세선을 저장하여 차트를 다시 방문 할 때마다 항상 사용할 수 있도록합니다. 다목적 응용 프로그램 : 당신이 외환, 주식 또는 암호 화폐 거래에 관계없이 "기본 추세선"지표는 다양한 시장에 적

Ignition Candle Guard is a visual indicator for MetaTrader 5 designed to identify candles with excessive movement relative to the ATR. The indicator highlights candles whose range (High–Low) exceeds a configurable ATR multiple, helping traders avoid late entries after overextended price movements. This indicator does not generate buy or sell signals , does not repaint , and does not execute automated trades .
It works as a visual risk filter and can be used with any strategy, asset, or timeframe
FREE

Easy Trend , as the name implies, is an indicator that easily shows the prevailing trend by bringing several indicators into one. The strategy is: when all indicators point in the same direction a signal is triggered. When red, is a signal to sell, when blue, signal to buy. It is that simple :) There are a total of 9 indicators: Moving Average, RSI, CCI, Parabolic SAR, William's Range, Stochastic, MACD, ADX and Heiken Ashi. It is possible to configure each of these indicators to suit your way of
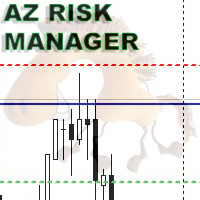
A simple indicator for calculating risk and automatically calculating the take profit line. In the settings, you enter the desired risk to profit ratio, the indicator will automatically calculate the volume for entry and show where to set the take-profit line to maintain the proportion. The risk is calculated based on your balance data. The information panel can be moved around the screen. The stop-loss line can also be moved, this will recalculate the entry volume and the take-profit position.
FREE
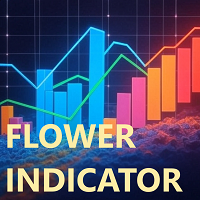
플라워 지표는 주로 추세를 파악하고 스캘핑 또는 일중 거래 전략을 지원하는 데 사용되는 기술 분석 도구입니다.
플라워 지표는 기술적 분석 및 가격 변동 분석을 기반으로 하는 신호 추세 지표입니다. 파란색 꽃은 상승 추세를, 빨간색 꽃은 하락 추세를 나타내는 등 다양한 색상의 꽃을 사용하여 추세를 시각적으로 보여줍니다.
각 레벨은 지지선과 저항선 역할을 할 수 있습니다(+/- 200 레벨과 차트에 나타나는 점을 주의 깊게 살펴보세요).
과매수/과매도 고정 레벨이나 그에 따른 밴드, 또는 둘 다, 또는 둘 중 하나를 돌파할 때 점이 나타나도록 설정할 수 있습니다.
이 지표는 시장의 잠재적 반전을 감지하고 매집/분산 구간을 파악합니다. 모든 상품 및 시간대와 호환되며, 매개변수는 필요에 따라 조정할 수 있습니다. 각 레벨은 지지선과 저항선 역할을 할 수 있습니다.
FREE

BEHOLD!!!
One of the best Breakout Indicator of all time is here. Multi Breakout Pattern looks at the preceding candles and timeframes to help you recognize the breakouts in real time.
The In-built function of supply and demand can help you evaluate your take profits and Stop losses
SEE THE SCREENSHOTS TO WITNESS SOME OF THE BEST BREAKOUTS
INPUTS
MaxBarsback: The max bars to look back
Slow length 1: Period lookback
Slow length 2: Period lookback
Slow length 3: Period lookback
Slow leng
FREE

버블 지표 — 가격 둔화 + 거래량 스파이크 감지 가격이 갑자기 둔화되고 동시에 거래량이 급증할 때, 차트에 색상 사각형을 표시하는 간단한 시각적 도구입니다.
(채우기 기능과 동심 원형 버블 효과 포함)
시장이 움직이기 전의 중요한 타이밍을 식별하는 데 도움이 됩니다. 지표 기능: 시장이 움직이기 전 “주저하는” 순간을 감지 거래량이 많아도 가격 변동이 적은 구간 표시 잠재적 돌파 또는 전환점을 사전에 예측 작동 원리: 현재 차트보다 작은 시간 프레임 분석 비정상적으로 작은 캔들 감지 (가격 둔화) 비정상적으로 높은 거래량 감지 (거래량 스파이크) 초록색(강세) 또는 빨간색(약세) 사각형 표시 주요 설정: 가격 민감도: 값이 낮을수록 민감도가 높음 거래량 배수: 값이 높을수록 선별적 분석 버블 크기: 지표 표시 가시성 조정 유용한 이유: 간단하고 시각적으로 직관적 복잡한 계산 불필요 흥미로운 시장 패턴 탐지 완전히 사용자 정의 가능 횡보장, 돌파 거래 또는 시장 동향 이해에 최적화되

I think you all know Donchian Channels. so I am not going to write about it.
With this indicator I tried to create Donchian Trend Ribbon by using Donchian Channels.
How it works ?
- it calculates main trend direction by using the length that is user-defined. so you can change it as you wish
- then it calculates trend direction for each 9 lower lengths. if you set the length = 20 then the lengths are 19, 18,...11
- and it checks if the trend directions that came from lower lengths is same
FREE

Hull Moving Average is more sensitive to the current price activity than a traditional Moving Average. It faster responds to trend change and more shows the price movement more accurately. This is a color version of the indicator. This indicator has been developed based in the original version created by Sergey <wizardserg@mail.ru>. Suitable for all timeframes.
Parameters Period - smoothing period, recommended values are 9 to 64. The larger the period, the softer the light. Method - smoothing m
FREE

Keltner-Enhanced improves the accuracy and readability of Keltner Channels with many options for adjusting them and more five price calculations beyond the META default.
The Keltner-E indicator is a banded indicator similar to Bollinger Bands and Moving Average Envelopes. They consist of an upper envelope above a midline and a lower envelope below the midline.
The main occurrences to look out for when using Keltner Channels are breakouts above the Upper Envelope or below the Lower Envelope.
FREE

HiperCube Renko Candles에 오신 것을 환영합니다. 다윈엑스 제로 25% 할인 코드: DWZ2328770MGM 이 지표는 시장이 Renko Candle Style로 변환되는 실제 정보를 제공합니다.
정의 Renko 차트는 가격 변동을 측정하고 표시하는 재무 차트의 한 유형으로, 가격 변동을 나타내는 벽돌(또는 막대)을 사용합니다. 전통적인 캔들스틱 차트와 달리 Renko 차트는 시간 기반 정보를 표시하지 않고 가격 변동에만 초점을 맞춥니다.
기능: 별도 창의 지표 캔들 색상 사용자 정의 핍 단위의 캔들/벽돌 크기 사용자 정의 Chatgpt 와 AI를 사용하여 개발되었습니다. Renko를 사용한 예시 전략: 추세 식별 Renko 캔들로 풀백과 인클루핑을 기다림 진입 인클루핑의 SL 하위 위험 보상 TP 1:2, 1:3... 이것은 예시이며 기본 또는 새로운 전략이 될 수 있지만 실제 계정에서 사용하기 전에 시도하고 테스트해 보세요. 이 정보는 Renko 캔들 hi
FREE
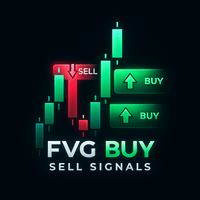
A Smart Price Imbalance Tool with Arrows, Labels, and FVG Zones The Fair Value Gap (FVG) Indicator is designed to automatically detect price imbalance zones on the chart – a widely used concept in Smart Money Concepts (SMC) and Institutional Trading Models (ICT) . These gaps, also known as imbalances or inefficiencies , often highlight areas where price may return to "rebalance" liquidity. Many professional traders consider these levels as high-probability zones for potential reversals, retrace

This indicator displays buy or sell signals according to Bill Williams' definition of the Trading Zone. [ Installation Guide | Update Guide | Troubleshooting | FAQ | All Products ] Easy to use and understand Avoid trading flat markets Deterministic indicator with clear rules The indicator is non-repainting It implements alerts of all kinds It has straightforward trading implications. A blue arrow is a buy signal A red arrow is a sell signal According to Bill Williams trading in the zone helps t
FREE

MATADOR GOLD – XAUUSD MT5 M5 Timeframe Scalp Signals MATADOR GOLD is a professional signal indicator designed for XAUUSD (Gold) scalping on the M5 timeframe , with optional higher-timeframe confirmation. This indicator does not open or manage trades automatically .
It provides structured buy and sell signals, intelligent filtering, and alerts, allowing traders to execute trades using their own strategy and risk management rules. Core Concept (Multi-Concept Architecture) MATADOR GOLD is built
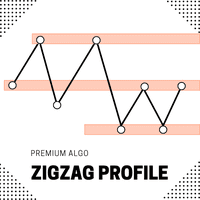
Introducing the ZigZag Profile — a powerful tool designed to identify high-probability pivot zones where price action frequently reverses. This indicator analyzes historical price data to pinpoint key areas where price has pivoted multiple times, providing traders with actionable insights into potential support and resistance levels. The ZigZal Profile indicator continuously scans for zones where price has reversed direction the most, highlighting these critical areas on your chart. By focusing
FREE

이 지표는 프랙탈의 가격 구조를 분석하고 시장 역학에서 가능한 반전 지점을 결정합니다. 프랙탈은 지지선과 저항선으로 사용될 수 있습니다.
장점:
모든 기기 및 시계열에서 작동합니다. 결과를 다시 그리지 않습니다. 표시 요소의 사용자 정의 가능한 색상, 모든 트렌드 전략과 완벽하게 결합됩니다. 프랙탈의 강도를 조정합니다.
MT4 버전 표시 -> 여기 / AW 프랙탈 EA MT5 -> 여기
전략:
프랙탈은 중앙에 정점이 있는 쐐기 모양의 기하학적 도형을 형성하는 양초의 조합입니다. 즉, 평균 가격이 정점이고 정점 전의 후속 및 이전 가격이 정점 캔들 아래 또는 위에 위치하는 경우입니다. 이 표시는 지지선과 저항선으로 사용될 수 있습니다. AW 유연한 프랙털(Flexible Fractals)은 신호를 즉시 나타내는 것이 아니라 프랙탈 구조로 인해 지연되는 신호를 나타내는 표시기입니다. 변수 "프랙탈의 각 측면에 있는 양초 수"에서 신호를 감지하려
FREE
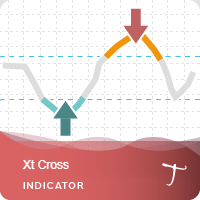
Xt Cross is a port of a famous TS /MT indicator.
When the oscillator is above the overbought band (red lines) and crosses down the signal (dotted line), it is usually a good SELL signal. Similarly, when the oscillator crosses above the signal when below the Oversold band (green lines), it is a good BUY signal.
Xt Cross Advantages The indicator is suitable for scalping and intraday trading. It is possible to evaluate the effectiveness of the indicator on history. The indicator does not
FREE

The Chandelier Exit Indicator for MT5 is a powerful tool designed to help traders manage trades by dynamically adjusting stop-loss levels based on market volatility. It is based on the Average True Range (ATR) and follows the trend, placing stop-loss levels above or below price action, depending on the trend direction. This makes it an effective tool for trend-following strategies, breakout trading, and risk management .
Key Features: • Dynamic Stop-Loss Placement – Adjusts stop-
FREE
This indicator is the mql version of the Linear Regression Candles indicator. There are many linear regression indicators out there, most of them draw lines or channels, but this one actually draws a chart.This script includes features such as linear regression for open, high, low, and close prices, signal smoothing with simple or exponential moving averages. Find out more here: https://www.mql5.com/en/users/rashedsamir/seller I welcome your suggestion for improving the indicator
To incre
FREE
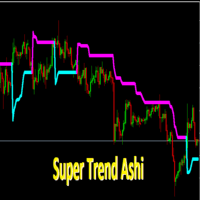
SuperTrendAshi Description SuperTrendAshi is an advanced and optimized version of the SuperTrend indicator that incorporates Heikin Ashi calculation to provide smoother and more reliable signals. This unique combination results in an indicator that reduces false signals and identifies trends with greater precision. Key Features Combines the strength of SuperTrend with Heikin Ashi smoothing More stable signals with less noise Intuitive color system (Aqua for uptrend, Magenta for downtrend) Custo
FREE

Jackson trendline scanner it a powerful price action tool which draw accurate trendlines and alert a breakout signals . As we all know that trendlines it a most powerful tool in price action by providing us with different chart patterns. e.g. Bullish flag, Pennant, Wedges and more...It not easy to draw trend lines, Most successful traders use trendlines to predict the next move based on chart pattern and breakout. Drawing a wrong trendline it a common problem to everyone, wrong
FREE
Simple indicator to show Breakeven line for all orders on attached chart pair. This indicator also comes with additional information such as Total Lot Size, Floating Drawdown in account's currency and Number of open positions and Difference from current price in Points. Do you use DCA (dollar cost average) or Hedging approach on your trading? Then this indicator you MUST have. Really useful, when you have multiple orders (hedging), this can help you quickly identify breakeven point without calc
FREE
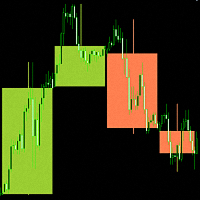
"Candlesticks MTF 5" is an information indicator that displays "Japanese Candlesticks" . The indicator analyzes and determines the opening and closing times of candles from higher time frames.
An algorithm has been developed for the "Candlesticks MTF 5" indicator that corrects the discrepancy between the opening and closing times of candles from higher time frames. For example, if the opening time of a candle on a weekly time frame is the 1st of the month, and on the smaller time frame this da
FREE
MetaTrader 마켓 - 거래자를 위한 로봇 및 기술 지표는 거래 터미널에서 바로 사용할 수 있습니다.
The MQL5.community 결제 시스템은 MQL5.com 사이트의 모든 등록된 사용자가 MetaTrader 서비스에서 트랜잭션을 수행할 수 있습니다. 여러분께서는 WebMoney, 페이팔, 또는 은행 카드를 통해 자금을 예치하거나 인출하실 수 있습니다.
트레이딩 기회를 놓치고 있어요:
- 무료 트레이딩 앱
- 복사용 8,000 이상의 시그널
- 금융 시장 개척을 위한 경제 뉴스
등록
로그인
계정이 없으시면, 가입하십시오
MQL5.com 웹사이트에 로그인을 하기 위해 쿠키를 허용하십시오.
브라우저에서 필요한 설정을 활성화하시지 않으면, 로그인할 수 없습니다.