Conheça o Mercado MQL5 no YouTube, assista aos vídeos tutoriais
Como comprar um robô de negociação ou indicador?
Execute seu EA na
hospedagem virtual
hospedagem virtual
Teste indicadores/robôs de negociação antes de comprá-los
Quer ganhar dinheiro no Mercado?
Como apresentar um produto para o consumidor final?
Indicadores Técnicos para MetaTrader 5 - 20

Se negocias nos mercados financeiros, certamente sabes o quão importante é o spread — esta diferença entre o preço de compra (ask) e o de venda (bid) pode afetar seriamente o teu lucro. Spread Size é um indicador simples, mas muito útil, que exibe o spread atual diretamente no gráfico. Já não precisas de monitorizar os dados manualmente — tudo está bem diante dos teus olhos! Para que serve?
O spread não é apenas um número. É o teu dinheiro real. Um spread baixo significa que a entrada e a sa
FREE

O Keltner-Enhanced melhora a precisão e a legibilidade dos Keltner Channels com muitas opções de ajuste, adicionando CINCO novas modalidades de preço ao padrão do Metatrader.
O indicador Keltner-E é um indicador em faixas semelhante às Bandas de Bollinger e aos Envelopes de Média Móvel. Eles consistem em um envelope superior acima de uma linha média e um envelope inferior abaixo da linha média.
As principais ocorrências a serem observadas ao usar os Canais de Keltner são rompimentos acima do
FREE

With this system you can spot high-probability trades in direction of strong trends. You can profit from stop hunt moves initiated by the smart money!
Important Information How you can maximize the potential of the scanner, please read here: www.mql5.com/en/blogs/post/718109 Please read also the blog about the usage of the indicator: Professional Trading With Strong Momentum.
With this system you have 3 reliable edges on your side: A strong trend (=high probability of continuation) A deep pull

FourAverage - uma nova palavra na detecção de tendência. Com o desenvolvimento da tecnologia da informação e um grande número de participantes, os mercados financeiros estão se tornando menos passíveis de análise por Indicadores desatualizados. As ferramentas técnicas convencionais de análise, como a média móvel ou o estocástico, são incapazes de determinar a direção ou a reversão de uma tendência. Um indicador pode indicar a direção correta do preço futuro, sem alterar seus parâmetros, em um hi

KT OBV Divergence mostra as divergências regulares e ocultas formadas entre o preço e o oscilador OBV (On Balance Volume).
Recursos
Divergências assimétricas são descartadas para maior precisão e menos poluição visual. Suporta estratégias de trading para reversão de tendência e continuação de tendência. Totalmente compatível e pronto para ser integrado a um Expert Advisor. Pode ser utilizado tanto para entradas quanto para saídas. Todos os tipos de alertas do MetaTrader estão disponíveis.
O qu

Major Swing Fibonacci Indicator - Professional Trading Tool What It Does Automatically detects major swing points not internal noise Generates buy/sell signals at key Fibonacci levels Displays professional GUI panel with real-time analysis Marks major swings with visual indicators Trading Strategy BUY at 38.2%-61.8% Fibonacci support in uptrends SELL Past performance is not indicative of future results. This indicator is for educational and informational purposes only and does not constitute in
FREE

O KT Volume Profile exibe os dados de acumulação de volume como um histograma no eixo Y, permitindo visualizar a atividade de negociação ao longo de determinados períodos e níveis de preço.
Ponto de Controle (POC) no Perfil de Volume
O POC representa o nível de preço com o maior volume negociado dentro do histograma do perfil de volume. Geralmente, é utilizado como suporte/resistência ou como um nível-chave onde o mercado pode fazer um reteste antes de seguir em uma direção específica.
Recurso

Fair Value Gap Sweep is a unique and powerful indicator that draws fair value gaps on your chart and alerts you when a gap has been swept by the price. A fair value gap is a price gap that occurs when the market opens at a different level than the previous close, creating an imbalance between buyers and sellers. A gap sweep is when the price moves back to fill the gap, indicating a change in market sentiment and a potential trading opportunity.
Fair Value Gap Sweep indicator has the following
FREE

Introducing Order Blocks Breaker , a brand-new way to identify and leverage order blocks in your trading strategy. After developing multiple order block tools with unique concepts, I’m proud to present this tool that takes things to the next level. Unlike previous tools, Order Blocks Breaker not only identifies order blocks but also highlights Breaker Order Blocks —key areas where the price is likely to retest after a breakout. MT4 - https://www.mql5.com/en/market/product/124101/ This t

Description This technical indicator is designed to automate the analysis of market structure based on price action concepts. It identifies and labels key structural points, including Higher Highs (HH), Lower Lows (LL), Lower Highs (LH), and Higher Lows (HL), to assist traders in visualizing market trends. The indicator uses a configurable "Swing Strength" logic, checking a user-defined number of bars to the left and right of a pivot to confirm its validity. It also identifies Break of Structure
FREE

Procurando por um poderoso indicador de negociação forex que possa ajudá-lo a identificar oportunidades de negociação lucrativas com facilidade? Não procure mais do que o Beast Super Signal. Este indicador baseado em tendências fácil de usar monitora continuamente as condições do mercado, procurando por novas tendências em desenvolvimento ou aproveitando as já existentes. O Beast Super Signal dá um sinal de compra ou venda quando todas as estratégias internas se alinham e estão em 100% de conflu

As linhas de resistência de velocidade são uma ferramenta poderosa para identificar linhas de tendência e resistência. O indicador traça linhas usando gráficos extremos e fórmulas matemáticas especiais. O indicador pode ser usado para determinar a direção da tendência e os pontos de reversão.
<---------------------------->
Parâmetros do indicador:
"Depth of search" - profundidade (em barras) da pesquisa de gráficos extremos "Back step of search" - a distância mínima (em barras) entre os extr
FREE

Norion Daily Key Levels é um indicador profissional desenvolvido para exibir, de forma clara e objetiva, os principais níveis de preço de referência do dia de negociação. O indicador plota automaticamente níveis essenciais como: Fechamento do dia anterior Abertura do dia atual Máxima do dia Mínima do dia Além disso, o indicador permite a inclusão de outros níveis diários personalizados, tornando-o flexível para diferentes estilos operacionais e estratégias de mercado. Esses níveis são amplamente
FREE
Spike Detector Rider – Intelligent Trading in Volatile Markets Introduction
The Spike Detector Rider is an advanced system for MetaTrader 5 designed to detect explosive price movements in high-volatility assets such as synthetic indices and commodities.
It combines volatility filters, trend analysis, and automated risk management to provide intelligent trade confirmations. After purchase, please send me a private message via MQL5 to receive the installation manual and setup instructions. Asset

Este indicador reconhece um tipo especial de formação de barra interna que é formada por uma grande vela Mestre seguida por 4 velas menores (consulte a explicação da estratégia abaixo). Recursos Representa as linhas de stop de compra / venda no gráfico, bem como os níveis de take profit e stop loss. Os níveis de TP / SL são baseados no indicador Average True Range (ATR). As cores dos objetos são mutáveis. Envia um alerta em tempo real quando uma formação de vela mestre é identificada - som / pop

Big bull scalper Short Description Master market structure with the precision of the popular Big bull scalper This tool automatically identifies key pivot highs and lows, plotting unique "angling" trend lines that dynamically define market context. It visually confirms Breaks of Structure (BOS) and Changes of Character (CHoCH), removing all guesswork from your analysis.
Key Features: Automatic Pivot Detection Instantly spots significant swing highs and lows. Dynamic Angling Lines Visual
FREE

Gold TL MTF - this is a fine stock technical indicator. The indicator algorithm analyzes the movement of the asset price and reflects trend lines along the fractals of a specific timeframe (TF).
Benefits of the indicator: The indicator produces signals with high accuracy. The confirmed signal of the indicator does not disappear and is not redrawn. You can trade on the MetaTrader 5 trading platform of any broker. You can trade any assets (currencies, metals, cryptocurrencies, stocks, indices e
FREE

KDJ Indicator for MT5 The KDJ Indicator for MT5 is a professional-grade momentum and trend analysis tool designed to help traders identify trend reversals , overbought/oversold conditions , and entry or exit opportunities with high accuracy. Originally developed as an enhancement of the Stochastic Oscillator , the KDJ adds a powerful J-line that reacts faster to price movement, giving traders earlier warnings of potential reversals. Key Features Three-Line System (K, D, J):
The K and D lines r
FREE

Essa ferramenta poderosa identifica automaticamente as linhas de tendência, ajudando você a simplificar sua estratégia de negociação e tomar decisões mais informadas. mt4 versão
Recursos -chave Detecção automática de linha de tendência : o indicador "Basic TrendLine" digitaliza o mercado em busca de linhas de tendência em potencial e as exibe instantaneamente no seu gráfico.Isso economiza tempo valioso e garante que você nunca perca uma tendência importante. Painel amigável : Nosso indicado

Rainbow Volume Profile A simple, lightweight volume profile indicator that visualizes price-range volume with color-coded POCs (Points of Control). Overview RainbowVolumeProfile04Simple.mq5 calculates and displays a price–by–volume (Volume Profile) over a user-specified number of bars. The indicator automatically detects the top 5 volume concentration levels (POCs) and draws a colorful horizontal histogram at the right side of the chart. The computation is lightweight and updates in real time. K
FREE
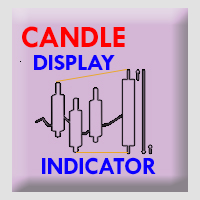
Timeframe Simulator Indicator This indicator redraws candlestick structures from a higher timeframe onto your current chart. It helps visualize higher-period price action without switching timeframes, making it easier to analyze trends and key levels while trading on lower timeframes. Main features: Customizable Candles – Adjust the appearance of higher timeframe candles (bull/bear colors, wick style, gaps, and history length). Higher Timeframe Lines – Optionally display dynamic high, low,
FREE

Pivot Point Super trend it can be used to catch price turning points and can show arrows for buying and selling. calculations are based on price peaks . you can control the price turning points by increasing the Pivot point period input on the indicator the ATR factor is for how far apart do you want the bands to be spread apart price break outs are also spotted in their early stages which will make trading much better
FREE

Indicador de Bolhas — Desaceleração do Preço + Pico de Volume Uma ferramenta visual simples que exibe quadrados coloridos no gráfico quando o preço desacelera repentinamente acompanhado por um pico de volume.
(Função de preenchimento com efeito de bolhas concêntricas)
Ajuda a identificar momentos em que o mercado se prepara para um movimento importante. O que o indicador faz: Detecta momentos em que o mercado “hesita” antes de se mover Mostra onde entra grande volume sem alteração significativa

Shadow Bands Pro – MT5 说明(中英文) English Description (MT5) Shadow Bands Pro – Advanced Reversion System for MT5 This MT5 edition of Shadow Bands Pro takes full advantage of the MT5 platform, offering faster calculations, more timeframes, and better testing capabilities.
It remains a non-repainting (on close) trend-reversal / mean-reversion tool with dynamic channels, entity-break logic, and an integrated statistics panel. Key Features Optimized for MT5’s 64-bit, multi-threaded architecture Non-
FREE
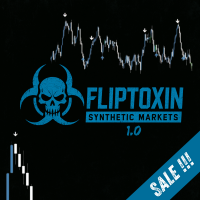
High-precision Buy/Sell flip signal indicator designed for FlipX Markets on Weltrade and Volatility pairs on Deriv. FlipToxin was coded specifically for the 5-minute (M5) chart, but also works on higher timeframes with caution. On Boom, Crash, PainX, and GainX, the 15-minute chart is suggested, especially in trending markets. Scalping Mindset Reminder
This indicator is designed for quick, precise entries and exits — perfect for traders who aim for fast, smaller profits that add up over time t
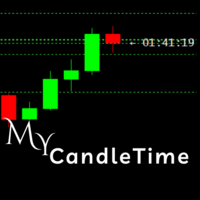
My CandleTime
This indicator displays the remaining time until the current candle closes directly on the chart.
It is designed to help traders keep track of candle formation without constantly checking the platform’s status bar. Main Features Shows countdown timer for the active candle. Works on any symbol and timeframe. Lightweight, does not overload the terminal. Adjustable font size and name. How to Use
Simply attach the indicator to a chart.
You can customize font size, color, and font to
FREE

Presentation
Another indicator that makes scalping on tick charts easier, it displays an Heiken Ashi graph in Ticks.
It allows to detect entry points and trend reversals. Recommended number of ticks in a candle : 5, 13 or 21.
Parameters Ticks in candle: Number of ticks in a candle (default 5), Displays Trend arrows : displays a trend arrow based on EMA8 and EMA20 crossing, Displays MM50, Displays MM100, Max Candle (CPU): number of candles max to manage, low value will save ressources of your
FREE
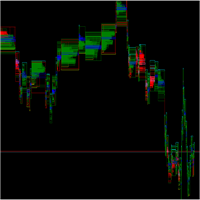
O SpreadFlow é um indicador para MetaTrader que gera um gráfico totalmente baseado no comportamento do fluxo de negócios, em vez de se limitar apenas a candles de tempo ou volume.
Ele organiza as informações de cada tick em quatro dimensões principais: Spread – monitora a diferença entre BID e ASK ao longo do tempo, mostrando momentos de compressão e alargamento do spread, associados a maior ou menor liquidez. Negócio no mesmo preço – identifica quando sucessivos negócios ocorrem no mesmo nível
FREE
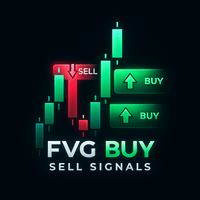
A Smart Price Imbalance Tool with Arrows, Labels, and FVG Zones The Fair Value Gap (FVG) Indicator is designed to automatically detect price imbalance zones on the chart – a widely used concept in Smart Money Concepts (SMC) and Institutional Trading Models (ICT) . These gaps, also known as imbalances or inefficiencies , often highlight areas where price may return to "rebalance" liquidity. Many professional traders consider these levels as high-probability zones for potential reversals, retrace

This indicator is especially for the binary trading. Time frame is 1 minutes and exp time 5 or 3 minutes only. You must be use martingale 3 step. So you must put lots size is 10 % at most. You should use Mt2 trading platform to connect with my indicator to get more signal without human working. This indicator wining rate is over 80% but you may get 100% of profit by using martingale 3 step. You should use MT2 Trading Platform to connect meta trader platform and binary platform . You can get mt2
FREE

Check out my TRADE PLANNER MT5 – strongly recommended to anticipate account scenarios before risking any money. This is the moving average convergence divergence (MACD) indicator based on Heikin Ashi calculations. Here you find multi-colored histogram which corresponds to bull (green) / bear(red) trend. Dark and light colors describes weakness/strenght of price trend in time. Also you can switch calculations between normal and Heikin Ashi price type.
Note: Buffers numbers for iCustom: 0-MACD,
FREE

Smart Money Concepts Indicator - Professional ICT/SMC Trading System Transform Your Trading with Institutional-Grade Smart Money Analysis Unlock the power of Smart Money Concepts (SMC) and Inner Circle Trader (ICT) methodologies with this advanced indicator that identifies high-probability entry zones and intelligently sets Take Profit targets at the next Point of Interest (POI). Stop guessing where to exit your trades - let institutional logic guide you to the next Order Block or key market
FREE
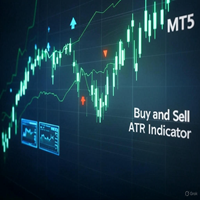
Buy and Sell ATR Indicator The Buy and Sell ATR Indicator is a powerful trend-following tool for MT5, combining ATR-based trend detection with RSI confirmation. It plots a dynamic trend line and generates clear buy (blue arrows) and sell (red arrows) signals when price action confirms a trend over a user-defined number of candles. A unique flat market filter, based on average ATR, prevents signals in low-volatility conditions. Customize ATR periods, RSI levels, signal thresholds, and arrow styl
FREE
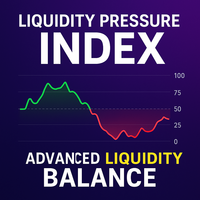
Liquidity Pressure Index (LPI) is an advanced technical indicator designed to uncover the hidden battle between buyers and sellers in the market. Unlike conventional oscillators that only rely on price movements, LPI integrates market depth (order book data), ATR-based volatility compression, and adaptive smoothing to give traders a deeper view of true liquidity dynamics.
By combining price action with volume absorption and order flow pressure, the LPI helps traders anticipate shifts in market
FREE

BUY INDICATOR AND GET EA FOR FREE AS A BONUS + SOME OTHER GIFTS! ITALO TRIANGLE INDICATOR is the best triangle indicator ever created, and why is that? Using Geometry and Fibonacci the Indicator works on all time-frames and assets, indicator built after 7 years of experience on forex and many other markets. You know many triangle indicators around the internet are not complete, does not help, and it's difficult to trade, but the Italo Triangle Indicator is different , the Italo Triangle Indi

MACD Pro – MACD Indicator for MetaTrader 5 Description
MACD Pro is a Moving Average Convergence Divergence (MACD) indicator for MetaTrader 5. It follows the standard MACD calculation method and displays trend direction and momentum in a separate indicator window. Indicator Elements MACD line based on the difference between fast and slow exponential moving averages Signal line calculated as an exponential moving average of the MACD line Histogram showing the difference between the MACD and signa
FREE
Esse indicador utiliza a volatilidade histórica e uma média móvel de 21 períodos para definir a distorção do preço em relação a média. O cálculo da volatilidade histórica foi baseado no livro (Odds: The Key to 90% Winners) escrito por Don Fishback. O Volatility Index com valor superior a 30 pode indicar que o preço está distorcido em relação ao seu preço justo.
DÚVIDAS SOBRE INSTALAÇÃO DE PRODUTOS NO META TRADER Você também pode encontrar algumas instruções sobre como instalar um robô na loja
FREE

Descrição
Spread History é um indicador simples, mas essencial, que permite exibir o histórico de spreads, vela a vela, em uma janela separada, juntamente com sua média móvel. Graças à linha em tempo real e ao texto sobreposto no gráfico principal, você pode acompanhar facilmente o spread aplicado pelo corretor em cada fase do mercado. Objetivos Exibir o spread real fornecido pelo corretor para cada vela Calcular e mostrar a média do spread de forma configurável Exibir no gráfico o valor atual
FREE

O Indicador Chandelier Exit para MT5 é uma ferramenta poderosa projetada para ajudar os traders a gerenciar operações ajustando dinamicamente os níveis de stop-loss com base na volatilidade do mercado. Ele é baseado no Intervalo Médio Verdadeiro (ATR) e segue a tendência, posicionando os níveis de stop-loss acima ou abaixo do preço conforme a direção da tendência. Isso o torna uma ferramenta eficaz para estratégias de acompanhamento de tendência, negociações de rompimento e gestão de
FREE

Um indicador de scalping profissional multi-tempo com alertas móveis em tempo real, zonas inteligentes de compra/venda e estatísticas diárias de sinais. Desenvolvido para day traders e scalpers que exigem precisão. Visão geral Este indicador foi criado para day traders e scalpers que valorizam precisão, velocidade e clareza. Ele combina análise multi-temporal com filtragem inteligente de sinais para oferecer oportunidades de negociação de alta probabilidade. Com alertas em tempo real , zonas de

Overview
Support & Resistance (MTF) is a MetaTrader 5 indicator that automatically identifies swing highs (resistance) and swing lows (support) across up to three timeframes. It merges nearby levels to reduce clutter, adapts zone width to market volatility using ATR, and offers optional alerts when price breaks or retests those levels. Features Multi-timeframe pivot detection
Identify pivots on the current chart plus two higher timeframes using a configurable pivot length. Merge-distance grou
FREE

Real Trend Zigzag PRO shows the real trend of a market, u nlike the default Zigzag indicator. It calculates the trend in real time and shows green lines for upwards trends, red lines for downward trends and blue lines for no trends. Regarding the old slogan "the trend is your friend" it helps you to decide if should open a buy or sell position. The PRO version is a multi timeframe zigzag (MTF). Means, it shows the trend of the current timeframe as well as the trend of a higher or lower time.

Product Name: HTF Candle Insight (EurUsd) - See the Big Picture Description: IMPORTANT: This version works EXCLUSIVELY on the EURUSD symbol. (It supports all broker prefixes/suffixes, e.g., pro.EURUSD, EURUSD.m, but will NOT work on Gold, Bitcoin, or other pairs). Experience the full power of "HTF Candle Insight" completely on EURUSD! Stop switching tabs constantly! This indicator allows you to visualize Higher Timeframe price action directly on your current trading chart. Whether you are a Sca
FREE
THE ADVANCE PRICE PREDICTOR - GURU EDITION Tired of Guesswork?
Meet the AI-Powered "Almighty Predictor" – Pinpoints High-Probability Targets Before the Move, With Surgical Precision
Stop chasing pips. Start attracting them. Our proprietary algorithm fuses Multi-Timeframe Analysis + Smart Money Concepts + Real-Time Confluence Scoring to give you a clear, calculated edge on every trade.
Are You Constantly Wondering…
"Is this the top, or will it keep going?"
"Where should I real
FREE
Volumatic Fair Value Gaps is a precision-engineered indicator for identifying, analyzing, and visualizing Fair Value Gaps (FVGs) backed by volume intelligence. This tool goes beyond standard FVG plotting by dissecting volume dynamics inside each gap using lower-timeframe sampling , offering clear insight into whether bulls or bears dominate the imbalance. Designed for technical traders, this indicator overlays high-probability gaps only, visualizes bullish vs. bearish volume composition , and pr

Welcome to Ultimate MA MTF , a multi-functional Moving Average (MA) indicator converted from the original TradingView version by ChrisMoody and upgraded with many powerful features. This is not just a typical MA line. It is a comprehensive technical analysis tool designed to provide traders with deep insights into trends, volatility, and potential trading signals, all within a single indicator. Key Features 8 Moving Average Types: Full support for the most popular MA types (SMA, EMA, WMA, HullMA
FREE

Automatic Fibonacci Retracement Line Indicator. This indicator takes the current trend and if possible draws Fibonacci retracement lines from the swing until the current price. The Fibonacci levels used are: 0%, 23.6%, 38.2%, 50%, 61.8%, 76.4%, 100%. This indicator works for all charts over all timeframes. The Fibonacci levels are also recorded in buffers for use by other trading bots. Any comments, concerns or additional feature requirements are welcome and will be addressed promptly.
FREE

SCALPFLASH-X
Where Fibonacci Precision Meets RSI Intelligence.
Next-gen trading system combining Adaptive Fibonacci Pivots, RSI Heat Mapping, and Smart Candle Analytics. Detect market dominance, momentum shifts, and reversal zones in real time across multiple timeframes. Institutional accuracy, retail simplicity — built for speed, clarity, and precision.
Advanced Multi-Timeframe Fibonacci & RSI-Driven Market Intelligence System ScalpFlash-X — A next-generation trading system combining Fibonacc

Stochastic RSI makes a stochastic calculation on the RSI indicator. The Relative Strength Index (RSI) is a well known momentum oscillator that measures the speed and change of price movements, developed by J. Welles Wilder.
Features Find overbought and oversold situations. Sound alert when overbought/oversold level is reached. Get email and/or push notification alerts when a signal is detected. The indicator is non-repainting. Returns buffer values for %K and %D to be used as part of an EA. (se
FREE
Overview The OBV Oscillator is a custom technical indicator for MetaTrader 5, designed to provide a clearer visualization of On Balance Volume (OBV) by transforming it into an oscillator. This indicator aims to assist traders in identifying trend confirmations, potential reversals, and momentum shifts by analyzing the relationship between price and volume. It features a customizable Moving Average (MA) for smoothing the OBV, a signal line for generating crossover signals, and an alert system to
FREE

Pipsometer is an elegant, real-time panel indicator for MT5 that instantly shows you both your cumulative money and pip gain/loss and total trades executed on the current chart. It dynamically changes its display color—green for net profit and red for net loss—so you can gauge performance at a glance without opening reports or scrolling through trade history.
FREE
Descrição: O NR4 & NR7 Inside Bar Highlighter é um indicador que detecta automaticamente padrões de compressão de preços com base na combinação dos padrões NR4 ou NR7 com um Inside Bar. O padrão NR4 (Narrow Range 4) identifica a vela com o menor intervalo das últimas 4 velas, enquanto o NR7 analisa as últimas 7. Quando esses padrões coincidem com um Inside Bar (uma vela totalmente contida dentro da anterior), indicam uma fase de baixa volatilidade , muitas vezes seguida por um forte movimento de
FREE

Paranormal Insightment Use with : Ritz MA Ribbon Dynamics (check on my product) Ritz Paranormal Insightment is a precision-engineered analytical indicator that blends momentum intelligence and trend confirmation into a single visual system.
It merges the DeMarker oscillator with a dynamic Moving Average filter , detecting price exhaustion and directional shifts with remarkable clarity. The indicator translates subtle market imbalances into actionable visual and auditory signals, helping trad
FREE

Cálculo Dinâmico do CMF: Personalize o período do Chaikin Money Flow (CMF) para ajustar sua análise e maximizar a precisão do sinal. Alertas Intuitivos Codificados por Cores: Interprete instantaneamente as condições do mercado com claras indicações visuais: Alerta Verde: Indica a zona de Sobrecompra – sinalizando uma potencial oportunidade de venda. Alerta Vermelho: Indica a zona de Sobrevenda – sugerindo uma potencial oportunidade de compra. Alerta Cinza: Representa a zona Neutra – um sin
FREE

tendencia,indicador de tendencia,momentum,oscilador,histograma,forca da tendencia,fluxo de mercado,confirmacao de tendencia,alta,baixa,analise tecnica,macd
Trend Flow Oscillator O Trend Flow Oscillator é um indicador de fluxo e momentum de mercado, desenvolvido para ajudar o trader a identificar a força e a direção do movimento com clareza, simplicidade e leitura visual rápida. Ele é especialmente eficiente em gráficos de 5 minutos (M5) , onde a mudança de fluxo acontece com mai
FREE

BEHOLD!!!
One of the best Breakout Indicator of all time is here. Multi Breakout Pattern looks at the preceding candles and timeframes to help you recognize the breakouts in real time.
The In-built function of supply and demand can help you evaluate your take profits and Stop losses
SEE THE SCREENSHOTS TO WITNESS SOME OF THE BEST BREAKOUTS
INPUTS
MaxBarsback: The max bars to look back
Slow length 1: Period lookback
Slow length 2: Period lookback
Slow length 3: Period lookback
Slow leng
FREE

Velas Multi Time Frame
Las velas multi time frame, también conocidas como "MTF candles" en inglés, son un indicador técnico que permite visualizar velas japonesas de un marco temporal diferente al marco temporal principal en el que estás operando. Este enfoque ofrece una perspectiva más amplia del comportamiento del precio, lo que resulta especialmente útil para los traders que emplean estrategias de acción del precio. A continuación, se detallan los conceptos clave relacionados con este indic
FREE

Neon Trend – Advanced Trend & Momentum System Neon Trend is not just an indicator; it is a complete trading system condensed into a single, elegant window. Designed for modern traders who demand clarity, this tool combines a Normalized Momentum Oscillator with a powerful Multi-Timeframe (MTF) Dashboard . Stop trading against the trend. Let Neon Trend illuminate the market structure for you. Why Neon Trend? Trading becomes difficult when you lose track of the "Big Picture." Neon Trend solves t
FREE
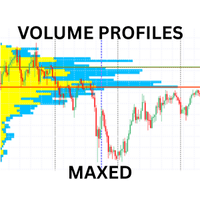
Advanced Volume Profile Indicator for MT5
Transform your trading with professional-grade volume analysis. This comprehensive volume profile indicator delivers institutional-quality market insights with multiple profile types, advanced alert system, and customizable display options. KEY FEATURES Multiple Profile Types Visible Range Profile: Analyzes volume within the current chart window Fixed Range Profile: Custom date range analysis with visual markers Session Profile: Automatic daily/week

Market Session and Custom Session draws market session zones (Asia, London, New York) plus a user-defined session directly on your chart — including session highs/lows, optional filled areas, labels and hover tooltips. Built for intraday traders, scalpers and analysts who need to spot session structure and recurring levels quickly. Highlights Immediate visual reference for major trading sessions. Automatic session High/Low markers — great for breakout setups and volatility analysis. User-definab
FREE
This indicator is a technical tool based on harmonic approximations of solar and lunar cycles. It does not use exact astronomical positions. This indicator uses mathematical waves to approximate daily solar and monthly lunar cycles for trading purposes. It captures general market rhythms influenced by day/night and moon phases, but it does not track exact astronomical positions . Do your analysis and study on back test before purchase. The Advanced Astrological Indicator is a m
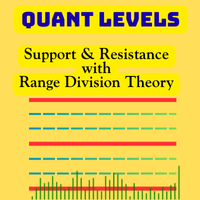
Quant Levels Indicator is a premium component of the Quantitative Trading Analysis Toolkit , designed to transform subjective trading into data-driven decision making. This advanced tool provides institutional-grade support and resistance analysis directly on your MT5 charts. " Please support our work by leaving a review ". As a thank-you gift , we’ll share a special template that helps you display signal trade history directly on your chart. Free indicator to visualize any MT5/MT4 signals i
FREE
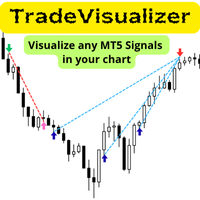
O indicador Trade Visualizer dá vida aos seus dados de trading, exibindo todo o histórico de operações diretamente nos gráficos do MT5. Seja para analisar seu próprio desempenho ou estudar sinais de traders do MQL5, esta ferramenta transforma dados brutos em visuais claros e intuitivos. Cada operação é mostrada com setas de entrada e saída, linhas conectadas e dicas detalhadas com preços, lucros, volumes e pips. Observação: Se você baixou este indicador, envie-nos uma mensagem com seu e-mail par
FREE

"Spotting emerging trends, defining correction periods, and anticipating reversals can benefit your trading in many ways..." So be it: Higher Highs & Lower Lows indicator. This is an indicator created by Vitali Apirine and presented to the public through the article "Time To Buy. Time to Sell - It's a Stochastic, Higher Highs & Lower Lows" in the Stocks & Commodities magazine . This is a Momentum indicator that helps determine the direction of a trend. Higher Highs and Lower Lows are two indicat
FREE
The Pulse indicador que mostra o período de acumulação em tempo real. Em palavras simples: acumulação é quando o "dinheiro inteligente" coleta silenciosamente um ativo antes de lançar um movimento poderoso no mercado. No gráfico, parece que o preço está "preso" em um intervalo. Esta é a fase de acumulação-alguém está se preparando para uma grande jogada. E se você aprender a perceber esses momentos — quando o mercado parece "congelar", mas ao mesmo tempo a tensão é sentida-você pode estar no lu

One of the best tools for analyzing volume,
Weis Wave was idelized by David Weis, to facilitate the reading of directional flow. For the VSA method disciples it is an evolution of the practices created by Richard Wycoff, facilitating a predictive reading of the market, always seeking an accumulation and distribution of the negotiated contracts.
Cumulative wave volume Range of wave ( removed) Average Wave volume Ref "Tim Ord lectures" ( removed)
FREE

Prevê o movimento mais provável de preços no curto prazo com base em cálculos matemáticos avançados.
Características Estimativa do movimento imediato dos preços ; Calcula a tendência real do mercado; Calcula os níveis de suporte e resistência mais importantes; Algoritmos otimizados para fazer cálculos matemáticos complexos com um uso mínimo de recursos do sistema; Auto-ajustável para um melhor desempenho, por isso é capaz de funcionar corretamente em qualquer ativo (não importa o quanto seja ex
FREE

The Horse Signal 1.26 – Price Action AI Indicator for Gold & Forex Overview: Start your 2026 trading year with "The Horse Signal," the latest precision tool from the WinWiFi Robot Series. Designed specifically for traders who demand high-accuracy entries, this indicator utilizes advanced Price Action analysis combined with an AI scanning algorithm to identify high-probability reversal and trend continuation points in real-time. Key Features: Dynamic Price Action Scan: Automatically analyzes can
FREE
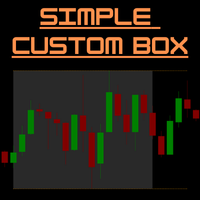
SimpleCustomBox – Indicador de Caixa de Sessão e Linhas de Máxima/Mínima para MT5 Visão geral:
SimpleCustomBox é um indicador poderoso e fácil de usar para o MetaTrader 5 que permite destacar visualmente sessões de negociação específicas no seu gráfico.
Defina intervalos de tempo personalizados, veja instantaneamente a máxima e mínima da sessão e tome decisões mais inteligentes com limites visuais claros.
Perfeito para traders intradiários, scalpers e todos que operam com padrões de preço de cu

Muitas vezes precisamos saber a mudança repentina de tendência que acontece no gráfico e isto da para ser confirmado através de indicadores. Este indicador mostra os momentos de reversão de tendência e como em que tendência o preço está se deslocando. Fundo personalizado, não precisa configurar as cores no gráfico, basta arrastar o indicador! Indicação através de setas. - Seta azul: Tendência de Alta. - Seta Rosa: Tendência de Baixa. OBS: Indicador grátis, talvez o suporte demore para responder
FREE
O Mercado MetaTrader é um site simples e prático, onde os desenvolvedores podem vender seus aplicativos de negociação.
Nós iremos ajudá-lo a postar e explicar como descrever o seu produto para o mercado. Todos os aplicativos no Mercado são protegidos por criptografia e somente podem ser executados no computador de um comprador. Cópia ilegal é impossível.
Você está perdendo oportunidades de negociação:
- Aplicativos de negociação gratuitos
- 8 000+ sinais para cópia
- Notícias econômicas para análise dos mercados financeiros
Registro
Login
Se você não tem uma conta, por favor registre-se
Para login e uso do site MQL5.com, você deve ativar o uso de cookies.
Ative esta opção no seu navegador, caso contrário você não poderá fazer login.