YouTubeにあるマーケットチュートリアルビデオをご覧ください
ロボットや指標を購入する
仮想ホスティングで
EAを実行
EAを実行
ロボットや指標を購入前にテストする
マーケットで収入を得る
販売のためにプロダクトをプレゼンテーションする方法
MetaTrader 5のためのテクニカル指標 - 20
Liquidity Pressure Index (LPI) is an advanced technical indicator designed to uncover the hidden battle between buyers and sellers in the market. Unlike conventional oscillators that only rely on price movements, LPI integrates market depth (order book data), ATR-based volatility compression, and adaptive smoothing to give traders a deeper view of true liquidity dynamics.
By combining price action with volume absorption and order flow pressure, the LPI helps traders anticipate shifts in market
FREE

ICT Unicorn Hunter – Multi-Timeframe Smart Setup Detector IMPORTANT: This is a Multi-Timeframe Scanner, looking for 'Unicorn' setups. A Unicorn in this definition is a liquidity sweep, market structure shift and creation of a Fair Value Gap overlapping with the last opposite-close candle before the liquidity sweep (breaker). This scanner does NOT provide visualisation of the Unicorn on the chart.
For visualisation, use the Unicorn Tracker indicator, which is designed to work with the Unicorn
FREE

親愛なる友人、ご清聴ありがとうございました。 異なる通貨ペアの動きが相互に関連していることを観察したい場合は、インジケーター Visual Correlation に注目してください。 異なる通貨ペアの動きは相互に関連しています。 Visual Correlation インジケーターを使用すると、スケールを維持しながら 1 つのチャート上にさまざまな金融商品を表示できます。 正の相関、負の相関、または相関なしを定義できます。
親愛なる友人、あなたは、いくつかの楽器が他の楽器よりも先に動くことをご存知でしょう。 このような瞬間は、グラフを重ね合わせることで判断できます。
親愛なる友人へ、チャート上に商品を表示するには、Symbol フィールドに商品名を入力する必要があります。
Version for MT4 https://www.mql5.com/ja/market/product/33063
FREE

Pro ADX Histogram: Visual Momentum & Trend Strength Indicator Elevate your technical analysis with ADX Histogram, an innovative MetaTrader 5 tool that transforms the classic Average Directional Index (ADX) into an intuitive, visual powerhouse. This indicator combines trend strength and momentum direction into a single, easy-to-read histogram, allowing you to assess market conditions and spot potential trading opportunities faster and with greater clarity. Trading Idea & Core Logic The indicator
FREE
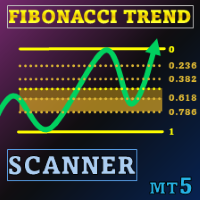
スペシャルオファー : ALL TOOLS 、1つあたり $35 のみ! New tools will be $30 for the first week or the first 3 purchases ! Trading Tools Channel on MQL5 : Join my MQL5 channel to update the latest news from me ボラティリティの高いトレード環境では、パワフルで直感的な分析ツールがあれば、チャンスを素早く捉えることができます。Fibonacci Trend Scanner は従来のFibonacciインジケーター機能とSuperTrendを統合しただけでなく、通貨ペアのスキャン、マルチタイムフレームのモニタリング、そしてトレンドが強気から弱気へ(またはその逆)転換する際にインテリジェントアラートを出す機能など、機能を拡張しています。 See more MT4 version at: Fibonacci Trend MT4 Scanner See more products at: A
Cumulative Delta Volume Indicator for MT5 (CDV Indicator for MT5) Volume-Based Market Sentiment and Trend Strength Indicator The Cumulative Delta Volume (CDV) indicator analyzes the balance between buying and selling volume to reveal the underlying market sentiment.
By accumulating the difference between upward and downward volume, it shows whether buyers or sellers are in control and helps traders confirm the strength or weakness of a trend. This tool provides both candle-based visualization an

I think you all know Donchian Channels. so I am not going to write about it.
With this indicator I tried to create Donchian Trend Ribbon by using Donchian Channels.
How it works ?
- it calculates main trend direction by using the length that is user-defined. so you can change it as you wish
- then it calculates trend direction for each 9 lower lengths. if you set the length = 20 then the lengths are 19, 18,...11
- and it checks if the trend directions that came from lower lengths is same
FREE

This indicator displays buy or sell signals according to Bill Williams' definition of the Trading Zone. [ Installation Guide | Update Guide | Troubleshooting | FAQ | All Products ] Easy to use and understand Avoid trading flat markets Deterministic indicator with clear rules The indicator is non-repainting It implements alerts of all kinds It has straightforward trading implications. A blue arrow is a buy signal A red arrow is a sell signal According to Bill Williams trading in the zone helps t
FREE

The ChanLun or Chan theory is one of the most popular trading theories in China. But it seems like that it has little influence in western countries. Actually, the Chan Theory is based on a sophisticated mathematical model. The basic idea ChanLun is to simplify the bar chart by its model. With the help of ChanLun, a trader can analyze and predict the trend of future goods, stocks.
In ChanLun, there are several basic elements called fractals, strokes, line segments and pivots . A trader should pa

Boom and Crash Gold miner v2 Trading indicator based on market momentum works on m1 for boom and crash 1000 and M5 time frame for normal trading pairs wait for blue arrow to appear plus change of candle stick color and candlesticks must be above the 2 modified moving averages then you can buy the market. wait for orange arrow to appear plus change of candle stick color and candlesticks must be below the 2 modified moving averages then you can sell the market.
Opening Range Breakout Pro MT5: Stop Guessing, Start Trading the Open. Most traders spend the first 30 minutes of the market open sweating over their keyboards, wondering which way the wind is blowing. Opening Range Breakout Pro does the heavy lifting for you, pinning down the Initial Balance like a pro wrestler so you can stop chasing candles and start hitting targets. Whether it is the London Open volatility or the New York chaos, this indicator draws the line in the sand. You just decide whi

Major Swing Fibonacci Indicator - Professional Trading Tool What It Does Automatically detects major swing points not internal noise Generates buy/sell signals at key Fibonacci levels Displays professional GUI panel with real-time analysis Marks major swings with visual indicators Trading Strategy BUY at 38.2%-61.8% Fibonacci support in uptrends SELL Past performance is not indicative of future results. This indicator is for educational and informational purposes only and does not constitute in
FREE
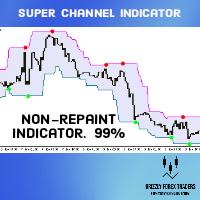
Super Signals Channel Indicator Its channel is a non-repaint indicator that reacts more with recent price movements. For this reason, the Super Signals Channel Indicator is a better match for short-term or day trading strategy. The Super Signals Channel only plots swing trading opportunities. So most of its trade signals appear during consolidation or sidelined periods of the market. Super Signals Channel Indicator for MT5 Explanation The green band below the price shows the dynamic support lev

In many strategies, it's quite common to use a scaled ATR to help define a stop-loss, and it's not uncommon to use it for take-profit targets as well. While it's possible to use the built-in ATR indicator and manually calculate the offset value, it's not particularly intuitive or efficient, and has the potential for miscalculations.
Features Configurable ATR offset Upper and Lower Band. configurable ATR scaling factor alternate(non-chart) ATR timeframe explicitly defined input types to improv
FREE

Trend Catalyst Pro 7重確認、スマートアラート、ニュース概要、MetaTrader 5用の統合ダッシュボードを備えたプロフェッショナルなマルチトレンドインジケーター。 Trend Catalyst Proは、7つの実証済み市場インジケーターのシグナルを1つの明確なスコアに統合します。各インジケーターを個別に分析する代わりに、チャートローソク足上に表示される結果を取得します: "6/7 LONG"や"7/7 SHORT"などの矢印とテキスト シグナル強度に基づいて色分けされたローソク足 すべての値をリアルタイムで明確に表示するダッシュボード ニュースによる次の強い動きがいつ発生する可能性があるかを示すニュースライン 目標は明確です:推測を減らし、より客観的な確認、より明確な決定。 7ポイントトレンドスコアの仕組み 各ローソク足は7つのコンポーネントに基づいて評価されます。各強気条件に対してロング側に1ポイント、各弱気条件に対してショート側に1ポイントがあります。結果は0から7のスコアです。 以下が使用されます: ADX(+DIおよび−DI付き) ADXはトレンドが存在
FREE

This indicators automatically draws the support and resistances levels (key levels) for you once you've dropped it on a chart. It reduces the hustle of drawing and redrawing these levels every time you analyse prices on a chart. With it, all you have to do is drop it on a chart, adjust the settings to your liking and let the indicator do the rest.
But wait, it gets better; the indicator is absolutely free! For more information: https://youtu.be/rTxbPOBu3nY For more free stuff visit: https:
FREE

This is an indicator of trading sessions that can display all levels (Open-High-Low-Close) for four sessions . The indicator can also predict session levels. Sessions can be drawn with lines or rectangles (empty or filled), lines can be extended to the next session. You can easily hide/show each session by pressing hotkeys (by default '1', '2', '3', '4'). You can see ASR (Average Session Range) lines (default hotkey 'A'). This is similar to the ADR calculation, only it is calculated based on

Megatron Shark Indicator – MT5 Harmonic Pattern Detection Tool The Megatron Shark Indicator is a MetaTrader 5 tool for detecting and displaying Shark harmonic patterns directly on the chart. It automatically identifies bullish and bearish Shark formations, calculates entry, stop-loss, and take-profit levels, and provides real-time alerts. This allows traders to quickly integrate harmonic pattern analysis into their trading process without manual drawing. Advantages * Automatic Pattern Detection
FREE

Overlay indicator on chart between 2 pairs
The Timeframe Overlay indicator displays the price action of timeframes on a single chart, allowing you to quickly assess different timeframes from a single chart. The advantage is to observe and follow the correlations of price movements in real time to help you find potential trades at a glance.
---- Symbol 1 ----
Symbol = EURUSD
Correlation Inverse = false
Display = true
Ratio
FREE

HMA Color – Master Smoothed A clean, high-precision visual Hull Moving Average indicator with fully smoothed trend color display. Designed for professional scalpers and algorithmic traders who want a simple, fast, powerful trend view without noise. This indicator is built with a double smoothing system , making the Hull curve extremely soft and responsive.
When the trend is bullish, the HMA line automatically switches to Green and shows upward candles.
When the trend is bearish, the HMA line swi
FREE

Trading Viewで見かけたTMA - RSI DivergenceをMT5でも使えるように作成しました。 TMA RSI Divergence(TMA-RSIダイバージェンス)とは、 TMA( Triple Moving Average :三重加重移動平均) と RSI(Relative Strength Index:相対力指数) を組み合わせたテクニカル指標で、 価格とRSIの動きが逆行する「ダイバージェンス(逆行現象)」を検出する際に使われる手法です 。 通常RSI単体で見るのではなく、 RSIをTMAで平滑化(スムージング) し、 TMAライン自体をRSIの代わりに使う ことで、相場の転換点やトレンドの弱まりを、より明確に、そして長期的な視点で捉えることを目指します。 仕組みと特徴 RSIの平滑化 : 通常のRSIのノイズ(小さな値動き)を、TMAで平均化することで、トレンドの方向性や強い転換シグナルを際立たせます。 TMAをRSIの代わりに : TMA自体をオシレーター(買われすぎ・売られすぎを示す指標)として使い、価格とのダイバージェンスを見ることもあります。 5
FREE

A pin bar pattern consists of one price bar, typically a candlestick price bar, which represents a sharp reversal and rejection of price. The pin bar reversal as it is sometimes called, is defined by a long tail, the tail is also referred to as a “shadow” or “wick”. The area between the open and close of the pin bar is called its “real body”, and pin bars generally have small real bodies in comparison to their long tails.
The tail of the pin bar shows the area of price that was rejected, and t
FREE

説明
Spread Historyは、別ウィンドウでローソク足ごとにスプレッドの履歴を表示し、同時にスプレッドの移動平均を表示するシンプルながら必須のインジケーターです。リアルタイムラインとメインチャートへのオーバーレイテキストにより、マーケットの各局面でブローカーが適用するスプレッドを手軽に監視できます。 目的 各ローソク足ごとにブローカー提供の実際のスプレッドを表示 設定可能な期間でスプレッドの移動平均を計算・表示 メインチャート上で現在のスプレッド値と移動平均値をオーバーレイ表示 スプレッドが高い時間帯(例:取引開始/終了、経済指標発表前後)を特定 不利な市場環境でのトレードを回避 主な機能 カスタマイズ可能なカラーのスプレッド履歴ライン表示 N本のローソク足を対象とした単純移動平均(SMA)計算 メインチャート上へのスプレッド値ラベル表示 移動平均期間、ライン色、テキスト色などのパラメーター設定 ラグなしのリアルタイム更新 対象ユーザー スプレッドの高騰を避けたいスキャルパーおよびデイトレーダー 複数のブローカーやデモ/リアル口座の比較を行うトレーダー 安定したスプレッドを
FREE
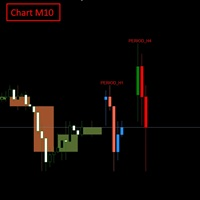
FULL PRODUCT DESCRIPTION Multi-Timeframe Candle Overlay Pro lets you view higher-timeframe candles directly on your current chart with absolute accuracy. When trading lower timeframes like M1–M15, understanding what the H1–H4 candles are forming is a major advantage: you avoid counter-trend entries, read market context faster, and trade with more confidence.
The indicator supports up to 2 higher timeframes, drawing full OHLC candles with precise positioning—no misalignment, no distortion. C
FREE
チャート上で描画するインジケーターをご紹介します:チャート上で創造力を解放しましょう!
トレードチャートに注釈をつけるのに苦労して、分析を理解したりアイデアを効果的に伝えるのに苦労していませんか?それならお探しのものはこちらです!私たちは、チャート上で簡単に描画や注釈をすることができる画期的なツール、「チャート上で描画するインジケーター」をご紹介できることを喜んでいます。わずか数回のクリックやペンのストロークで、あなたのチャートに直接描画や注釈を追加できます。
私たちの革新的なチャート上で描画するインジケーターは、チャート体験を向上させ、あなたの創造力の可能性を引き出すことを目指しています。この強力なツールを手にすれば、思考を簡単に表現し、重要な水準を示し、パターンを強調表示し、トレード戦略を視覚的に表現することができます。経験豊富なトレーダー、テクニカルアナリスト、またはトレーディングの魅力的な世界を探求する初心者であっても、チャート上で描画するインジケーターは、チャートとの対話方法を根本から変える非常に価値のあるツールです。
主な特徴:
使いやすいインターフェース:シーム
FREE

このインジケーターは、Patrick Mulloy、Mark Jurik、Chris Satchwell、Alan Hull などの著者によって開発された 37 種類の移動平均のバリエーションを組み込んだ分析ツールです。履歴仮想テストの機能を提供します。 このインジケーターは、金、暗号通貨、株価指数、通貨ペア、その他の資産など、さまざまな金融商品に使用できます。 統合されたビジュアル バックテスターを使用すると、仮想取引ポジションをシミュレートし、結果を追跡し、各移動平均の変化の有効性を視覚的に評価できます。これにより、トレーダーは市場の状況を迅速に特定できます。 このツールには、「最大可能利益」機能(理想的な終了ポイント)も含まれており、最も収益性の高いポイントで各ポジションをクローズした場合の仮想的な取引結果を示します。 さらに、仮想ストップロス機能も提供されており、視覚的なテスト中にリスク管理と潜在的な損失の制御が可能になります。これにより、トレーダーは現実的な状況で戦略を評価することができます。 このツールは、取引戦略の最適化を目指す経験豊富なトレーダーにとっても、移動平均が取
FREE

このインジケーターは、ボリンジャータイプのボラティリティチャネルの上限バンドと下限バンドのみを表示し、中央の移動平均線は描画しません。主な目的は、クリーンで柔軟なボラティリティエンベロープを提供し、トレーダーがチャネル境界に対する価格の動きに集中できるようにすることです。 従来のボリンジャーバンドとは異なり、本インジケーターでは移動平均線は内部計算のみに使用されます。中央線は視覚的な混雑を減らし、必要に応じてユーザーが別途管理できるよう、意図的に非表示となっています。 上限バンドと下限バンドにはそれぞれ独立した色を設定でき、視認性の向上やチャートテーマ、個人の好みに柔軟に対応できます。従来のボリンジャーバンドの外観を使用したい場合は、同じパラメータの移動平均線を別途追加することで再現可能です。期間と価格ソースを一致させることで、標準的なボリンジャー構造を効果的に再構築できます。 現段階では、本インジケーターは終値に基づく単純移動平均(SMA)のみに意図的に制限されています。この設計により、計算の透明性、一貫性、パフォーマンスの安定性が確保されます。十分なユーザー要望があれば、将来のアッ
FREE
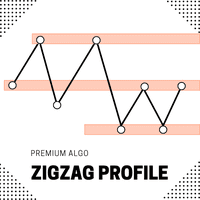
Introducing the ZigZag Profile — a powerful tool designed to identify high-probability pivot zones where price action frequently reverses. This indicator analyzes historical price data to pinpoint key areas where price has pivoted multiple times, providing traders with actionable insights into potential support and resistance levels. The ZigZal Profile indicator continuously scans for zones where price has reversed direction the most, highlighting these critical areas on your chart. By focusing
FREE

Gold TL MTF - this is a fine stock technical indicator. The indicator algorithm analyzes the movement of the asset price and reflects trend lines along the fractals of a specific timeframe (TF).
Benefits of the indicator: The indicator produces signals with high accuracy. The confirmed signal of the indicator does not disappear and is not redrawn. You can trade on the MetaTrader 5 trading platform of any broker. You can trade any assets (currencies, metals, cryptocurrencies, stocks, indices e
FREE
https://www.mql5.com/en/users/gedeegi/seller
The "RSI+ with 123 Fractals" logo is designed to provide a clear and professional visual representation of a complex technical indicator, focused on precise market analysis and reliable patterns. Each element in the design is crafted to reflect the philosophy and strengths of the indicator within the trading world. Design Elements: "RSI+" Text in Bold and White:
The main "RSI+" text is chosen to be the focal point, with a bold and clear font. The us
FREE

The Nadaraya-Watson Envelope is a non-parametric regression-based indicator that helps traders identify trends, support, and resistance levels with smooth adaptive bands. Unlike traditional moving averages or standard deviation-based envelopes, this indicator applies the Nadaraya-Watson kernel regression , which dynamically adjusts to price movements, reducing lag while maintaining responsiveness.
Key Features: • Adaptive Trend Detection – Smooths price action while remaining responsive to m
FREE
This is a powerful, session-aware breakout indicator designed for serious traders who thrive on volatility and structure. Engineered for precision, it identifies high-probability breakout zones during the London and New York trading sessions—where the market moves with intent. Key Features: Session Range Detection
Automatically detects and highlights the key price range of London and New York sessions. Breakout Confirmation
Identifies breakout candles after the session range, with clear bullis
FREE

Presentation
Another indicator that makes scalping on tick charts easier, it displays an Heiken Ashi graph in Ticks.
It allows to detect entry points and trend reversals. Recommended number of ticks in a candle : 5, 13 or 21.
Parameters Ticks in candle: Number of ticks in a candle (default 5), Displays Trend arrows : displays a trend arrow based on EMA8 and EMA20 crossing, Displays MM50, Displays MM100, Max Candle (CPU): number of candles max to manage, low value will save ressources of your
FREE

A simple price action indicator to highlight inside and outside bars (candles) with colors. It is possible to choose what type of bar can be highlighted among: inside, ouside or both. It is can be possible to choose a first specific color for the shadow and the border of bars (candles), a second specific color for high/bull bar (candle) and a third specific color for down/bear bar (candle)
FREE

When working with several assets and having several open positions in different assets, it is a little complicated to visualize how much profit or loss is in each asset, so with this problem in mind I developed this indicator where it facilitates the visualization of open operations in each asset , where you will be able to open several different assets and you will be able to visualize the individual result of each asset and speed up your decision making in your trades.
FREE

With this system you can spot high-probability trades in direction of strong trends. You can profit from stop hunt moves initiated by the smart money!
Important Information How you can maximize the potential of the scanner, please read here: www.mql5.com/en/blogs/post/718109 Please read also the blog about the usage of the indicator: Professional Trading With Strong Momentum.
With this system you have 3 reliable edges on your side: A strong trend (=high probability of continuation) A deep pull

FourAverageは、トレンド検出の新しい単語です。 情報技術の発展と多数の参加者に伴い、金融市場は時代遅れの指標による分析にあまり適していなくなっています。 移動平均や確率などの従来のテクニカル分析ツールは、純粋な形でトレンドの方向やその反転を決定することはできません。 1つの指標は、14年の歴史に基づいて、そのパラメータを変更することなく、将来の価格の正しい方向を示すことができますか? 同時に、横向きの市場の動きで妥当性を失うことはありませんか? 答え:はい、それはできます。 私たちのチームは、変化する市場の状況に適応するためのかなり強力で効果的なメカニズムを持つ指標を開発しました。 2025年には、主要なトレンド指標"Four平均"は開発の新しい段階に入っています。 現代の暗号通貨と株式市場は、この指標のために作成されたようです。 独自の平滑化式を使用すると、通貨ペアまたは他の楽器の任意の機能のための指標を調整(パターンを識別)することができます。 さて、利益を上げるためには、1つの指標で十分であり、これはほんの始まりに過ぎません。 他のツールと組み合わせて、または信号フィル

Verve AI Reversal Pro Indicator Pro は、極めて高い精度と比類なき市場洞察を求めるトレーダーのための究極のパートナーです。最先端の人工知能を駆使し、価格動向、取引量、ボラティリティをリアルタイムで継続的に分析。反転ポイントが完全に形成される前に高確率の転換点をいち早く捉えます。高度な機械学習アルゴリズムと実績あるテクニカル分析手法をシームレスに融合し、Verve AI は複雑なデータをクリアかつ自信に満ちたシグナルとして提供。激動のマーケットでも安心して取引できます。
Verve AI Reversal Pro Indicator Pro の主な機能:
• インテリジェントな反転検知: AIエンジンが数百の価格パターンと統計指標をリアルタイムでスキャンし、大きなトレンド変化の兆候となる微細なシグナルを検出。 • ダイナミックなサポート&レジスタンス表示: 反転が起こりやすい重要なプライスレベルを自動でハイライトし、エントリー・エグジットの正確なポイントを視覚的にガイド。 • 自動適応トレンド分析: トレンド相場でもレンジ相場でも、Verv

KT OBV Divergence は、価格と OBV(オンバランスボリューム)オシレーターとの間に形成される通常および隠れたダイバージェンスを表示します。
機能
非対称なダイバージェンスは除外され、精度が向上し、チャートの見やすさも保たれます。 トレンドの反転とトレンド継続の両戦略に対応。 エキスパートアドバイザーへの組み込みに完全対応。 エントリーにもエグジットにも使用可能。 すべての MetaTrader アラートに対応。
ダイバージェンスとは何か?
テクニカル分析において、価格が高値を更新している場合、オシレーターも同様に高値を更新すべきです。価格が安値を更新している場合も、オシレーターはそれに追随すべきです。このような通常の関係が崩れたとき、価格とオシレーターが乖離(ダイバージェンス)していると判断されます。 ダイバージェンスには、以下の2つの主要な種類があります: 通常の強気ダイバージェンス: 価格がより低い安値をつけるが、オシレーターはより高い安値をつける場合。 通常の弱気ダイバージェンス: 価格がより高い高値をつけるが、オシレーターはより低い高値をつける場合

KT Volume Profile は、取引量の蓄積データをY軸上にヒストグラムとして表示するインジケーターです。指定された時間範囲や価格帯におけるトレーディングアクティビティを視覚的に把握することが可能です。
Volume Profile における POC(ポイント・オブ・コントロール)
POC は、プロファイル全体の中で最も取引量が多かった価格レベルを示します。この価格帯はサポートやレジスタンスとして、また価格が方向転換前に再度試す重要なレベルとして使われることが多いです。
特徴 非常に簡単に使えます。チャート上で四角形をドラッグ&ドロップするだけで、リアルタイムでボリュームプロファイルが更新されます。 価格がPOCを越えたときにアラートを出すことが可能です。 ゼロから設計され、CPUとメモリの使用を最小限に抑えています。
入力パラメーター ボリュームソース: ティックボリューム / 実際の取引量。 プロファイルの色: ヒストグラムの表示色。 ボックスの幅: 四角形の横幅。 ボックスの色: 四角形の色。 POC を表示: true/false POCの色:
The MTF (Multi-Timeframe) Candles indicator is a powerful tool that allows you to display candles from a higher timeframe (e.g., H1, H4, D1) directly on a lower timeframe chart (e.g., M5, M15, M30). The Problem It Solves: Instead of constantly switching back and forth between charts to analyze the main trend and detailed price action, this indicator merges both perspectives into one. You can instantly see the "big picture" while staying focused on trading signals on your current timeframe. Core
FREE

Introducing Order Blocks Breaker , a brand-new way to identify and leverage order blocks in your trading strategy. After developing multiple order block tools with unique concepts, I’m proud to present this tool that takes things to the next level. Unlike previous tools, Order Blocks Breaker not only identifies order blocks but also highlights Breaker Order Blocks —key areas where the price is likely to retest after a breakout. MT4 - https://www.mql5.com/en/market/product/124101/ This t

このインジケーターは、チャート上の重要なテクニカル レベルを表示します。 これらのレベルは、価格変動のサポートまたはレジスタンスとして機能します。
最も重要なレベルは 100 ポイントと 50 ポイントの倍数です。 レベルを 25 ポイントの倍数で表示することもできます。
価格がそのレベルに達すると、アラートまたはプッシュ通知が表示されます。
MT4のバージョン https://www.mql5.com/ja/market/product/69486 設定 Show Levels 100 pips - レベルを 100 pips の倍数で表示します。 Show Levels 50 pips - レベルを 50 ピップスの倍数で表示します Show Levels 25 pips - レベルを 25 ピップの倍数で表示します Color Levels 100 pips - 100 ピップで割り切れるレベルの線の色 Color Levels 50 pips - 50 ピップスで割り切れるレベルの線の色 Color Levels 25 pips - 25 ピップで割り切れるレベルの線の
FREE

収益性の高い取引機会を簡単に特定するのに役立つ強力な外国為替取引インジケーターをお探しですか?ビースト スーパー シグナル以外に探す必要はありません。 この使いやすいトレンドベースのインジケーターは、市場の状況を継続的に監視し、新しいトレンドを検索したり、既存のトレンドに飛びついたりします。ビースト スーパー シグナルは、すべての内部戦略が一致し、互いに 100% 合流したときに売買シグナルを発するため、追加の確認は不要です。シグナル矢印アラートを受け取ったら、単に売買します。
購入後、プライベート VIP グループに追加されるようにメッセージを送ってください! (完全な製品購入のみ)。
購入後、最新の最適化されたセット ファイルについてメッセージを送ってください。
MT4版は こちらから。
Beast Super Signal EA は こちらから 入手できます。
コメント セクションをチェックして、最新の結果を確認してください。
ビースト スーパー シグナルは、1:1、1:2、または 1:3 のリスクと報酬の比率に基づいて、エントリー価格、ストップ ロス、テイク プ

Original supertrend indicator in Tradingview platform. Indicator type: Price Action indicator Introduction: The Supertrend Indicator - Enhancing Your Trend Analysis. If you haven't yet found a Supertrend indicator with good graphics on the MQL5 platform, this is the indicator for you. Overview: The Supertrend Indicator is a powerful tool designed to provide traders with valuable insights into the current and historical trends of financial markets. It serves as a valuable addition to any t
FREE
Spike Detector Rider – Intelligent Trading in Volatile Markets Introduction
The Spike Detector Rider is an advanced system for MetaTrader 5 designed to detect explosive price movements in high-volatility assets such as synthetic indices and commodities.
It combines volatility filters, trend analysis, and automated risk management to provide intelligent trade confirmations. After purchase, please send me a private message via MQL5 to receive the installation manual and setup instructions. Asset

AstroCycles: Advanced Financial Astronomy Indicator Overview AstroCycles is a sophisticated technical analysis tool developed for the MetaTrader 5 (MQL5) platform. It bridges the gap between orbital mechanics and financial market analysis by calculating precise astronomical cycles and visualizing them directly on your trading chart. Unlike standard indicators that rely on past price data, AstroMaster utilizes high-precision astronomical algorithms (Keplerian Elements and Brown’s Lunar Theory)
FREE

This indicator recognizes a special type of Inside Bar formation which is formed by a big Master candle followed by 4 smaller candles (please see the strategy explanation below). Features Plots buy/sell stop lines on the chart as well as well as take profit and stop loss levels. The TP/SL levels are based on the Average True Range (ATR) indicator. Object colors are changeable. Sends you a real-time alert when a Master candle formation is identified - sound / popup / email / push notification. On

この強力なツールは、トレンドラインを自動的に識別し、取引戦略を合理化し、より多くの情報に基づいた決定を下すのに役立ちます。 mt4バージョン
重要な機能 自動トレンドライン検出 :「基本的なトレンドライン」インジケーターは、潜在的なトレンドラインの市場をスキャンし、チャートに即座に表示します。これにより、貴重な時間を節約し、重要な傾向を見逃すことはありません。 ユーザーフレンドリーパネル :私たちのインジケータには、さまざまなトレンドラインを簡単に描画できる美しく直感的なパネルが付属しています。パネルは、すべてのエクスペリエンスレベルのトレーダー向けに設計されているため、数回クリックしてトレンドラインを追加、編集、または削除できます。 お気に入りのトレンドラインを保存して管理 :あなたにとって最も重要なトレンドラインを追跡します。私たちのインジケータを使用すると、好みのトレンドラインを保存し、チャートを再訪するたびに常に利用できるようにします。 汎用アプリケーション :外国為替、株、または暗号通貨を取引しているかどうかにかかわらず、「基本的なトレンドライン」インジケーターはさまざまな

Easy Trend , as the name implies, is an indicator that easily shows the prevailing trend by bringing several indicators into one. The strategy is: when all indicators point in the same direction a signal is triggered. When red, is a signal to sell, when blue, signal to buy. It is that simple :) There are a total of 9 indicators: Moving Average, RSI, CCI, Parabolic SAR, William's Range, Stochastic, MACD, ADX and Heiken Ashi. It is possible to configure each of these indicators to suit your way of

A clean Bollinger Bands indicator with single-color filling designed to reduce chart clutter. What is This Indicator? This is a Bollinger Bands technical indicator designed with visual simplicity in mind. Unlike standard Bollinger Bands implementations that display multiple colored lines and bands, this indicator uses a single-color filled area to represent the trading bands. This approach minimizes visual clutter while maintaining full functionality for technical analysis. How It Works The ind
FREE

バブルインジケーター ― 価格減速 + 出来高スパイク検出 価格が突然減速し、同時に出来高が急増したときに、チャート上に色付きの四角を表示するシンプルなビジュアルツールです。
(塗りつぶし機能と同心円状のバブル効果を含む)
市場が動き出す前の重要なタイミングを見極めるのに役立ちます。 インジケーターの役割: 市場が動く前に「ためらう」瞬間を検出 出来高が増えても価格があまり動かないポイントを表示 ブレイクアウトや転換の可能性を事前に察知 動作の仕組み: 現在のチャートよりも小さいタイムフレームを分析 異常に小さいローソク足を検出(価格の減速) 異常に高い出来高を検出(出来高スパイク) 緑(強気)または赤(弱気)の四角を表示 主な設定項目: 価格感度: 値が低いほど反応が敏感 出来高倍率: 値が高いほど検出が厳密 バブルサイズ: 表示の見やすさを調整 なぜ便利なのか: シンプルで視覚的にわかりやすい 複雑な計算は不要 興味深い市場パターンを見つけやすい 完全にカスタマイズ可能 レンジ相場、ブレイクアウト、または市場のダイナミクスを理解するのに最適です。

The Chandelier Exit Indicator for MT5 is a powerful tool designed to help traders manage trades by dynamically adjusting stop-loss levels based on market volatility. It is based on the Average True Range (ATR) and follows the trend, placing stop-loss levels above or below price action, depending on the trend direction. This makes it an effective tool for trend-following strategies, breakout trading, and risk management .
Key Features: • Dynamic Stop-Loss Placement – Adjusts stop-
FREE

Daily pivot are relatively important in trading.
This indicator have options to select 5 commonly use pivot point calculations.
User input Choose Pivot Point Calculation (Method Classic, Method Camarilla, Method TomDeMark, Method Fibonacci or Method Woodies.) Choose Applied Timeframe for the calculation (M5, M15, H1, H4, D1, W1 etc) Can be attached to any timeframe Choose color of Pivot point Note:
For MT4, please refer here : https://www.mql5.com/en/market/product/22280
FREE

COLORED TREND MA / MACD CANDLES draw MA Candles above/below Moving Average draw MACD Candles above and below 0 and Signal-Line
Your Advantage: a simple view of the trend direction a simple view over the higher trend direction a calmer chart for the eye clear rules can be defined Settings: Value Quick-Set : pre-Settings MACD 3 / 9 / 6 MACD customize MA Candles Fast EMA : 12 Slow EMA : 26 MACD SMA : 9 1. MA Period : default 14 and 20, which are my favorite for all timeframes, I believe in the 14
FREE
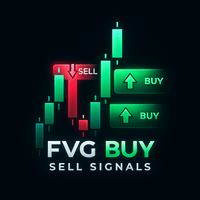
A Smart Price Imbalance Tool with Arrows, Labels, and FVG Zones The Fair Value Gap (FVG) Indicator is designed to automatically detect price imbalance zones on the chart – a widely used concept in Smart Money Concepts (SMC) and Institutional Trading Models (ICT) . These gaps, also known as imbalances or inefficiencies , often highlight areas where price may return to "rebalance" liquidity. Many professional traders consider these levels as high-probability zones for potential reversals, retrace
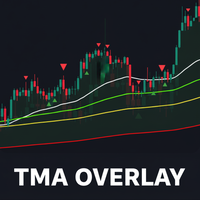
TMA Overlay Indicator for MT5 - User Guide 1. Introduction TMA Overlay is a versatile technical analysis indicator for the MetaTrader 5 platform. The indicator's goal is to provide traders with a comprehensive overview of the trend, potential entry signals, and key trading sessions, all integrated into a single chart. This is not a trading system, but a comprehensive analysis tool designed to help you make more informed decisions. 2. Core Indicator Components The indicator consists of multiple c
FREE

Probability emerges to record higher prices when MACD breaks out oscillator historical resistance level. It's strongly encouraged to confirm price breakout with oscillator breakout since they have comparable effects to price breaking support and resistance levels; surely, short trades will have the same perception. As advantage, many times oscillator breakout precedes price breakout as early alert to upcoming event as illustrated by 2nd & 3rd screenshot. Furthermore, divergence is confirmed
FREE

MATADOR GOLD – XAUUSD MT5 M5 Timeframe Scalp Signals MATADOR GOLD is a professional signal indicator designed for XAUUSD (Gold) scalping on the M5 timeframe , with optional higher-timeframe confirmation. This indicator does not open or manage trades automatically .
It provides structured buy and sell signals, intelligent filtering, and alerts, allowing traders to execute trades using their own strategy and risk management rules. Core Concept (Multi-Concept Architecture) MATADOR GOLD is built

The big figure is a crucial aspect of forex trading, serving as a reference point for trade execution, risk management, and technical analysis. By understanding the importance of the big figure and incorporating it into their trading strategies, forex traders can improve their decision-making process and increase the likelihood of successful trades. Why is the Big Figure Important? The big figure is important for several reasons: Simplification: Traders often refer to the big figure when discu
FREE

MACD ADVANCED - BRIEF DESCRIPTION INTRODUCTION MACD Advanced is an enhanced version of the traditional MACD indicator featuring an intelligent 4-color system that helps traders easily identify market trends and momentum. KEY FEATURES 1. Smart 4-Color System Bright Green (Lime) - Strong Bullish: MACD > 0 and MACD > Signal Light Green (DarkSeaGreen) - Weak Bullish: MACD > 0 but MACD < Signal ️ Bright Red (Red) - Strong Bearish: MACD < 0 and MACD < Signal Orange Red (OrangeRed)
FREE
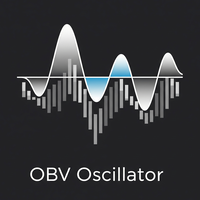
Overview The OBV Oscillator is a custom technical indicator for MetaTrader 5, designed to provide a clearer visualization of On Balance Volume (OBV) by transforming it into an oscillator. This indicator aims to assist traders in identifying trend confirmations, potential reversals, and momentum shifts by analyzing the relationship between price and volume. It features a customizable Moving Average (MA) for smoothing the OBV, a signal line for generating crossover signals, and an alert system to
FREE
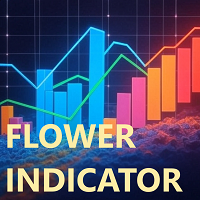
フラワーインジケーターは、主にトレンドを特定し、スキャルピングやデイトレード戦略を支援するテクニカル分析ツールです。
フラワーインジケーターは、テクニカル分析と価格動向分析に基づいたシグナルトレンドインジケーターです。色付きの花を使ってトレンドを視覚的に示します。青い花は上昇トレンド、赤い花は下降トレンドを示します。
各レベルはサポートラインとレジスタンスラインのように機能します(チャート上に+/- 200レベルとドットが表示されたら注意してください)。
買われ過ぎ/売られ過ぎの静的レベル、付随するバンド、両方、またはどちらかを突破した時にドットが表示されるように設定できます。
このインジケーターは、アキュムレーション/ディストリビューションゾーンを特定しながら、市場の反転の可能性を探ります。あらゆる銘柄と時間枠に対応しており、パラメータは自由に調整できます。各レベルはサポートラインとレジスタンスラインのように機能します。
FREE

Time Candle with Sound Alert
This indicator will be display the time left candle Features : 1. Multi Time Frames, Multi Pairs 2. Time Left 2. Position dynamic with Bid Price or Edge of Chart Screen 3. Font Size and Color 4. Display Current Spread, Maximum Spread and Minimum Spread
Note: Maximum and Minimum Spread will be reset when you change TF Tested On MT5 Version 5 Build 5200
If you want the source code, just PM me
FREE

Based on the Extreme Trend Indicator on Trading View converted for MT5. Usage of the Indicator is free, but if you want the source code, you can purchase the source code by messaging me.
Extreme Trend is an indicator that identifies when a new trend is forming and creates a trading signal. This indicator can be used for many markets, forex, gold etc. If you have any inquiries or want to create an EA using this indicator, you can message me.
FREE
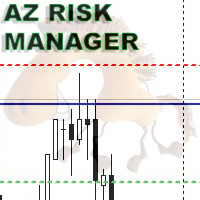
A simple indicator for calculating risk and automatically calculating the take profit line. In the settings, you enter the desired risk to profit ratio, the indicator will automatically calculate the volume for entry and show where to set the take-profit line to maintain the proportion. The risk is calculated based on your balance data. The information panel can be moved around the screen. The stop-loss line can also be moved, this will recalculate the entry volume and the take-profit position.
FREE
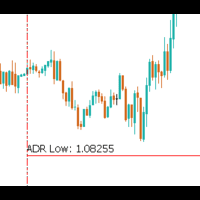
The Average Daily Range (ADR) is a powerful tool for traders, especially those focused on intraday and scalping strategies. It provides valuable insights into the expected price movement for the day and how price action is behaving relative to historical trends. The ADR indicator shows the following key information: Today's ADR : The typical range of price movement for the current trading day, based on historical data. 3x Today's ADR : Three times the current ADR, showing potential price moveme
FREE
Unlock Precision Trading: The ATR Dynamic Pivot System Download this free ATR Pivot Signals indicator and instantly gain an edge against market noise. This is the ultimate tool for traders who demand high-conviction entry points based on genuine market swing reversals, not guesswork. The ATR Pivot Signals system is an innovative technical indicator that utilizes the Average True Range (ATR) to dynamically filter volatility, ensuring that a signal is triggered only when a price move is
FREE
SizeInPips Indicator – Visualize Candle Size with Ease!
Unlock the power of price action analysis with the SizeInPips Indicator ! This simple yet powerful tool is designed for traders who want to quickly measure and visualize the size of each candle (bar) in pips, helping you make informed trading decisions with confidence. Whether you're a beginner or an experienced trader, SizeInPips is the perfect addition to your MetaTrader 5 toolkit.
What Does It Do? The SizeInPips Indicator calculates
FREE
TripleWave Signal Indicator - 複数時間軸トレンド確認システム もう二度と高確率のトレードを見逃すことはありません! TripleWave Signal Indicator は、3つの時間軸(M15、H1、H4)を同時に分析し、最も信頼性の高い BUY および SELL シグナルのみを提供するプロフェッショナルグレードのシステムです。 推奨設定: XAUUSD: 現時点ではデフォルト設定で問題ありません。 得られるもの: 複数時間軸トレンド分析エンジン。 チャート上の BUY/SELL/EXIT 視覚的矢印。 リアルタイムステータスダッシュボード。 ポップアップおよび モバイルプッシュ通知 。 完全にカスタマイズ可能なパラメーター(EMA期間、色など)。 一度の購入で、 生涯無料アップデート 。 今すぐ TripleWave Signal Indicator をダウンロードし、偽のシグナルを追いかけるのをやめましょう。自信を持って、より賢く取引を始めましょう。
FREE
MetaTraderマーケットはMetaTraderプラットフォームのためのアプリを購入するための便利で安全な場所を提供します。エキスパートアドバイザーとインディケータをストラテジーテスターの中でテストするためにターミナルから無料のデモバージョンをダウンロードしてください。
パフォーマンスをモニターするためにいろいろなモードでアプリをテストし、MQL5.community支払いシステムを使ってお望みのプロダクトの支払いをしてください。
取引の機会を逃しています。
- 無料取引アプリ
- 8千を超えるシグナルをコピー
- 金融ニュースで金融マーケットを探索
新規登録
ログイン