Technische Indikatoren für den MetaTrader 5 - 20

Eagle Spikes Detector v1.50 - Professionelles Handelssignalsystem Ultimativer Präzisionshandel mit fortschrittlicher SuperTrend-Filtertechnologie Treten Sie meinem Telegramm-Kanal bei, um mit mir zu handeln: https: //t.me/+9HHY4pBOlBBlMzc8
Der Eagle Spikes Detector ist ein hochentwickelter, professioneller Handelsindikator, der für ernsthafte Trader entwickelt wurde, die Präzision, Zuverlässigkeit und visuelle Exzellenz verlangen. Durch die Kombination von fortschrittlicher Multi-Timeframe-
FREE
Übersicht
Supply & Demand (MTF) v1.00 ist ein MetaTrader 5-Indikator, der automatisch wichtige Angebots- und Nachfragezonen aus bis zu drei Zeitrahmen auf Ihrem aktuellen Chart identifiziert und einzeichnet. Angebotszonen markieren Bereiche, in denen starker Verkaufsdruck herrschte; Nachfragezonen markieren Bereiche, in denen starker Kaufdruck herrschte. Merkmale Multi-Timeframe-Erkennung
Scannen Sie das aktuelle Diagramm sowie zwei höhere Zeitrahmen nach Zonen. Kerzenstärke-Filter
Erfordert
FREE
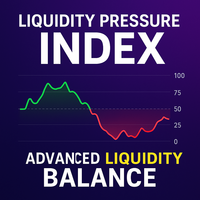
Der Liquidity Pressure Index (LPI) ist ein fortschrittlicher technischer Indikator, der den verborgenen Kampf zwischen Käufern und Verkäufern auf dem Markt aufdeckt. Im Gegensatz zu herkömmlichen Oszillatoren, die sich nur auf Kursbewegungen stützen, integriert der LPI die Markttiefe (Orderbuchdaten), die ATR-basierte Volatilitätskompression und die adaptive Glättung, um Händlern einen tieferen Einblick in die wahre Liquiditätsdynamik zu geben.
Durch die Kombination von Kursbewegungen mit Volu
FREE

Real Trend Zigzag PRO zeigt im Gegensatz zum Standard-Zigzag-Indikator den tatsächlichen Trend eines Marktes an. Er berechnet den Trend in Echtzeit und zeigt grüne Linien für Aufwärtstrends, rote Linien für Abwärtstrends und blaue Linien für keine Trends. Gemäß dem alten Slogan "the trend is your friend" hilft er Ihnen zu entscheiden, ob Sie eine Kauf- oder Verkaufsposition eröffnen sollten. Die PRO-Version ist ein Multi-Zeitrahmen-Zickzack (MTF). Das heißt, es wird sowohl der Trend des aktuell
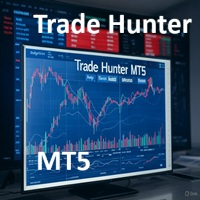
Trade Hunter MT5 - Kauf- und Verkaufsindikator
Erschließen Sie sich präzise Handelsmöglichkeiten mit Trade Hunter MT5! Dieser leistungsstarke Indikator identifiziert potenzielle Kauf- und Verkaufssignale durch die Analyse von Kursbewegungen über einen anpassbaren Zeitraum. Blaue Pfeile markieren Kaufgelegenheiten unter wichtigen Tiefstständen, während rote Pfeile Verkaufssignale über kritischen Höchstständen hervorheben. Mit einstellbaren Parametern wie Balkenbereich, prozentualem Offset und
FREE
Volumatic Fair Value Gaps ist ein präzisionsgefertigter Indikator zur Identifizierung, Analyse und Visualisierung von Fair Value Gaps (FVGs) , unterstützt durch Volumenintelligenz. Dieses Tool geht über die standardmäßige FVG-Darstellung hinaus, indem es die Volumendynamik innerhalb jeder Lücke mit Hilfe von Stichproben im unteren Zeitrahmen analysiert und so einen klaren Einblick gibt, ob Bullen oder Bären das Ungleichgewicht dominieren. Dieser für technische Händler konzipierte Indikator überl

Ein nützliches Dashboard, das die RSI-Werte für mehrere Symbole und Zeitrahmen anzeigt. Es kann mit einem einfachen Klick auf das X oben links im Dashboard ein- und ausgeblendet werden. Sie können obere und untere RSI-Werte eingeben, und die Farben können so eingestellt werden, dass sie angezeigt werden, wenn sie über oder unter diesen Werten liegen. Die Standardwerte sind 70 und 30. Sie können wählen, ob das Dashboard auf der rechten oder linken Seite des Diagramms angezeigt werden soll. Wenn
FREE

SCALPFLASH-X
Wo Fibonacci-Präzision auf RSI-Intelligenz trifft.
Ein Handelssystem der nächsten Generation, das Adaptive Fibonacci Pivots, RSI Heat Mapping und Smart Candle Analytics kombiniert. Erkennen Sie Marktdominanz, Momentumverschiebungen und Umkehrzonen in Echtzeit über mehrere Zeitrahmen hinweg. Institutionelle Genauigkeit, Einfachheit für den Einzelhandel - entwickelt für Geschwindigkeit, Klarheit und Präzision.
Hochentwickeltes Multi-Timeframe Fibonacci- & RSI-gesteuertes Market Inte

Erklärungen zum Candle Time Indicator Der Candle Time Indicator für MetaTrader 5, zeigt Benutzern die Restzeit bis der neue Bar gezeichnet wird. Candle Time Indicator settings. TextColor: die Farbe des Textes; FontSize: die Größe des Textes; Installationsanweisungen Kopiere CandleTime.ex5 indicator in den Ordner MQL5 der Metatrader 5 Plattform. You can gain access to this folder by clicking the top menu options, that goes as follows: Datei> Dateiordner öffnen > MQL5 > Indicators(hier einfügen).
FREE

Fibo-Trend-Smart MAXIMUS Ritz Fibo Trend Smart MAXIMUS 1 ist ein fortschrittlicher Handelsindikator, der verschiedene technische Analysewerkzeuge in einer umfassenden Anzeige integriert. Dieser Indikator wurde entwickelt, um Händlern zu helfen, Handelsgelegenheiten mit hoher Genauigkeit zu identifizieren, indem er eine Kombination aus Fibonacci-, ZigZag- und Preisaktionsbestätigung verwendet. Hauptmerkmale Intelligente Fibonacci-Retracement 11 anpassbare Fibonacci-Levels (0%, 23,6%, 38,2%, 50%,
FREE
Volumisierte Breaker-Blöcke MTF Supreme Volumized Breaker Blocks MTF Supreme ist ein leistungsstarker und benutzerfreundlicher Multi-Timeframe (MTF) Indikator, der automatisch Order Blocks (OB) und Breaker Blocks (BB) in Ihrem Chart erkennt und visualisiert. Dieses fortschrittliche Tool wurde sowohl für Anfänger als auch für professionelle Händler entwickelt, die einen sauberen, schnellen und aufschlussreichen Weg suchen, um wichtige Marktniveaus mit Volumen-Kontext zu identifizieren. Hauptmerk
FREE

Der Indikator Pure Price Action ICT Tools wurde für die reine Preisaktionsanalyse entwickelt und identifiziert automatisch Echtzeit-Marktstrukturen, Liquiditätsniveaus, Order- und Breaker-Blöcke sowie Liquiditätslücken. Seine Einzigartigkeit liegt darin, dass er sich ausschließlich auf Preismuster stützt, ohne durch benutzerdefinierte Eingaben eingeschränkt zu sein, was eine robuste und objektive Analyse der Marktdynamik gewährleistet. Wichtigste Merkmale Markt-Strukturen Eine Marktstrukturversc

STAUAUSBRUCH PRO
Dieser Indikator scannt den Ausbruch von Stauzonen. Dieser Indikator unterscheidet sich von allen anderen Stau-Indikatoren, die Sie derzeit auf dem Markt finden. Er verwendet einen fortschrittlichen Algorithmus, der den meisten traditionellen Stau-Indikatoren, die heute verfügbar sind, nicht eigen ist. Der fortschrittliche Algorithmus, der zur Definition der Staus verwendet wird, ist in hohem Maße für die hohe Rate echter Stauzonen und die niedrige Rate falscher Stauzonen vera

Hochgradig konfigurierbarer Trader Dynamic Index (TDI) Indikator.
Merkmale: Hochgradig anpassbare Alarmfunktionen (bei Levels, Kreuzen, Richtungsänderungen per E-Mail, Push, Sound, Popup) Multi-Timeframe-Fähigkeit (auch höhere und niedrigere Timeframes) Farbanpassung (bei Levels, Kreuzen, Richtungsänderungen) Optionen für lineare Interpolation und Histogramm-Modus Funktioniert im Strategie-Tester im Multi-Timeframe-Modus (auch am Wochenende ohne Ticks) Einstellbare Levels Parameter:
TDI Timefr
FREE
Erschließen Sie den Präzisionshandel: Das ATR Dynamic Pivot System Laden Sie diesen kostenlosen Indikator für ATR-Pivot-Signale herunter und verschaffen Sie sich sofort einen Vorteil gegenüber dem Marktrauschen. Dies ist das ultimative Werkzeug für Händler, die auf der Grundlage echter Marktumschwünge - und nicht auf der Grundlage von Vermutungen - überzeugende Einstiegspunkte suchen. Das ATR Pivot Signals System ist ein innovativer technischer Indikator, der die Average True Range (ATR) nutzt,
FREE

Automatische Trendlinienanpassung. Dieser Indikator zeichnet automatisch die gerade Linie und den parabolischen (gekrümmten) Trend für jedes Symbol und jeden Zeitrahmen ein. Die gezeichnete gerade Linie ist ein guter Hinweis auf den aktuellen Trend und die gekrümmte Linie ist ein Hinweis auf eine Änderung der Dynamik oder eine Änderung des aktuellen Trends. Wird die gerade Linie über etwa 2/3 der Kerzenanzahl wie die gekrümmte Linie gezeichnet, ist dies in der Regel ein guter Weg, um Einstiegs-
FREE

Session Killzone-Indikator
Indikator, der Ihnen hilft, die Killzone-Zeiten der Londoner und New Yorker Sitzungen zu identifizieren, die in der Regel die Zeiten hoher Volatilität und des Liquiditätsentzugs auf dem Markt sind. Die Killzone-Zeiten sind über die Indikatorparameter konfigurierbar. Der Indikator passt den Bereich der Killzones auf der Grundlage der täglichen Handelsspanne an.
FREE

"Das Erkennen aufkommender Trends, das Bestimmen von Korrekturperioden und das Vorwegnehmen von Umschwüngen kann Ihrem Handel in vielerlei Hinsicht zugute kommen..." So soll es sein: Higher Highs & Lower Lows Indikator. Dieser Indikator wurde von Vitali Apirine entwickelt und der Öffentlichkeit in dem Artikel "Time To Buy. Time to Sell - It's a Stochastic, Higher Highs & Lower Lows" in der Zeitschrift Stocks & Commodities vorgestellt. Dies ist ein Momentum-Indikator, der hilft, die Richtung eine
FREE

Ein sehr einfacher Indikator, der jedoch bei der Durchführung Ihrer Operationen nicht fehlen darf.
Schnelle und genaue Spreed-Informationen vor dem Einstieg in einen Handel sowie der Zeitpunkt für den Start einer weiteren Kerze.
Als Spread bezeichnet man die Differenz zwischen dem Kauf- und dem Verkaufspreis einer Aktie, einer Anleihe oder einer Währung.
Sehen Sie sich auch unsere mql5 Signale an. https://www.mql5.com/pt/signals/899841?source=Site+Signale+Vom+Autor
FREE

Technische Beschreibung Daily Trend Lines Pro ist ein fortschrittlicher Indikator, der in MQL5 entwickelt wurde, um genaue Einblicke in die täglichen Bewegungen des Marktes zu geben. Basierend auf dem gleitenden Durchschnitt, der aus der ersten Kerze eines jeden Tages berechnet wird, zeichnet der Indikator eine tägliche Trendlinie, die zu Beginn eines jeden neuen Tages zurückgesetzt wird, um visuelle Klarheit zu gewährleisten und die Handelssitzungen klar abzugrenzen. Hauptmerkmale: Dynamische u
FREE
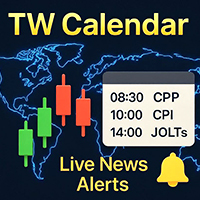
Dieser Nachrichtenassistent wurde entwickelt, um die von Händlern benötigten wirtschaftlichen Ereignisse aus den wichtigsten Veröffentlichungsquellen abzurufen, die Nachrichten in Echtzeit basierend auf der Market Watch des Terminals mit verschiedenen und einfachen Filtern veröffentlichen.
Forex-Händler nutzen makroökonomische Indikatoren, um fundierte Entscheidungen über den Kauf und Verkauf von Währungen zu treffen. Wenn ein Händler beispielsweise glaubt, dass die US-Wirtschaft schneller wac
FREE

Moving Average Convergence/Divergence ist ein von Gerald Appel entwickelter technischer Indikator, der in der technischen Analyse verwendet wird, um die Stärke und Richtung des Trends zu überprüfen sowie Umkehrpunkte zu identifizieren. Der im MetaTrader 5 eingebaute MACD-Indikator entspricht nicht der Idee des Autors (Gerald Appel):
- die MACD-Linie wird grafisch als Histogramm dargestellt, aber das Histogramm spiegelt die Differenz zwischen der MACD-Linie und der Signallinie wider;
- die Signa
FREE

Bitte überprüfen Sie regelmäßig die Registerkarte "What's new " für eine vollständige und aktuelle Liste aller Verbesserungen + Parameter. KOSTENLOSER Indikator für mein Handelsprogramm Take a Break . Dieser Indikator ermöglicht es Ihnen, mehrere andere EAs mit nur einer Take a Break EA-Instanz zu verwalten. Geben Sie einfach die entsprechende Chart Group in den Indikator(en) und den Take a Break EA-Einstellungen an und schon kann es losgehen.
Setup-Beispiele (Indikator + EA)
Als Voraussetzung
FREE

Der „HiperCube USD INDEX (DXY /USDX) “ ist ein Finanzbenchmark, der die Performance einer bestimmten Gruppe von Vermögenswerten wie Aktien, Anleihen oder Rohstoffen mit in US-Dollar denominierten Werten darstellt. Diese Indizes helfen Anlegern, die Performance bestimmter Sektoren oder Märkte im Laufe der Zeit zu verfolgen und zu vergleichen. Da der Index in USD ausgedrückt wird, bietet er ein konsistentes Maß für die Bewertung von Investitionen, unabhängig von der Landeswährung oder dem geograf
FREE
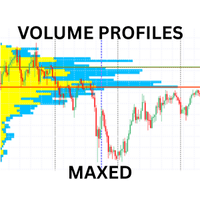
Erweiterter Volumenprofil-Indikator für MT5
Verändern Sie Ihren Handel mit professioneller Volumenanalyse. Dieser umfassende Volumenprofil-Indikator liefert Ihnen mit mehreren Profiltypen, einem fortschrittlichen Warnsystem und anpassbaren Anzeigeoptionen Markteinblicke in institutioneller Qualität. SCHLÜSSEL-EIGENSCHAFTEN Mehrere Profiltypen Sichtbares Bereichsprofil: Analysiert das Volumen innerhalb des aktuellen Chartfensters Festes Bereichsprofil: Benutzerdefinierte Datumsbereichsanalys

Der Indikator synchronisiert acht Arten von Markierungen auf mehreren Charts eines Handelsinstruments.
Dieser Indikator kann bequem in Verbindung mit "Multichart Dashboard" oder einem ähnlichen Assistenten verwendet werden, mit dem Sie gleichzeitig mit mehreren Charts arbeiten können.
"Multichart Dashboard" finden Sie unter dem Link auf meinem Youtube-Kanal.
Die Einstellungen:
Aktivieren die vertikale Liniensynchronisation
Aktivieren die horizontale Liniensynchronisation
Aktivieren die Trendlin
FREE
Überblick Der OBV Oscillator ist ein benutzerdefinierter technischer Indikator für MetaTrader 5, der eine klarere Visualisierung des On Balance Volume (OBV) bietet, indem er es in einen Oszillator umwandelt. Dieser Indikator soll Händler bei der Identifizierung von Trendbestätigungen, potenziellen Umkehrungen und Momentum-Verschiebungen unterstützen, indem er die Beziehung zwischen Preis und Volumen analysiert. Er verfügt über einen anpassbaren gleitenden Durchschnitt (MA) zur Glättung des OBV,
FREE
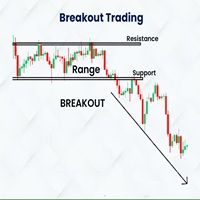
Der Indikator basiert auf der London Range Breakout Strategie von Amaury Benedetti.
Dieser Indikator zeichnet automatisch die Spanne, das Maximum und Minimum sowie die entsprechenden Stoploss-, Entry- und Takeprofit-Linien.
ES WIRD EMPFOHLEN, IHN IN M1 AUF DEM US30 ZU VERWENDEN (ENTSPRECHEND DER STRATEGIE).
Die Werte können je nach Bedarf des Benutzers geändert werden, außerdem haben Sie mehrere Konfigurationen, um jede beliebige Spanne in verschiedenen Zeitrahmen und mit verschiedenen Einste
FREE
Dieser Indikator ist ein technisches Hilfsmittel, das auf harmonischen Annäherungen der Sonnen- und Mondzyklen beruht . Er verwendet keine exakten astronomischen Positionen. Dieser Indikator verwendet mathematische Wellen, um die täglichen Sonnen- und monatlichen Mondzyklen für Handelszwecke zu approximieren . Er erfasst allgemeine Marktrhythmen, die von Tag/Nacht- und Mondphasen beeinflusst werden, aber er verfolgt keine exakten astronomischen Positionen . Führen Sie vor dem Kauf eine Analyse

Dynamische CMF-Berechnung: Passen Sie den Zeitraum für den Chaikin Money Flow (CMF) an, um Ihre Analyse zu verfeinern und die Signalgenauigkeit zu maximieren. Intuitive farbkodierte Warnungen: Interpretieren Sie die Marktbedingungen sofort mit klaren visuellen Hinweisen: Grüner Alarm: Zeigt die überkaufte Zone an - ein Hinweis auf eine potenzielle Verkaufsmöglichkeit. Roter Alarm: Zeigt die überverkaufte Zone an - was auf eine potenzielle Kaufgelegenheit hindeutet. Grauer Alarm: Zeigt den neutra
FREE
Der The Puls ist ein Indikator, der die Akkumulationszeit in Echtzeit anzeigt. In einfachen Worten: Akkumulation ist, wenn "intelligentes Geld" einen Vermögenswert leise sammelt, bevor er eine starke Bewegung auf dem Markt einleitet. Auf dem Chart sieht es so aus, als würde der Preis in einem Bereich "stecken" bleiben. Dies ist die Akkumulationsphase — jemand bereitet sich auf den großen Umzug vor. Und wenn du lernst, diese Momente zu bemerken — wenn der Markt "friert" ein, aber die Spannung sp

Smart Money Concepts Indikator - Professionelles ICT/SMC Handelssystem Transformieren Sie Ihr Trading mit der institutionellen Smart-Money-Analyse Nutzen Sie die Leistungsfähigkeit der Methoden von Smart Money Concepts (SMC) und Inner Circle Trader (ICT) mit diesem fortschrittlichen Indikator, der hochwahrscheinliche Einstiegszonen identifiziert und intelligente Take-Profit-Ziele am nächsten Point of Interest (POI) setzt. Hören Sie auf zu raten, wo Sie Ihre Trades beenden sollten - lassen Sie si
FREE
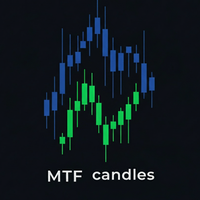
Der MTF-Indikator (Multi-Timeframe) Candles ist ein leistungsstarkes Tool, mit dem Sie Kerzen eines höheren Zeitrahmens (z.B. H1, H4, D1) direkt auf einem Chart mit niedrigerem Zeitrahmen (z.B. M5, M15, M30) anzeigen können. Das Problem, das gelöst wird: Anstatt ständig zwischen den Charts hin- und herzuwechseln, um den Haupttrend und die detaillierte Preisaktion zu analysieren, vereint dieser Indikator beide Perspektiven in einer. Sie können sofort das "große Ganze" sehen, während Sie sich auf
FREE
Support Resistance Catcher Indicator Merkmale und Erklärung
Überblick: Der Support Resistance Catcher ist ein benutzerdefinierter MT5-Indikator zur Identifizierung und Visualisierung von Angebots- (Widerstand) und Nachfragezonen (Unterstützung) auf der Grundlage von Candlestick-Kursbewegungen. Er erkennt Zonen, in denen sich der Kurs nach einer Rallye oder einem Rückgang umgedreht hat, indem er Dochtwiderstände und Clustering verwendet. Der Indikator zeichnet horizontale Rechtecke für aktive u
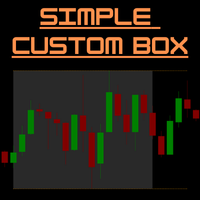
SimpleCustomBox – MT5 Sitzungsbox & Hoch/Tief Linien Indikator Überblick:
SimpleCustomBox ist ein leistungsstarker und benutzerfreundlicher Indikator für MetaTrader 5, mit dem du bestimmte Handelssitzungen auf deinem Chart visuell hervorheben kannst.
Definiere eigene Zeitbereiche, sieh sofort das Hoch und Tief der Sitzung und triff bessere Handelsentscheidungen dank klarer visueller Grenzen.
Ideal für Daytrader, Scalper und alle, die mit intraday Preisbewegungen arbeiten. Hauptfunktionen: Benut

Name des Indikators: CM EMA Trend-Balken Überblick: Der CM EMA Trend Bars Indikator ist ein einfaches, aber effektives Werkzeug, das die Farbe der Kursbalken auf der Grundlage ihrer Beziehung zum Exponential Moving Average (EMA) ändert. Dieser visuelle Hinweis hilft Händlern, die Trendrichtung und potenzielle Handelsmöglichkeiten schnell zu erkennen. Hauptmerkmale: Dynamische Balkenfärbung: Der Indikator ändert die Farbe der Balken, je nachdem, ob sie sich über oder unter dem EMA befinden, und b
FREE
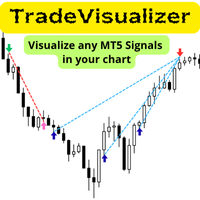
Der Trade Visualizer Indikator erweckt Ihre Handelsdaten zum Leben, indem er Ihre gesamte Handelshistorie direkt auf den MT5-Charts anzeigt. Egal ob Sie Ihre eigene Performance analysieren oder MQL5-Signalanbieter untersuchen – dieses Tool verwandelt Rohdaten in klare, intuitive Visualisierungen. Jeder Trade wird mit Ein- und Ausstiegspfeilen, Verbindungslinien und detaillierten Tooltips zu Preis, Gewinn, Volumen und Pips dargestellt. Hinweis: Wenn Sie diesen Indikator heruntergeladen haben, sen
FREE

Darstellung
Ein weiterer Indikator, der das Scalping auf Tick-Charts erleichtert. Er zeigt ein Heiken Ashi-Diagramm in Ticks an.
Er ermöglicht es, Einstiegspunkte und Trendumkehrungen zu erkennen. Empfohlene Anzahl von Ticks in einer Kerze: 5, 13 oder 21.
Parameter Ticks in der Kerze: Anzahl der Ticks in einer Kerze (Standardwert 5), Trendpfeile anzeigen: Zeigt einen Trendpfeil an, der auf der Kreuzung von EMA8 und EMA20 basiert, Zeigt MM50 an, Zeigt MM100 an, Max Candle (CPU): Anzahl der maxi
FREE

Infinity Prädiktor MA
Infinity Predictor MA ist ein Prognoseindikator der nächsten Generation, der den traditionellen gleitenden Durchschnitt in ein leistungsstarkes Prognoseinstrument verwandelt. Im Gegensatz zu Standard-MAs, die nur vergangene Daten glätten, projiziert dieser Indikator die gleitende Durchschnittslinie bis zu 40 Balken in die Zukunft und bietet Händlern damit eine einzigartige Perspektive auf die potenzielle Marktrichtung.
Die Engine hinter Infinity Predictor MA kombiniert m
FREE

Übersicht
Support & Resistance (MTF) ist ein MetaTrader 5-Indikator, der automatisch Swing-Hochs (Widerstand) und Swing-Tiefs (Unterstützung) über bis zu drei Zeitrahmen identifiziert. Er fasst nahegelegene Niveaus zusammen, um die Unübersichtlichkeit zu verringern, passt die Breite der Zone mithilfe von ATR an die Marktvolatilität an und bietet optionale Warnungen, wenn der Kurs diese Niveaus durchbricht oder erneut testet. Funktionen Multi-Timeframe-Pivot-Erkennung
Identifizieren Sie Pivots
FREE

FVG-Detektor Multi-TF ( OHNE FLICKER ). Automatischer Indikator zur Erkennung und Anzeige von Schlüsselpreisniveaus auf der Grundlage von Smart Money Concepts (SMC) . Der Indikator identifiziert Fair Value Price Gaps (FVG) und Swing High/Low gleichzeitig auf dem aktuellen Chart und in mehreren übergeordneten Zeitrahmen. Eigenschaften und Vorteile 1. Fortschrittliches Anti-Flackern Im Gegensatz zu Standardindikatoren, die bei Tick-Updates ein Flackern verursachen, ist hier eine optimierte Logik i
FREE
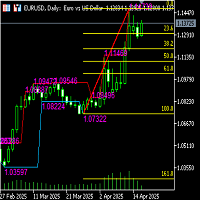
Funktionsbeschreibung des automatischen Fibonacci-Linien-Indikators (einschließlich hoher und niedriger Kanallinien) Name des Indikators Automatische Fibonacci-Retracement-Linie + Hoch- und Tief-Kanal-Hilfslinie
Funktionelle Einführung Dieser Indikator kombiniert die automatisch identifizierten Hoch- und Tiefpunkte des Bandes, zeichnet automatisch die Fibonacci-Retracement-/Extension-Linie und zeichnet die höchsten und niedrigsten Preiskanallinien des aktuellen Analyseintervalls, um Händlern e
FREE
Kostenlos bis 1. Januar 2026
VWAR 2.2 (Volume Weighted Average Roadmap) ist ein fortschrittlicher MT5-Indikator für institutionelle Anleger, der Ihnen die leistungsfähigste Multi-Zeitrahmen-VWAP-Analyse (Volume Weighted Average Price) sowie gefilterte Handelssignale mit robusten Trend- und Momentum-Bestätigungen bietet. Hauptmerkmale: Multi-Timeframe VWAP-Linien:
Tägliche, wöchentliche und monatliche VWAP-Linien für einen sofortigen Einblick in die Marktstruktur. Dynamische Kauf-/Verkaufssign
FREE

Wir müssen oft die plötzliche Trendänderung kennen, die in der Grafik auftritt, und dies kann durch Indikatoren bestätigt werden.
Dieser Indikator zeigt die Momente der Trendumkehr und wie sich der Preis in welchem Trend verschiebt.
Benutzerdefinierter Hintergrund, keine Notwendigkeit, die Farben im Diagramm zu konfigurieren, ziehen Sie einfach den Indikator!
Anzeige mit Pfeilen.
- Blauer Pfeil: Aufwärtstrend.
- Rosa Pfeil: Abwärtstrend.
HINWEIS: Kostenlose Anzeige, es kann eine Weile d
FREE

Overlay-Indikator auf dem Chart zwischen 2 Paaren
Der Timeframe-Overlay-Indikator zeigt die Kursbewegungen verschiedener Zeitrahmen auf einem einzigen Chart an, so dass Sie verschiedene Zeitrahmen auf einem einzigen Chart schnell beurteilen können. Der Vorteil ist, dass Sie die Korrelationen der Kursbewegungen in Echtzeit beobachten und verfolgen können, um auf einen Blick potenzielle Trades zu finden.
---- Symbol 1 ----
Symbol = EURUSD
Korrelation invers = falsch
Anzeige = wahr
Verhältnis
FREE
Multitimeframe-Betrachter HiddenEdge - HTF Echtzeit MiniChart Ein klarer Blick auf die Struktur höherer Zeitrahmen - direkt in Ihrem Hauptchart.
Sie müssen nicht mehr zwischen den Zeitfenstern wechseln. Der HiddenEdge Multitimeframe Viewer zeigt die letzten Kerzen eines beliebigen höheren Zeitrahmens in einem kompakten Echtzeit-Panel an - so können Sie das Gesamtbild sehen und sich gleichzeitig auf die Ausführung konzentrieren. Hauptmerkmale Echtzeit-Aktualisierung: Die aktuelle Kerze des höhe
FREE
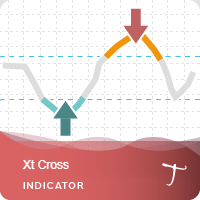
Xt Cross ist ein Port eines berühmten TS/MT-Indikators.
Wenn der Oszillator oberhalb des überkauften Bereichs (rote Linien) liegt und das Signal (gepunktete Linie) nach unten kreuzt, ist dies in der Regel ein gutes VERKAUFSSIGNAL. Ähnlich verhält es sich, wenn der Oszillator oberhalb des Signals kreuzt, wenn er unterhalb des überverkauften Bereichs (grüne Linien) liegt, ist dies ein gutes KAUFEN-Signal.
Xt Cross Vorteile Der Indikator ist für Scalping und Intraday-Handel geeignet. Es ist mögl
FREE

Der Hauptzweck des Indikators ist die Ermittlung und Markierung von Handelssignalen auf dem Histogramm des Accelerator Oscillators, die von Bill Williams in seinem Buch "New Trading Dimensions" beschrieben wurden. Die Liste der Signale: Das Kaufsignal, wenn das Histogramm des Indikators unter der Nulllinie liegt. Das Verkaufssignal, wenn das Histogramm des Indikators unter der Nulllinie liegt. Das Verkaufssignal, wenn das Histogramm des Indikators oberhalb der Nulllinie liegt. Das Kaufsignal, we
FREE

Gleitender Durchschnitt RAINBOW Forex-Händler verwenden gleitende Durchschnitte aus unterschiedlichen Gründen. Einige verwenden sie als primäres Analyseinstrument, während andere sie einfach als Vertrauensverstärker zur Untermauerung ihrer Investitionsentscheidungen nutzen. In diesem Abschnitt stellen wir Ihnen einige verschiedene Arten von Strategien vor - wie Sie sie in Ihren Handelsstil integrieren, bleibt Ihnen überlassen! Eine Technik, die in der technischen Analyse verwendet wird, um wechs
FREE
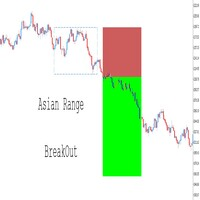
Vollständig anpassbar – Passen Sie den Indikator an Ihren persönlichen Handelsstil an, indem Sie Parameter wie Zeitrahmen, Farben, Linienstile und Risiko-Rendite-Einstellungen ändern. Visualisierung der Handelsniveaus – Zeichnet automatisch den Einstiegspreis, den Stop-Loss (SL) und das Take-Profit (TP) Level basierend auf Breakout-Bedingungen. Nahtlose Integration mit Expert Advisors (EAs) – Übernehmen Sie die volle Kontrolle über Ihre automatisierten Strategien, indem Sie zusätzliche Bes
FREE

Großer Bulle Scalper Kurzbeschreibung Beherrschen Sie die Marktstruktur mit der Präzision des beliebten Großen Bullen-Skalierer Dieses Tool identifiziert automatisch wichtige Pivot-Hochs und -Tiefs und zeichnet einzigartige "angelnde" Trendlinien, die den Marktkontext dynamisch definieren. Es bestätigt visuell Strukturbrüche (BOS) und Charakterveränderungen (CHoCH) und befreit Ihre Analyse von allem Rätselraten.
Hauptmerkmale: Automatische Pivot-Erkennung Erkennt sofort signifikante Schwunghoc
FREE

Global Trading Sessions ist ein technischer Indikator für MetaTrader 5, der die Eröffnungszeiten der vier wichtigsten Finanzsitzungen ermittelt und markiert: Tokio, London, New York und Sydney . Der Indikator löst das Problem der unterschiedlichen Serverzeiten der Broker, indem er eine GMT-basierte Berechnungslogik verwendet. Durch die Synchronisierung mit der Global Mean Time (GMT) stellt der Indikator sicher, dass die Sitzungsgrenzen unabhängig von der lokalen Zeitzone der Brokerplattform gena
FREE
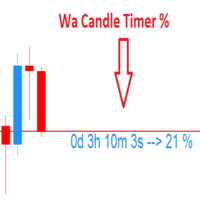
Wa Candle Timer Percentage MT5 ist ein Indikator, der dem Benutzer anzeigt, wie viel Zeit noch verbleibt, bis sich die nächste Kerze bilden wird. Der Prozentsatz der Entwicklung der aktuellen Kerze wird ebenfalls angezeigt. Der Benutzer kann den Prozentsatz einstellen, um den der Candle Timer die Farbe ändert. Dies sind die Einstellungen: 1- Der Prozentsatz, um den der Kerzen-Timer die Farbe ändert. 2- Farbe des Kerzentimers, wenn er UNTER dem vom Benutzer eingestellten Prozentsatz liegt. 3- Fa
FREE

MACD Support-Resistance Candle Analyzer - Professional Dieser Indikator erweitert den klassischen MACD, indem er die Momentum-Analyse mit der dynamischen Erkennung von Unterstützungen und Widerständen kombiniert und Händlern einen klareren Blick auf die Stärke von Ausbrüchen und die Marktstruktur ermöglicht. Er wandelt das Kursgeschehen in farbkodierte MACD-Kerzen um, hebt SnR-Break-Levels hervor und bietet eine klare visuelle Bestätigung der Trendfortsetzung oder -umkehr. Ideal für Scalper, Int
FREE
Der Multi-Frame MACD-Indikator ist ein robuster MetaTrader 5 (MT5) Indikator, der den Moving Average Convergence Divergence (MACD) nutzt, um Trends über mehrere Zeitrahmen hinweg zu analysieren. Dieser Indikator synchronisiert MACD-basierte Trendsignale aus bis zu neun Zeitrahmen (M1, M5, M15, M30, H1, H4, D1, W1, MN1) und präsentiert sie mit klaren visuellen Hinweisen, einschließlich einer farbigen MACD-Linie, Signalpfeilen und einem anpassbaren Dashboard. Perfekt für Händler, die Erkenntnisse
FREE
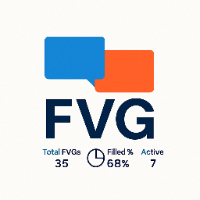
Der Smart FVG Statistics Indicator ist ein leistungsstarkes MetaTrader 5-Tool zur automatischen Identifizierung, Verfolgung und Analyse von Fair Value Gaps (FVGs) in Ihren Charts. Lieben Sie es? Hassen Sie es? Lassen Sie es mich in einer Bewertung wissen! Funktionswünsche und Ideen für neue Tools sind hochwillkommen :)
Testen Sie "The AUDCAD Trader" :
https://www.mql5.com/en/market/product/151841
Hauptmerkmale Erweiterte Fair Value Gap-Erkennung Automatische Erkennung : Sucht automatisch nach
FREE

Market Hours Pro zeigt die Handelssitzungen in Tokio, London und New York direkt auf Ihrem MT5-Chart an, einschließlich der geplanten Überschneidungszeiträume. Die Software bietet Ihnen einen klaren Überblick über das globale Markt-Timing, so dass Sie Trades planen, hochaktive Zeiträume erkennen und Ihre Strategien auf die Standard-Devisenhandelszeiten abstimmen können. Wie es funktioniert Zeigt die geplanten Sitzungszeiten visuell in Ihrem Chart an. Hebt Sitzungsüberschneidungen für London/New
FREE

MACD Pro - MACD-Indikator für MetaTrader 5 Beschreibung
MACD Pro ist ein Moving Average Convergence Divergence (MACD) Indikator für MetaTrader 5. Er folgt der Standard-MACD-Berechnungsmethode und zeigt Trendrichtung und Momentum in einem separaten Indikatorfenster an. Elemente des Indikators MACD-Linie, die auf der Differenz zwischen schnellen und langsamen exponentiellen gleitenden Durchschnitten basiert Signallinie, berechnet als exponentiell gleitender Durchschnitt der MACD-Linie Histogramm,
FREE

Pivot-Punkt Super-Trend Er kann verwendet werden, um Preisumkehrpunkte zu erfassen und kann Pfeile für Kauf und Verkauf anzeigen. Die Berechnungen basieren auf Preisspitzen. Sie können die Preisumkehrpunkte kontrollieren, indem Sie die Pivot-Punkt-Periode des Indikators erhöhen. der ATR-Faktor gibt an, wie weit die Bänder auseinander liegen sollen Kursausbrüche werden bereits im Frühstadium erkannt, was den Handel erheblich erleichtert.
FREE

Stochastic RSI führt eine stochastische Berechnung auf der Grundlage des RSI-Indikators durch. Der Relative Strength Index (RSI) ist ein bekannter Momentum-Oszillator, der die Geschwindigkeit und Veränderung von Kursbewegungen misst und von J. Welles Wilder entwickelt wurde.
Merkmale Finden Sie überkaufte und überverkaufte Situationen. Warnton, wenn das überkaufte/überverkaufte Niveau erreicht ist. Erhalten Sie E-Mail- und/oder Push-Benachrichtigungen, wenn ein Signal erkannt wird. Der Indikato
FREE

WaveTrendPro Arrow - Adaptives Quersignal mit intelligenten Warnungen Beschreibung WaveTrendPro Arrow ist ein übersichtlicher und leistungsfähiger visueller Indikator zur Erkennung von Trendumkehrpunkten unter Verwendung des klassischen WaveTrend-Oszillators (WT1/WT2-Kreuz) , erweitert um intelligente Pfeile auf dem Chart , Echtzeit-Warnungen und mobile Push-Benachrichtigungen . Im Gegensatz zu traditionellen WaveTrend-Indikatoren, die Signale in einem Unterfenster anzeigen, zeigt diese Ve
FREE
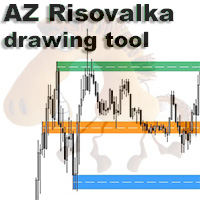
AZ Risovalka Werkzeug zum Zeichnen von Ebenen Ein Indikator zur Vereinfachung des Zeichnens von Niveaus. Wählen Sie in den Einstellungen den Indikatormodus für den Körper, den Schatten oder die ganze Kerze. Klicken Sie auf die Schaltfläche 'Zeichnen' auf dem Zeichenfeld, um eine Ebene zu erstellen, klicken Sie dann auf den Körper oder den Schatten der Kerze und wählen Sie die Farbe der Ebene im Farbmenü, das erscheint. Mit der Schaltfläche "Löschen" können Sie die gewählte Ebene löschen, mit "Fa
FREE

Der Indikator ist ein Analysetool, das 37 verschiedene Varianten gleitender Durchschnitte umfasst, die von Autoren wie Patrick Mulloy, Mark Jurik, Chris Satchwell, Alan Hull und anderen entwickelt wurden. Er ermöglicht historische virtuelle Tests. Der Indikator kann für verschiedene Instrumente verwendet werden, darunter Gold, Kryptowährungen, Aktienindizes, Währungspaare und andere Vermögenswerte. Ein integrierter visueller Backtester ermöglicht es Nutzern, virtuelle Handelspositionen zu simuli
FREE
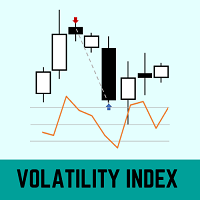
Dieser Indikator verwendet die historische Volatilität und einen gleitenden 21-Perioden-Durchschnitt, um die Preisverzerrung im Verhältnis zum Durchschnitt zu definieren.
Die Berechnung der historischen Volatilität basiert auf dem Buch (Odds: The Key to 90% Winners) von Don Fishback.
Ein Volatilitätsindex mit einem Wert von mehr als 30 kann darauf hinweisen, dass der Preis von seinem fairen Preis verzerrt ist.
FRAGEN ZUR INSTALLATION VON PRODUKTEN BEI META TRADER Unter diesen Links finden
FREE
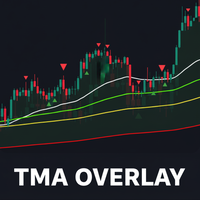
TMA-Overlay-Indikator für MT5 - Benutzerhandbuch 1. Einführung TMA Overlay ist ein vielseitiger Indikator für die technische Analyse auf der MetaTrader 5 Plattform. Das Ziel des Indikators ist es, Händlern einen umfassenden Überblick über den Trend, potenzielle Einstiegssignale und wichtige Handelssitzungen zu geben, die alle in einem einzigen Chart integriert sind. Es handelt sich nicht um ein Handelssystem, sondern um ein umfassendes Analysetool, das Ihnen helfen soll, fundiertere Entscheidung
FREE
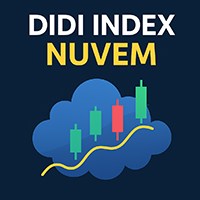
Entwickelt von smart2trader.com
Der Didi Index Nuvem Indicator ist ein Indikator, der auf dem Originalindikator Didi Aguiar (Didi Index) basiert und zwei Visualisierungsmethoden für die gleitenden Durchschnitte bietet: als Wolke oder als Linien (Original). Diese Anpassung bietet eine neue Möglichkeit, die gleitenden Durchschnitte im Didi Index Indikator zu visualisieren. Über den Didi-Index-Indikator Der Didi-Index-Indikator wurde vom brasilianischen Händler Didi Aguiar entwickelt und ist ein t
FREE

Einfacher Vwap mit dem täglichen, wöchentlichen und monatlichen
VWAP ist die Abkürzung für Volume-Weighted Average Price (volumengewichteter Durchschnittspreis ). Es handelt sich dabei um ein technisches Analyseinstrument, das das Verhältnis zwischen dem Preis eines Vermögenswerts und seinem gesamten Handelsvolumen anzeigt. Es bietet Händlern und Anlegern ein Maß für den Durchschnittspreis, zu dem eine Aktie in einem bestimmten Zeitraum gehandelt wird.
Wie es verwendet wird Ermittlung von Ein
FREE

Volumen zum Preis (VAP) VAP ist eine rechts verankerte Volume Profile Heatmap für MetaTrader 5, die für eine saubere, schnelle und stabile Ausführung auf jedem Chart entwickelt wurde. Sie zeigt an , wo sich die Handelsaktivitäten häufen, und nicht nur, wann. So können Sie Saldo/Gleichgewicht, Spot-Wert-Migration ablesen und Trades mit präzisen Referenzen planen: VAH, VAL, und POC . Was VAP zeigt Heatmap-Profil (Tick-Volumen):
Ein kompaktes, rechts verankertes Histogramm, das mit dem Diagramm s
Multi-Timeframe EMA Trend Detector Pro Fortgeschrittenes EMA-Trendanalyse-Tool mit Kreuzungserkennung und Trendstärkebestätigung über 5 Zeitrahmen. Der Multi-Timeframe EMA Trend Detector Pro ist ein umfassender Indikator, der für Händler entwickelt wurde, die sich auf trendbasierte Strategien verlassen. Er analysiert Exponential Moving Averages (EMAs) von 50, 100 und 200 über fünf wichtige Zeitrahmen (M15, M30, H1, H4 und Daily), um zuverlässige Trends, Trendumkehrungen und Konsolidierungsperio
FREE
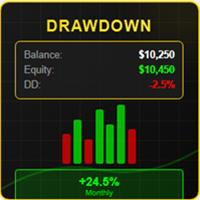
# DRAWDOWN INDICATOR V4.0 - Das wichtigste Werkzeug, um Ihr Trading zu meistern.
## Transformieren Sie Ihr Trading mit einem vollständigen Überblick über Ihre Performance in Echtzeit.
In der anspruchsvollen Welt des Forex- und CFD-Handels ist **Erkennen Ihrer Leistung in Echtzeit** kein Luxus, sondern eine absolute **Notwendigkeit**. Der **Drawdown Indicator V4.0** ist mehr als nur ein Indikator: Er ist Ihr **professionelles Dashboard**, das Ihnen einen klaren, präzisen und sofortigen Überbli
MetaTrader Market - der einzige Shop, in dem man Handelsroboter als Demoversion herunterladen und testen sowie anhand historischer Daten optimieren kann.
Lesen Sie die Beschreibung und Bewertungen anderer Kunden über das gewünschte Produkt, laden Sie es direkt ins Terminal herunter und erfahren Sie, wie man einen Handelsroboter vor dem Kauf testet. Nur bei uns können Sie ein Programm testen, ohne dafür zu bezahlen.
Sie verpassen Handelsmöglichkeiten:
- Freie Handelsapplikationen
- Über 8.000 Signale zum Kopieren
- Wirtschaftsnachrichten für die Lage an den Finanzmärkte
Registrierung
Einloggen
Wenn Sie kein Benutzerkonto haben, registrieren Sie sich
Erlauben Sie die Verwendung von Cookies, um sich auf der Website MQL5.com anzumelden.
Bitte aktivieren Sie die notwendige Einstellung in Ihrem Browser, da Sie sich sonst nicht einloggen können.