YouTube'dan Mağaza ile ilgili eğitici videoları izleyin
Bir alım-satım robotu veya gösterge nasıl satın alınır?
Uzman Danışmanınızı
sanal sunucuda çalıştırın
sanal sunucuda çalıştırın
Satın almadan önce göstergeyi/alım-satım robotunu test edin
Mağazada kazanç sağlamak ister misiniz?
Satış için bir ürün nasıl sunulur?
MetaTrader 5 için teknik göstergeler - 20
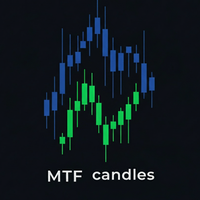
The MTF (Multi-Timeframe) Candles indicator is a powerful tool that allows you to display candles from a higher timeframe (e.g., H1, H4, D1) directly on a lower timeframe chart (e.g., M5, M15, M30). The Problem It Solves: Instead of constantly switching back and forth between charts to analyze the main trend and detailed price action, this indicator merges both perspectives into one. You can instantly see the "big picture" while staying focused on trading signals on your current timeframe. Core
FREE

Very simple, yet powerful, indicator that helps you get notified every time a candle touches your trend line, horizontal line, and/or your rectangular. Powerful indicator yet very simple to use! All you need to do is draw your MT5 trend lines, horizontal lines, and/or rectangles and SmartLine takes care of notifying you the moment the current price touches one of your key levels! No brainer If you like the indicator, please leave a review and share the tool with your peers. WARNING: Please use t
FREE
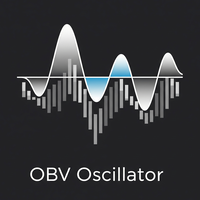
Overview The OBV Oscillator is a custom technical indicator for MetaTrader 5, designed to provide a clearer visualization of On Balance Volume (OBV) by transforming it into an oscillator. This indicator aims to assist traders in identifying trend confirmations, potential reversals, and momentum shifts by analyzing the relationship between price and volume. It features a customizable Moving Average (MA) for smoothing the OBV, a signal line for generating crossover signals, and an alert system to
FREE

The ChanLun or Chan theory is one of the most popular trading theories in China. But it seems like that it has little influence in western countries. Actually, the Chan Theory is based on a sophisticated mathematical model. The basic idea ChanLun is to simplify the bar chart by its model. With the help of ChanLun, a trader can analyze and predict the trend of future goods, stocks.
In ChanLun, there are several basic elements called fractals, strokes, line segments and pivots . A trader should pa

Boom and Crash Gold miner v2 Trading indicator based on market momentum works on m1 for boom and crash 1000 and M5 time frame for normal trading pairs wait for blue arrow to appear plus change of candle stick color and candlesticks must be above the 2 modified moving averages then you can buy the market. wait for orange arrow to appear plus change of candle stick color and candlesticks must be below the 2 modified moving averages then you can sell the market.
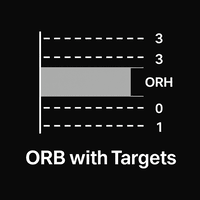
Opening Range Breakout Pro MT5: Stop Guessing, Start Trading the Open. Most traders spend the first 30 minutes of the market open sweating over their keyboards, wondering which way the wind is blowing. Opening Range Breakout Pro does the heavy lifting for you, pinning down the Initial Balance like a pro wrestler so you can stop chasing candles and start hitting targets. Whether it is the London Open volatility or the New York chaos, this indicator draws the line in the sand. You just decide whi
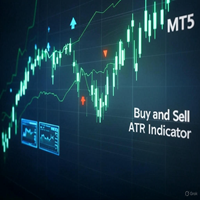
Buy and Sell ATR Indicator The Buy and Sell ATR Indicator is a powerful trend-following tool for MT5, combining ATR-based trend detection with RSI confirmation. It plots a dynamic trend line and generates clear buy (blue arrows) and sell (red arrows) signals when price action confirms a trend over a user-defined number of candles. A unique flat market filter, based on average ATR, prevents signals in low-volatility conditions. Customize ATR periods, RSI levels, signal thresholds, and arrow styl
FREE

Free forever simple pip meter for MT5 with customizable font color. Display profit or loss in both points count and currency value. Supports 4 currency symbols ($,€,£ ,¥). For unsupported currencies, it shows a 3-character currency short form. Enhance your trading interface with clarity and precision. Easy to use and tailored for diverse Forex traders. Perfect for MT5!
FREE
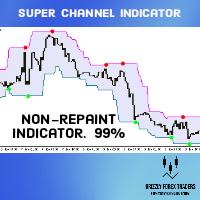
Super Signals Channel Indicator Its channel is a non-repaint indicator that reacts more with recent price movements. For this reason, the Super Signals Channel Indicator is a better match for short-term or day trading strategy. The Super Signals Channel only plots swing trading opportunities. So most of its trade signals appear during consolidation or sidelined periods of the market. Super Signals Channel Indicator for MT5 Explanation The green band below the price shows the dynamic support lev

Birçok stratejide, bir stop-loss tanımlamaya yardımcı olması için ölçeklendirilmiş bir ATR kullanmak oldukça yaygındır ve onu kar alma hedefleri için kullanmak da nadir değildir. Yerleşik ATR göstergesini kullanmak ve ofset değerini manuel olarak hesaplamak mümkün olsa da, özellikle sezgisel veya verimli değildir ve yanlış hesaplama potansiyeline sahiptir.
Özellikler Yapılandırılabilir ATR ofseti Üst ve Alt Bant. yapılandırılabilir ATR ölçeklendirme faktörü alternatif (grafik dışı) ATR zaman a
FREE

The Chandelier Exit Indicator for MT5 is a powerful tool designed to help traders manage trades by dynamically adjusting stop-loss levels based on market volatility. It is based on the Average True Range (ATR) and follows the trend, placing stop-loss levels above or below price action, depending on the trend direction. This makes it an effective tool for trend-following strategies, breakout trading, and risk management .
Key Features: • Dynamic Stop-Loss Placement – Adjusts stop-
FREE

Overlay indicator on chart between 2 pairs
The Timeframe Overlay indicator displays the price action of timeframes on a single chart, allowing you to quickly assess different timeframes from a single chart. The advantage is to observe and follow the correlations of price movements in real time to help you find potential trades at a glance.
---- Symbol 1 ----
Symbol = EURUSD
Correlation Inverse = false
Display = true
Ratio
FREE

Fibomathe Indicator: Support and Resistance Tool for MT5 The Fibomathe Indicator is a technical analysis tool designed for MetaTrader 5 (MT5) that assists traders in identifying support and resistance levels, take-profit zones, and additional price projection areas. It is suitable for traders who use structured approaches to analyze price action and manage trades. Key Features Support and Resistance Levels:
Allows users to define and adjust support and resistance levels directly on the chart.
FREE

This indicator displays buy or sell signals according to Bill Williams' definition of the Trading Zone. [ Installation Guide | Update Guide | Troubleshooting | FAQ | All Products ] Easy to use and understand Avoid trading flat markets Deterministic indicator with clear rules The indicator is non-repainting It implements alerts of all kinds It has straightforward trading implications. A blue arrow is a buy signal A red arrow is a sell signal According to Bill Williams trading in the zone helps t
FREE

Demand and supply zones Support and Resistance areas Show broken zones Show tested and untested zones Show weak zones Fractal factors Notifications when price reaches point of Interest with Push notifications and pop ups Customizable History Clickable Works on all Timeframes Works on all pairs.
Free for a while till further notice and changes. The demand and supply bot coming soon
FREE
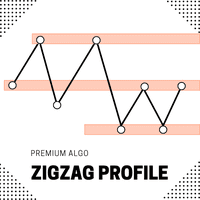
Introducing the ZigZag Profile — a powerful tool designed to identify high-probability pivot zones where price action frequently reverses. This indicator analyzes historical price data to pinpoint key areas where price has pivoted multiple times, providing traders with actionable insights into potential support and resistance levels. The ZigZal Profile indicator continuously scans for zones where price has reversed direction the most, highlighting these critical areas on your chart. By focusing
FREE
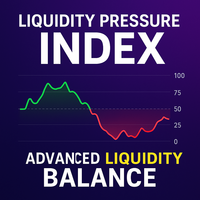
Liquidity Pressure Index (LPI) is an advanced technical indicator designed to uncover the hidden battle between buyers and sellers in the market. Unlike conventional oscillators that only rely on price movements, LPI integrates market depth (order book data), ATR-based volatility compression, and adaptive smoothing to give traders a deeper view of true liquidity dynamics.
By combining price action with volume absorption and order flow pressure, the LPI helps traders anticipate shifts in market
FREE

The "YK-LOT-SIZE" is a custom indicator for MetaTrader 5 (MT5) that displays the total lot sizes and profits for both buy and sell positions on the current chart. Key features of the indicator: It calculates the total lot sizes for all open buy and sell positions of the current symbol. It calculates the total profits (including commissions and swaps) for all open buy and sell positions. The indicator displays the information on the chart using two lines of text: "BUY Lots: [total buy lots] | BUY
FREE

This indicators automatically draws the support and resistances levels (key levels) for you once you've dropped it on a chart. It reduces the hustle of drawing and redrawing these levels every time you analyse prices on a chart. With it, all you have to do is drop it on a chart, adjust the settings to your liking and let the indicator do the rest.
But wait, it gets better; the indicator is absolutely free! For more information: https://youtu.be/rTxbPOBu3nY For more free stuff visit: https:
FREE
Other profitable programs https://www.mql5.com/en/users/ifyjava/seller FNCD göstergesi, istatistiksel fiyat normalizasyonu ile Fisher dönüşümünü birleştirerek gelişmiş bir osilatör oluşturan ileri düzey teknik analiz aracıdır. Temel, Z-skor normalizasyonu ile başlar; burada fiyat verileri, mevcut fiyatın belirli bir dönem boyunca hareketli ortalamasından kaç standart sapma uzakta olduğu hesaplanarak standartlaştırılır. Bu normalizasyon süreci, ham fiyat hareketlerini standartlaştırılmış biriml
FREE

HMA Color – Master Smoothed A clean, high-precision visual Hull Moving Average indicator with fully smoothed trend color display. Designed for professional scalpers and algorithmic traders who want a simple, fast, powerful trend view without noise. This indicator is built with a double smoothing system , making the Hull curve extremely soft and responsive.
When the trend is bullish, the HMA line automatically switches to Green and shows upward candles.
When the trend is bearish, the HMA line swi
FREE

Bu, dört seans boyunca tüm seviyeleri (Açık-Yüksek-Düşük-Kapanış) görüntüleyebilen işlem seanslarının bir göstergesidir. Gösterge aynı zamanda oturum düzeylerini de tahmin edebilir. Oturumlar çizgiler veya dikdörtgenler (boş veya dolu) ile çizilebilir, çizgiler bir sonraki oturuma uzatılabilir. Kısayol tuşlarına (varsayılan olarak '1', '2', '3', '4') basarak her oturumu kolayca gizleyebilir/gösterebilirsiniz.
ASR (Ortalama Oturum Aralığı) satırlarını görebilirsiniz (varsayılan kısayol tuşu '

BEHOLD!!!
One of the best Breakout Indicator of all time is here. Multi Breakout Pattern looks at the preceding candles and timeframes to help you recognize the breakouts in real time.
The In-built function of supply and demand can help you evaluate your take profits and Stop losses
SEE THE SCREENSHOTS TO WITNESS SOME OF THE BEST BREAKOUTS
INPUTS
MaxBarsback: The max bars to look back
Slow length 1: Period lookback
Slow length 2: Period lookback
Slow length 3: Period lookback
Slow leng
FREE
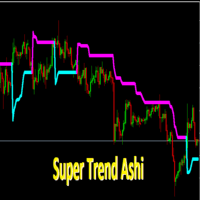
SuperTrendAshi Description SuperTrendAshi is an advanced and optimized version of the SuperTrend indicator that incorporates Heikin Ashi calculation to provide smoother and more reliable signals. This unique combination results in an indicator that reduces false signals and identifies trends with greater precision. Key Features Combines the strength of SuperTrend with Heikin Ashi smoothing More stable signals with less noise Intuitive color system (Aqua for uptrend, Magenta for downtrend) Custo
FREE

The indicator is an analytical tool incorporating 37 different variations of moving averages developed by authors such as Patrick Mulloy, Mark Jurik, Chris Satchwell, Alan Hull, and others. It provides the capability for historical virtual testing. The indicator can be used on various instruments, including gold, cryptocurrencies, stock indices, currency pairs, and other assets. An integrated visual backtester allows users to simulate virtual trading positions, track results, and visually assess
FREE
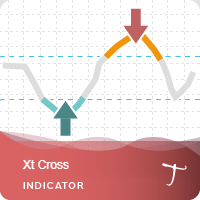
Xt Cross is a port of a famous TS /MT indicator.
When the oscillator is above the overbought band (red lines) and crosses down the signal (dotted line), it is usually a good SELL signal. Similarly, when the oscillator crosses above the signal when below the Oversold band (green lines), it is a good BUY signal.
Xt Cross Advantages The indicator is suitable for scalping and intraday trading. It is possible to evaluate the effectiveness of the indicator on history. The indicator does not
FREE
This is a powerful, session-aware breakout indicator designed for serious traders who thrive on volatility and structure. Engineered for precision, it identifies high-probability breakout zones during the London and New York trading sessions—where the market moves with intent. Key Features: Session Range Detection
Automatically detects and highlights the key price range of London and New York sessions. Breakout Confirmation
Identifies breakout candles after the session range, with clear bullis
FREE

Açıklama
Spread History, mum mum tarihine göre spread geçmişini ayrı bir pencerede ve hareketli ortalamasını gösteren basit ama vazgeçilmez bir indikatördür. Gerçek zamanlı çizgi ve ana grafikte üst üste bindirilmiş metin sayesinde, broker’in her piyasa aşamasında uyguladığı spread’i kolayca takip edebilirsiniz. Amaç Her muma ait broker tarafından sağlanan gerçek spread’i göstermek Yapılandırılabilir bir periyotta spread’in hareketli ortalamasını hesaplamak ve görüntülemek Grafik üzerinde günc
FREE

Gösterge, grafikte önemli teknik seviyeleri gösterir. Bu seviyeler, fiyat hareketi için destek veya direnç görevi görür.
En önemli seviyeler 100 ve 50 puanın katlarıdır. Seviyeleri 25 puanın katları olarak da görüntüleyebilirsiniz.
Fiyat seviyeye ulaştığında, bir uyarı veya push bildirimi görüntülenir.
MT4 sürümü https://www.mql5.com/tr/market/product/69486 Ayarlar Show Levels 100 pips - seviyeleri 100 pipin katları olarak göster Show Levels 50 pips - seviyeleri 50 pipin katları olarak göste
FREE

Major Swing Fibonacci Indicator - Professional Trading Tool What It Does Automatically detects major swing points not internal noise Generates buy/sell signals at key Fibonacci levels Displays professional GUI panel with real-time analysis Marks major swings with visual indicators Trading Strategy BUY at 38.2%-61.8% Fibonacci support in uptrends SELL Past performance is not indicative of future results. This indicator is for educational and informational purposes only and does not constitute in
FREE

AllTF Trend Bias Indicator is a professional tool to visualize market bias, designed mainly for 1-minute charts. The colors are not trading signals by themselves, but a visual compass to guide your decision-making: HiddenEdge release model
All HiddenEdge tools follow the same structured release plan.
Each indicator is released initially for free to collect feedback.
After reaching a stable user base, it moves to a fixed paid tier.
Some utilities remain permanently free as part of the Hidde
FREE
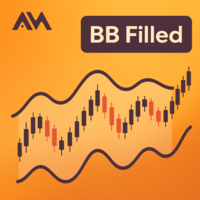
A clean Bollinger Bands indicator with single-color filling designed to reduce chart clutter. What is This Indicator? This is a Bollinger Bands technical indicator designed with visual simplicity in mind. Unlike standard Bollinger Bands implementations that display multiple colored lines and bands, this indicator uses a single-color filled area to represent the trading bands. This approach minimizes visual clutter while maintaining full functionality for technical analysis. How It Works The ind
FREE
The Round Level Indicator automatically draws psychologically significant price levels directly on your chart.
These round numbers often act as key support and resistance zones across all markets and timeframes.
Round Levels are used in my automated EA: Opal This indicator works best when combined with other tools and strategies, e.g.: Price Action Strategies
Round levels often align with key support/resistance. Use it with candlestick patterns (like pin bars or engulfing bars) to confirm high
FREE

Gold TL MTF - this is a fine stock technical indicator. The indicator algorithm analyzes the movement of the asset price and reflects trend lines along the fractals of a specific timeframe (TF).
Benefits of the indicator: The indicator produces signals with high accuracy. The confirmed signal of the indicator does not disappear and is not redrawn. You can trade on the MetaTrader 5 trading platform of any broker. You can trade any assets (currencies, metals, cryptocurrencies, stocks, indices e
FREE
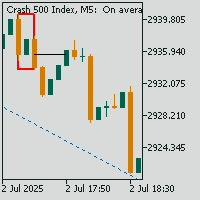
Crash Spike Mitigation Zone Pro
A professional spike pattern indicator built for synthetic traders who scalp and swing Crash 500/300/1000 with precision.
This indicator: Detects powerful 3-candle spike formations (Spike → Pullback → Spike) Automatically draws a clean box around the pattern Marks the entry price from the middle candle Extends a horizontal mitigation line to guide perfect sniper entries Automatically deletes & redraws the line once price touches it (mitigation)
FREE

SETTINGS Make sure to select Chart shift option in the chart.
(Right click in the chart ---> Properties (dialog box) ----> Select Chart Shift)
Kindly rate and comment about the product for upgradation & Support
When using candlestick timers, keep in mind that the timing of candlestick patterns can play a crucial role in your trading strategy. For instance, different timeframes (such as 1-minute, 5-minute, hourly, ) can provide varying insights into price movements and trends. Make sure to i
FREE

Market Hours Pro shows Tokyo, London, and New York trading sessions directly on your MT5 chart, including scheduled overlap periods. It’s designed to give you a clear view of global market timing so you can plan trades, spot high-activity periods, and align strategies with standard Forex hours. How It Works Displays scheduled session times visually on your chart. Highlights session overlaps for London/New York and Tokyo/London. Automatically adjusts times for your timezone or broker time. Shows
FREE

With this system you can spot high-probability trades in direction of strong trends. You can profit from stop hunt moves initiated by the smart money!
Important Information How you can maximize the potential of the scanner, please read here: www.mql5.com/en/blogs/post/718109 Please read also the blog about the usage of the indicator: Professional Trading With Strong Momentum.
With this system you have 3 reliable edges on your side: A strong trend (=high probability of continuation) A deep pull

FourAverage, trend tespitinde yeni bir kelimedir. Bilgi teknolojilerinin ve çok sayıda katılımcının gelişmesiyle birlikte, finansal piyasalar modası geçmiş göstergelerle giderek daha az analiz edilebilir hale geliyor. Hareketli Ortalama veya Stokastik gibi olağan teknik analiz araçları, en saf haliyle trendin yönlerini veya tersine dönmesini belirleyemez. Bir gösterge, parametrelerini değiştirmeden 14 yıllık bir geçmişe göre gelecekteki fiyatın doğru yönünü gösterebilir mi? Aynı zamanda, piyasan

Verve AI Reversal Pro Indicator Pro, mutlak hassasiyet ve eşsiz piyasa dinamikleri anlayışı talep eden trader’lar için nihai bir yardımcıdır. En son yapay zeka teknolojisini kullanarak, fiyat hareketlerini, hacmi ve volatiliteyi sürekli analiz eder ve yüksek olasılıklı dönüş noktalarını tam olarak oluşmadan önce tespit eder. İleri seviye makine öğrenimi algoritmalarını kanıtlanmış teknik analiz ilkeleriyle kusursuz bir şekilde harmanlayarak, Verve AI karmaşık verileri net ve güvenilir sinyaller

KT OBV Divergence, fiyat ile OBV (On Balance Volume) osilatörü arasında oluşan düzenli ve gizli uyumsuzlukları (divergence) gösterir.
Özellikler
Daha yüksek doğruluk ve daha sade grafik görünümü için simetrik olmayan uyumsuzluklar filtrelenir. Trend dönüşü ve trend devamı stratejilerini destekler. Expert Advisor’a tamamen entegre edilebilir şekilde uyumludur. Hem giriş hem çıkış sinyalleri için kullanılabilir. Tüm MetaTrader uyarı sistemleriyle uyumludur.
Divergence (uyumsuzluk) tam olarak ned

MACD ADVANCED - BRIEF DESCRIPTION INTRODUCTION MACD Advanced is an enhanced version of the traditional MACD indicator featuring an intelligent 4-color system that helps traders easily identify market trends and momentum. KEY FEATURES 1. Smart 4-Color System Bright Green (Lime) - Strong Bullish: MACD > 0 and MACD > Signal Light Green (DarkSeaGreen) - Weak Bullish: MACD > 0 but MACD < Signal ️ Bright Red (Red) - Strong Bearish: MACD < 0 and MACD < Signal Orange Red (OrangeRed)
FREE

KT Volume Profile, hacim birikim verilerini Y ekseninde bir histogram olarak göstererek, belirli zaman dilimleri ve fiyat seviyelerinde işlem yoğunluğunu analiz etmeyi sağlar.
Volume Profile'da Kontrol Noktası (POC)
POC, tüm profil boyunca en yüksek işlem hacminin gerçekleştiği fiyat seviyesini temsil eder. Genellikle destek/direnç seviyesi veya piyasanın yön değiştirmeden önce yeniden test ettiği önemli bir fiyat noktası olarak kullanılır.
Özellikler Kullanımı çok kolaydır. Grafik üzerinde di

Introducing Order Blocks Breaker , a brand-new way to identify and leverage order blocks in your trading strategy. After developing multiple order block tools with unique concepts, I’m proud to present this tool that takes things to the next level. Unlike previous tools, Order Blocks Breaker not only identifies order blocks but also highlights Breaker Order Blocks —key areas where the price is likely to retest after a breakout. MT4 - https://www.mql5.com/en/market/product/124101/ This t

Kârlı ticaret fırsatlarını kolaylıkla belirlemenize yardımcı olabilecek güçlü bir forex ticaret göstergesi mi arıyorsunuz? Beast Super Signal'den başka bir yere bakmayın. Bu kullanımı kolay trend tabanlı gösterge, sürekli olarak piyasa koşullarını izleyerek yeni gelişen trendleri araştırır veya mevcut trendlere atlar. Canavar Süper Sinyali, tüm dahili stratejiler birbiriyle uyumlu ve %100 örtüştüğünde bir al ya da sat sinyali vererek ek onay ihtiyacını ortadan kaldırır. Sinyal oku uyarısını aldı
Spike Detector Rider – Intelligent Trading in Volatile Markets Introduction
The Spike Detector Rider is an advanced system for MetaTrader 5 designed to detect explosive price movements in high-volatility assets such as synthetic indices and commodities.
It combines volatility filters, trend analysis, and automated risk management to provide intelligent trade confirmations. After purchase, please send me a private message via MQL5 to receive the installation manual and setup instructions. Asset

Weis Waves , David Weis tarafından geliştirilen ve Richard Wyckoff’un prensiplerinden esinlenen bir teknik göstergedir.
Geleneksel hacim göstergesinin bar bar gösterilmesinden farklı olarak, Weis Waves hacmi yükseliş veya düşüş “dalgaları” halinde biriktirir ve fiyat yönü değiştiğinde sayımı sıfırlar. Bu yöntem, traderların piyasa hareketlerinin gerçek gücünü net bir şekilde görmesini sağlar, çünkü her dalga bir dizi mum çubuğunu destekleyen hacim yoğunluğunu yansıtır. Temel özellikler: Hacmi
FREE

This indicator recognizes a special type of Inside Bar formation which is formed by a big Master candle followed by 4 smaller candles (please see the strategy explanation below). Features Plots buy/sell stop lines on the chart as well as well as take profit and stop loss levels. The TP/SL levels are based on the Average True Range (ATR) indicator. Object colors are changeable. Sends you a real-time alert when a Master candle formation is identified - sound / popup / email / push notification. On

Enjoy the Free Candle Color indicator.
Kijun Sen is an element of Ichimoku Kinko Hyo Indicator, it's far too complicated for many traders hence they tend to be confused. We have simplified it so the Kijun Sen will change colors as it activates without the Tenkan Sen, Senkou Span, Up Kumo and Down Kumo. Customize to your period parameter and colors of your choice. Great for beginners and seasoned traders. Set your period and enjoy
GOOD LUCK and ALL THE BEST IN YOUR TRADING JOURNEY !!!!!
FREE

Bu güçlü araç, trend çizgilerini otomatik olarak tanımlar, ticaret stratejinizi kolaylaştırmanıza ve daha bilinçli kararlar vermenize yardımcı olur. mt4 sürümü
Temel özellikler Otomatik Trend Hattı Algılama : "Temel Trendline" göstergesi, potansiyel trend çizgileri için pazarı tarar ve bunları anında gösteriyor.Bu size değerli zaman kazandırır ve asla önemli bir eğilimi kaçırmanızı sağlar. Kullanıcı dostu panel : Göstergemiz, çeşitli trend çizgileri kolayca çizmenizi sağlayan güzel, sezgisel

Price Sessions is an exclusive MetaTrader 5 indicator that integrates symbol information and trading sessions into your chart. It does not link to any account information or external sources, ensuring user safety. Main Features: 1. Symbol Information Current Symbol Live Price Live Spread 2. Trading Sessions (Time zone UTC/GMT+0) Tokyo session London session New York session If you find this utility helpful, please rate it. If you encounter any issues or have suggestions, pleas
FREE

Ignition Candle Guard is a visual indicator for MetaTrader 5 designed to identify candles with excessive movement relative to the ATR. The indicator highlights candles whose range (High–Low) exceeds a configurable ATR multiple, helping traders avoid late entries after overextended price movements. This indicator does not generate buy or sell signals , does not repaint , and does not execute automated trades .
It works as a visual risk filter and can be used with any strategy, asset, or timeframe
FREE

Easy Trend , as the name implies, is an indicator that easily shows the prevailing trend by bringing several indicators into one. The strategy is: when all indicators point in the same direction a signal is triggered. When red, is a signal to sell, when blue, signal to buy. It is that simple :) There are a total of 9 indicators: Moving Average, RSI, CCI, Parabolic SAR, William's Range, Stochastic, MACD, ADX and Heiken Ashi. It is possible to configure each of these indicators to suit your way of

Baloncuk Göstergesi — Fiyat Yavaşlaması + Hacim Sıçraması Fiyat aniden yavaşladığında ve aynı anda hacim yükseldiğinde grafikte renkli kareler gösteren basit bir görsel araç.
(Doldurma fonksiyonu ve konsantrik baloncuk efekti içerir)
Piyasanın hareket etmeye hazırlanacağı önemli anları tespit etmeye yardımcı olur. Göstergenin yaptığı şeyler: Piyasanın hareket etmeden önce “tereddüt ettiği” anları tespit eder Büyük hacim girişlerinin fiyatı çok fazla hareket ettirmediği noktaları gösterir Olası k

A simple price action indicator to highlight inside and outside bars (candles) with colors. It is possible to choose what type of bar can be highlighted among: inside, ouside or both. It is can be possible to choose a first specific color for the shadow and the border of bars (candles), a second specific color for high/bull bar (candle) and a third specific color for down/bear bar (candle)
FREE

Description This technical indicator is designed to automate the analysis of market structure based on price action concepts. It identifies and labels key structural points, including Higher Highs (HH), Lower Lows (LL), Lower Highs (LH), and Higher Lows (HL), to assist traders in visualizing market trends. The indicator uses a configurable "Swing Strength" logic, checking a user-defined number of bars to the left and right of a pivot to confirm its validity. It also identifies Break of Structure
FREE

I think you all know Donchian Channels. so I am not going to write about it.
With this indicator I tried to create Donchian Trend Ribbon by using Donchian Channels.
How it works ?
- it calculates main trend direction by using the length that is user-defined. so you can change it as you wish
- then it calculates trend direction for each 9 lower lengths. if you set the length = 20 then the lengths are 19, 18,...11
- and it checks if the trend directions that came from lower lengths is same
FREE

A pin bar pattern consists of one price bar, typically a candlestick price bar, which represents a sharp reversal and rejection of price. The pin bar reversal as it is sometimes called, is defined by a long tail, the tail is also referred to as a “shadow” or “wick”. The area between the open and close of the pin bar is called its “real body”, and pin bars generally have small real bodies in comparison to their long tails.
The tail of the pin bar shows the area of price that was rejected, and t
FREE
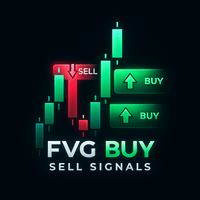
A Smart Price Imbalance Tool with Arrows, Labels, and FVG Zones The Fair Value Gap (FVG) Indicator is designed to automatically detect price imbalance zones on the chart – a widely used concept in Smart Money Concepts (SMC) and Institutional Trading Models (ICT) . These gaps, also known as imbalances or inefficiencies , often highlight areas where price may return to "rebalance" liquidity. Many professional traders consider these levels as high-probability zones for potential reversals, retrace

Megatron Shark Indicator – MT5 Harmonic Pattern Detection Tool The Megatron Shark Indicator is a MetaTrader 5 tool for detecting and displaying Shark harmonic patterns directly on the chart. It automatically identifies bullish and bearish Shark formations, calculates entry, stop-loss, and take-profit levels, and provides real-time alerts. This allows traders to quickly integrate harmonic pattern analysis into their trading process without manual drawing. Advantages * Automatic Pattern Detection
FREE

Eagle Spikes Detector v1.50 - Professional Trading Signal System Ultimate Precision Trading with Advanced SuperTrend Filtering Technology join my telegram channel to trade with me: https://t.me/ +9HHY4pBOlBBlMzc8
The Eagle Spikes Detector is a sophisticated, professional-grade trading indicator designed for serious traders who demand precision, reliability, and visual excellence. Combining advanced multi-timeframe analysis with cutting-edge SuperTrend filtering, this indicator identifi
FREE

MATADOR GOLD – XAUUSD MT5 M5 Timeframe Scalp Signals MATADOR GOLD is a professional signal indicator designed for XAUUSD (Gold) scalping on the M5 timeframe , with optional higher-timeframe confirmation. This indicator does not open or manage trades automatically .
It provides structured buy and sell signals, intelligent filtering, and alerts, allowing traders to execute trades using their own strategy and risk management rules. Core Concept (Multi-Concept Architecture) MATADOR GOLD is built

Check out my TRADE PLANNER MT5 – strongly recommended to anticipate account scenarios before risking any money. This is the Bill Williams Awesome Oscillator indicator calculated from Heikin Ashi candles. Here you find multi-colored histogram which is helpful when identify weakness or strength of trend in the market. To use it, just simply drop it on the chart and you don't need to change parameters except one: switch between Heikin Ashi or normal candles (see attached picture).
FREE

This is a buyer and seller aggression indicator that analyzes the shape of each candle and project this data in a histogram form. There are 4 histograms in one. On the front we have two: Upper - Buyer force. Lower - Seller force. At the background we also have two histogram, both with same color. They measure the combined strenght of buyers and sellers. This histograms can be turned off in Input Parameters. It is also possible to have the real or tick volume to help on this force measurement. IN
FREE

Piyasa Momentumunu Hassasiyetle Görselleştirin MultiMA_ICHIMOKU_STO_Color , üç güçlü göstergeyi tek bir akıllı sistemde birleştirerek net piyasa sinyalleri sağlamak için tasarlanmış kapsamlı bir teknik analiz aracıdır. Bu gösterge, üç özelleştirilebilir Hareketli Ortalamayı, Ichimoku Bulutu'nun temel bileşenlerini ve Stokastik osilatörü entegre eder. Benzersiz özelliği, piyasa koşullarını anında ortaya çıkaran akıllı mum renklendirme sistemidir: Yükseliş (Mavi): Fiyat her üç MA'nın üzerinded
FREE
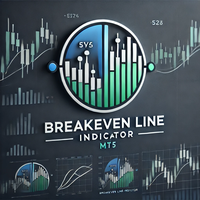
Simple indicator to show Breakeven line for all orders on attached chart pair. This indicator also comes with additional information such as Total Lot Size, Floating Drawdown in account's currency and Number of open positions and Difference from current price in Points. Do you use DCA (dollar cost average) or Hedging approach on your trading? Then this indicator you MUST have. Really useful, when you have multiple orders (hedging), this can help you quickly identify breakeven point without calc
FREE

BUY INDICATOR AND GET NEW EXCLUSIVE EA FOR FREE AS A BONUS! ITALO ARROWS INDICATOR is the best reversal indicator ever created, and why is that? Using extreme reversal zones on the market to show the arrows and Fibonacci numbers for the Take Profit, also with a panel showing all the information about the signals on the chart, the Indicator works on all time-frames and assets, indicator built after 8 years of experience on forex and many other markets. You know many reversal indicators around t

BUY INDICATOR AND GET EA FOR FREE AS A BONUS + SOME OTHER GIFTS! ITALO TREND INDICATOR is the best trend indicator on the market, the Indicator works on all time-frames and assets, indicator built after 7 years of experience on forex and many other markets. You know many trend indicators around the internet are not complete, does not help, and it's difficult to trade, but the Italo Trend Indicator is different , the Italo Trend Indicator shows the signal to buy or sell, to confirm the signal t

BUY INDICATOR AND GET EA FOR FREE AS A BONUS + SOME OTHER GIFTS! ITALO VOLUME INDICATOR is the best volume indicator ever created, and why is that? The Indicator works on all time-frames and assets, indicator built after 7 years of experience on forex and many other markets. You know many volume indicators around the internet are not complete, does not help, and it's difficult to trade, but the Italo Volume Indicator is different , the Italo Volume Indicator shows the wave volume, when market
Regime Radar — Market Regimes + Bias Stops (MT5) Regime Radar shows the current market regime — Range, Weak Trend, Strong Trend, or Shock — and draws ATR-based stop lines on the chart. It also provides a compact panel with regime, direction, confidence and optional RSI/Bollinger suggestions. This is an analysis tool; it does not provide trading signals and does not guarantee any profit. Main functions Regime detection in four states (Range, Weak Trend, Strong Trend, Shock). Bias indicator with
FREE
MetaTrader mağazası, alım-satım robotları ve teknik göstergeler satmak için en iyi yerdir.
MetaTrader platformu için ilgi çekici bir tasarıma ve iyi bir açıklamaya sahip bir uygulama geliştirmeniz yeterlidir. Milyonlarca MetaTrader kullanıcısına sunmak için size ürününüzü Mağazada nasıl yayınlayacağınızı açıklayacağız.
Alım-satım fırsatlarını kaçırıyorsunuz:
- Ücretsiz alım-satım uygulamaları
- İşlem kopyalama için 8.000'den fazla sinyal
- Finansal piyasaları keşfetmek için ekonomik haberler
Kayıt
Giriş yap
Gizlilik ve Veri Koruma Politikasını ve MQL5.com Kullanım Şartlarını kabul edersiniz
Hesabınız yoksa, lütfen kaydolun
MQL5.com web sitesine giriş yapmak için çerezlerin kullanımına izin vermelisiniz.
Lütfen tarayıcınızda gerekli ayarı etkinleştirin, aksi takdirde giriş yapamazsınız.