适用于MetaTrader 5的技术指标 - 20
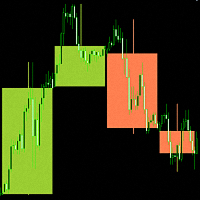
"Candlesticks MTF 5" is an information indicator that displays "Japanese Candlesticks" . The indicator analyzes and determines the opening and closing times of candles from higher time frames.
An algorithm has been developed for the "Candlesticks MTF 5" indicator that corrects the discrepancy between the opening and closing times of candles from higher time frames. For example, if the opening time of a candle on a weekly time frame is the 1st of the month, and on the smaller time frame this da
FREE

Volumatic Fair Value Gaps is a precision-engineered indicator for identifying, analyzing, and visualizing Fair Value Gaps (FVGs) backed by volume intelligence. This tool goes beyond standard FVG plotting by dissecting volume dynamics inside each gap using lower-timeframe sampling , offering clear insight into whether bulls or bears dominate the imbalance. Designed for technical traders, this indicator overlays high-probability gaps only, visualizes bullish vs. bearish volume composition , and pr

SCALPFLASH-X
Where Fibonacci Precision Meets RSI Intelligence.
Next-gen trading system combining Adaptive Fibonacci Pivots, RSI Heat Mapping, and Smart Candle Analytics. Detect market dominance, momentum shifts, and reversal zones in real time across multiple timeframes. Institutional accuracy, retail simplicity — built for speed, clarity, and precision.
Advanced Multi-Timeframe Fibonacci & RSI-Driven Market Intelligence System ScalpFlash-X — A next-generation trading system combining Fibonacc

We often need to know the sudden change in trend that happens on the graph and this can be confirmed through indicators.
This indicator shows the moments of trend reversal and how in which trend the price is shifting.
Custom background, no need to configure the colors in the chart, just drag the indicator!
Indication with arrows.
- Blue arrow: Upward trend.
- Pink Arrow: Downward Trend.
NOTE: Free indicator, support may take a while to respond.
FREE
https://www.mql5.com/en/users/gedeegi/seller
The "RSI+ with 123 Fractals" logo is designed to provide a clear and professional visual representation of a complex technical indicator, focused on precise market analysis and reliable patterns. Each element in the design is crafted to reflect the philosophy and strengths of the indicator within the trading world. Design Elements: "RSI+" Text in Bold and White:
The main "RSI+" text is chosen to be the focal point, with a bold and clear font. The us
FREE

The Pure Price Action ICT Tools indicator is designed for pure price action analysis, automatically identifying real-time market structures, liquidity levels, order & breaker blocks, and liquidity voids. Its unique feature lies in its exclusive reliance on price patterns, without being constrained by any user-defined inputs, ensuring a robust and objective analysis of market dynamics. Key Features Market Structures A Market Structure Shift, also known as a Change of Character (CHoCH), is a pivot

CONGESTION BREAKOUT PRO
This indicator scans the breakout of congestion zones . This indicator unlike any other congestion indicator you will find in the market right now, it uses an advanced algorithm not peculiar to most traditional congestion indicators available today . The advanced algorithm used to define the congestions is greatly responsible for the high rate real congestion zones and low rate fake congestion zones spotted by this product.
UNDERSTANDING CONGESTION
Congestion are ar
Multi-Timeframe EMA Trend Detector Pro Advanced EMA trend analysis tool with crossing detection and trend strength confirmation across 5 timeframes. The Multi-Timeframe EMA Trend Detector Pro is a comprehensive indicator built for traders who rely on trend-based strategies. It analyzes Exponential Moving Averages (EMAs) of 50, 100, and 200 across five key timeframes (M15, M30, H1, H4, and Daily) to identify reliable trends, trend reversals, and consolidation periods. Key Features Multi-Timefram
FREE

ICT Unicorn Hunter – Multi-Timeframe Smart Setup Detector IMPORTANT: This is a Multi-Timeframe Scanner, looking for 'Unicorn' setups. A Unicorn in this definition is a liquidity sweep, market structure shift and creation of a Fair Value Gap overlapping with the last opposite-close candle before the liquidity sweep (breaker). This scanner does NOT provide visualisation of the Unicorn on the chart.
For visualisation, use the Unicorn Tracker indicator, which is designed to work with the Unicorn
FREE

A very simple indicator, but one that cannot be missed when carrying out your operations.
Fast and accurate Spreed information before entering a trade as well as the time to start another candlestick.
Spread refers to the difference between the buy (purchase) and sell (offer) price of a stock, bond or currency transaction.
Come and see our mql5 signals too. https://www.mql5.com/pt/signals/899841?source=Site +Signals+From+Author
FREE
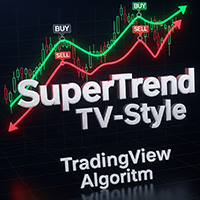
SuperTrend TV-Style replicates the classic SuperTrend indicator from TradingView, now available for MetaTrader. It uses ATR-based volatility to detect trend direction and plot dynamic buy/sell zones on the chart. Green line: uptrend Red line: downtrend Arrows: buy/sell signals at trend shifts Customizable source price (HL2, HLC3, etc.) and ATR method Simple, fast, and familiar - ideal for traders switching from TradingView or looking for a clean trend-following tool.
FREE
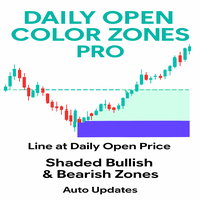
This indicator is a professional tool designed to plot the Daily Open Line and instantly shade the bullish and bearish price zones around it. Instead of leaving traders guessing, it delivers a clear visual map of market sentiment from the very first of the day. Its goal: to help you instantly identify whether the market is trading above or below the daily open — a key reference point for intraday strategies.
The indicator automatically draws a horizontal line at the daily open price and shades
FREE
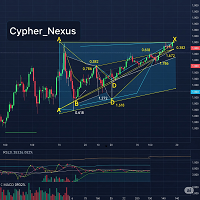
Cypher Pattern Detector A tool for automatic detection of Cypher harmonic patterns (XABCD) in financial charts. Overview The Cypher Pattern Detector identifies both bullish and bearish Cypher harmonic patterns in real time. It applies Fibonacci ratio validation and a quality scoring system to highlight patterns that closely match the defined structure. This helps traders observe and analyze potential market structures more consistently, without the need for manual drawing. Main Features Pattern
FREE

Pipsometer is an elegant, real-time panel indicator for MT5 that instantly shows you both your cumulative money and pip gain/loss and total trades executed on the current chart. It dynamically changes its display color—green for net profit and red for net loss—so you can gauge performance at a glance without opening reports or scrolling through trade history.
FREE
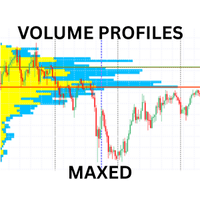
Advanced Volume Profile Indicator for MT5
Transform your trading with professional-grade volume analysis. This comprehensive volume profile indicator delivers institutional-quality market insights with multiple profile types, advanced alert system, and customizable display options. KEY FEATURES Multiple Profile Types Visible Range Profile: Analyzes volume within the current chart window Fixed Range Profile: Custom date range analysis with visual markers Session Profile: Automatic daily/week
解锁精准交易:ATR 动态枢轴系统 立即下载这款 免费 的 ATR Pivot Signals 指标,立即在市场噪音中占据优势。对于那些要求基于 真实市场摆动反转 而非猜测来确定高信心入场点的交易者来说,这是终极工具。 ATR Pivot Signals 系统是一款创新的技术指标,它利用 平均真实波动范围 (ATR) 动态过滤波动性,确保仅在价格出现统计学上显著的移动时才触发信号。它通过动态设置 反转阈值 来消除假突破,使其在所有市场条件下都有效——无论是平静的盘整还是爆炸性的趋势。 ATR 动态枢轴指标的关键特点: 动态、过滤噪音的反转: 使用可自定义的 ATR 因子 来调整反转阈值,使其适应当前市场波动性,忽略次要回调。 高信心信号: 直接在主图表上提供明确的 买入 (绿色)和 卖出 (红色)箭头,标记确认主要摆动枢轴的确切价格柱。 不重绘技术: 信号在K线收盘时确认并锁定。该指标采用防闪烁逻辑设计,确保对每个历史和实时信号的信任。 趋势识别: 清晰地跟踪市场状态(上涨/下跌趋势),为您提供简洁的视觉框架来确定方向偏差。 简单且高效: 易于安装,仅有两个关键输入参数可根据您的交易风
FREE

Simple Vwap with the daily, weekly and monthly
VWAP is the abbreviation for volume-weighted average price , which is a technical analysis tool that shows the ratio of an asset's price to its total trade volume. It provides traders and investors with a measure of the average price at which a stock is traded over a given period of time.
How it's used Identify entry and exit points: Traders can use VWAP to determine when to buy or sell an asset. Understand price trends : Traders can use V
FREE
This indicator is a technical tool based on harmonic approximations of solar and lunar cycles. It does not use exact astronomical positions. This indicator uses mathematical waves to approximate daily solar and monthly lunar cycles for trading purposes. It captures general market rhythms influenced by day/night and moon phases, but it does not track exact astronomical positions . Do your analysis and study on back test before purchase. The Advanced Astrological Indicator is a m

Eagle Spikes Detector v1.50 - Professional Trading Signal System Ultimate Precision Trading with Advanced SuperTrend Filtering Technology join my telegram channel to trade with me: https://t.me/ +9HHY4pBOlBBlMzc8
The Eagle Spikes Detector is a sophisticated, professional-grade trading indicator designed for serious traders who demand precision, reliability, and visual excellence. Combining advanced multi-timeframe analysis with cutting-edge SuperTrend filtering, this indicator identifi
FREE

MACD Support–Resistance Candle Analyzer — Professional This indicator enhances the classic MACD by combining momentum analysis with dynamic Support & Resistance detection , giving traders a clearer view of breakout strength and market structure. It transforms price action into color-coded MACD candles , highlights SnR break levels , and provides clean visual confirmation of trend continuation or reversal. Ideal for scalpers, intraday traders, and swing traders who rely on fast, structured trend
FREE

STAMINA HUD – Advanced Market & Trend Dashboard (MT5) STAMINA HUD is a professional market information panel designed for traders who want clarity, speed, and control directly on the chart. It provides a clean heads-up display (HUD) with essential market data and multi-timeframe trend direction , without cluttering the chart or generating trading signals.
What STAMINA HUD Shows Current Price
Spread (in real pips)
Today High–Low range (pips)
Average D
FREE

The Pulse 是实时显示累积周期的指标。 简单来说:积累是"聪明的钱"在市场上发起强大的运动之前悄悄地收集资产。 在图表上,看起来价格"卡在"一个范围内。 这是积累阶段-有人正在准备一个大动作。 如果你学会注意到这些时刻-当市场似乎"冻结",但在同一时间感到紧张—你可以在正确的时间在正确的地方。
确定累积周期意味着能够等待合适的时机。 The Pulse 指标显示积累周期,积累中的价格可以随心所欲地移动,但最常见的是横向移动。 The Pulse Blog. The blog: Why every trader should have The Pulse indicator as an additional tool for trading. Version mt4
累积周期可以以不同的方式使用:
在积累期间,您可以远离市场,等待价格释放积累的能量并开始移动。 适当的技能和经验,你可以在积累本身内进行交易。 如果在长期价格或趋势变动后出现累积,则可能更好地查看以前打开的交易。 例如,固定利润或将其设置为盈亏平衡。
而且,在 The Pulse 指标的帮助下,你会更好地看到和
This indicator is the mql version of the Linear Regression Candles indicator. There are many linear regression indicators out there, most of them draw lines or channels, but this one actually draws a chart.This script includes features such as linear regression for open, high, low, and close prices, signal smoothing with simple or exponential moving averages. Find out more here: https://www.mql5.com/en/users/rashedsamir/seller I welcome your suggestion for improving the indicator
To incre
FREE

Friend of the Trend: Your Trend Tracker Master the market with Friend of the Trend , the indicator that simplifies trend analysis and helps you identify the best moments to buy, sell, or wait. With an intuitive and visually striking design, Friend of the Trend analyzes price movements and delivers signals through a colorful histogram: Green Bars : Signal an uptrend, indicating buying opportunities. Red Bars : Alert to a downtrend, suggesting potential selling points. Orange Bars : Represent cons
FREE
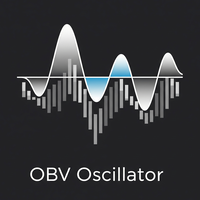
Overview The OBV Oscillator is a custom technical indicator for MetaTrader 5, designed to provide a clearer visualization of On Balance Volume (OBV) by transforming it into an oscillator. This indicator aims to assist traders in identifying trend confirmations, potential reversals, and momentum shifts by analyzing the relationship between price and volume. It features a customizable Moving Average (MA) for smoothing the OBV, a signal line for generating crossover signals, and an alert system to
FREE

Smoothed Supertrend Indicator - 基于波动率的趋势指标与平滑功能 Smoothed Supertrend Indicator是MetaTrader 5经典Supertrend指标的高级变体。通过集成额外的平滑功能,减少了市场噪音并提高了趋势信号的质量。 技术说明: 该指标基于平均真实波幅(ATR)来测量市场波动性,并将其与价格数据的移动平均平滑相结合。生成的线显示当前趋势方向,并动态适应波动性变化。 计算方法: 计算价格的移动平均(MA) 计算N个周期的平均真实波幅(ATR) 计算上下轨: 上轨 = MA + (ATR × 乘数) 下轨 = MA - (ATR × 乘数) 根据收盘价相对于轨道的位置确定趋势 阶梯逻辑: 线条仅在趋势反转时变化 输入参数: ATR_Period (默认: 10) - ATR计算的周期数 ATR_Multiplier (默认: 3.0) - 带宽乘数 Smoothing_Period (默认: 5) - 价格平滑的周期数 MA_Method (默认: SMA) - 移动平均方法(SMA, EMA, SMMA, LWMA) B
FREE

Support Resistance Catcher Indicator Features and Explanation
Overview: The Support Resistance Catcher is a custom MT5 indicator designed to identify and visualize supply (resistance) and demand (support) zones based on candlestick price action. It detects zones where price has reversed after rallies or drops, using wick rejections and clustering. The indicator draws horizontal rectangles for active and historical zones, with customizable colors, labels, and alerts.
Key Features:
1. Zone Det

Hunt markets with Hunttern ZigZag . Easy to use with one parameter
You can use it for the following: -Classic patterns -Heads and shoulders -Harmonic patterns -Elliott Wave -Support and resistance -Supply and Demand
Single parameter: -Period (1-120)
Features: -Candle time -Single parameter -Light mode template
This is version 1 of Hunttern ZigZag. We are very happy to receive feedback from you.
FREE
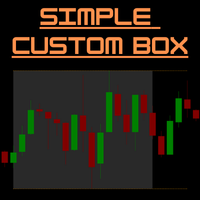
SimpleCustomBox – MT5 自定义交易区间及高低线指标 概述:
SimpleCustomBox 是一款功能强大且易于使用的 MT5 指标,可以在图表上清晰标注指定的交易时间段。自定义时间范围,直观显示区间的最高价和最低价,让你轻松做出更明智的交易决策。非常适合日内交易者、剥头皮交易者以及依赖日内价格模式的交易者。 主要功能: 自定义交易区间: 在图表上高亮显示任意时间段(例如 02:00 – 06:00)。 动态交易区间框: 自动每日更新,支持显示多天历史数据,便于回测和分析。 高低线绘制: 根据区间绘制顶部和底部价格线,可延伸至用户自定义的时间(例如延伸至 14:00)。 可视化自定义: 可调整区间框颜色、线条颜色、宽度及样式(实线、虚线、点线等)。 自动更新: 区间框和高低线实时更新,无需手动调整。 图表清理方便: 移除指标时,所有区间框和高低线将自动删除。 优势: 快速识别交易区间和波动区域。 通过精确的视觉标记提升日内交易策略的效率。 完全自定义图表显示,简化分析过程。 秒级显示多天历史区间,节省时间。 参数设置概览: 参数 功能说明 StartHour ,

Fibo Trend Smart MAXIMUS Ritz Fibo Trend Smart MAXIMUS 1 is an advanced trading indicator that integrates various technical analysis tools into one comprehensive display. This indicator is designed to help traders identify trading opportunities with high accuracy, utilizing a combination of Fibonacci, ZigZag, and price action confirmation. Key Features Smart Fibonacci Retracement 11 Customizable Fibonacci Levels (0%, 23.6%, 38.2%, 50%, 61.8%, 100%, 123.6%, 138.2%, 150%, 161.8%, 200%) Different
FREE

WaveTrendPro Arrow – Adaptive Cross Signal with Smart Alerts Description WaveTrendPro Arrow is a clean and powerful visual indicator designed to detect trend-reversal points using the classic WaveTrend oscillator (WT1/WT2 cross) , enhanced with intelligent on-chart arrows , real-time alerts , and mobile push notifications . Unlike traditional WaveTrend indicators that display signals in a subwindow, this version shows precise entry arrows directly on the main chart , positioned adaptively
FREE

Overview
Support & Resistance (MTF) is a MetaTrader 5 indicator that automatically identifies swing highs (resistance) and swing lows (support) across up to three timeframes. It merges nearby levels to reduce clutter, adapts zone width to market volatility using ATR, and offers optional alerts when price breaks or retests those levels. Features Multi-timeframe pivot detection
Identify pivots on the current chart plus two higher timeframes using a configurable pivot length. Merge-distance grou
FREE

A heatmap is a graphical representation of data in two dimensions, using colors to display different factors. Heatmaps are a helpful visual aid for viewers, enabling the quick dissemination of statistical or data-driven information. The MP Heatmap indicator provides a graphical representation of the relative strengths of major currencies compared to others, organizing data from pairs into color-coded results and producing a clear overview of the entire Forex market. The MP Heatmap indicator dis
FREE
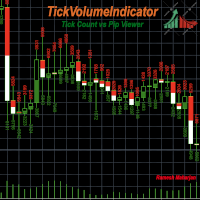
有多种指标和方法可用于识别图表中的趋势。TickVolumeIndicator 就是其中之一。它通过使用逐笔报价数据显示过去的趋势,帮助您识别和预测未来趋势。
TickVolumeIndicator 是一种使用逐笔报价交易量为图表中可见的 K 线图绘制颜色的指标。逐笔报价交易量指的是买入价和卖出价。用户可以选择逐笔报价的买入价和卖出价计数,或 K 线图时间范围内的点差变化。当卖出价大于之前的卖出价时,会添加卖出价计数;当买入价小于之前的买入价时,会添加买入价,两者均根据 K 线图高度进行标准化,以便在图表中显示。点差变化的计算方式相同。
用户有以下选项:
1) 卖出价颜色:用户可以选择红色、绿色、蓝色、紫色、黄色、青色、紫红色、棕色、橙色、粉色、白色或无作为卖出价颜色。默认为绿色。
2) 买入价颜色:用户可以选择红色、绿色、蓝色、紫色、黄色、青色、深紫色、棕色、橙色、粉色、白色、无作为买入价颜色。默认为红色。
3) 点数 vs 点数:用户可以选择显示点数颜色或点数变化颜色。默认为点数。
4) 边框类型:用户可以选择扁平、凸起和非动态指针作为边框类型。默认为凸起。
5)
FREE

该指标基于著名的分形指标,但具有很强的定制性 和灵活性,
这是识别趋势逆转并最大化您的利润潜力的强大工具。
凭借其先进的功能和用户友好的界面,它是各个级别交易者的最终选择。 MT4 版本: Ultimate Fractals MT4 特征 :
可定制的分形蜡烛数。 反转线。 可定制的设置。 用户友好的界面。 主要参数: 左侧蜡烛 - 左侧形成分形的条形数量。 右侧蜡烛 - 分形右侧的条形数量。
不要让市场的不确定性阻碍您。使用“终极分形”指标提升您的交易游戏。
加入成功交易者的行列,依靠此工具做出自信的决策并实现财务目标。 请随意定制此产品描述,以突出显示您的特定“Ultimate Fractals MT5”指标的任何独特功能或优点,
并向我询问有关产品的任何问题或建议。
FREE

速度阻力线是确定趋势和阻力线的有力工具。 该指标使用图表极值和特殊的数学公式构建线条。 该指标可用于确定趋势方向和枢轴点。
<---------------------------->
指标参数:
"Depth of search" -搜索图表极值的深度(以条形为单位) "Back step of search" -极值之间的最小距离(以条为单位) "Deviation of price" -同一类型极端之间的允许价格差异 "Line color" -带有相应索引的线条颜色 "Line style" -带有相应索引的线条样式 "Line width" -具有相应索引的线宽 <---------------------------->
你可以在"艾德森*古尔德的稀有作品集"一书中找到更多信息,也可以在私人信息中与我联系。
<---------------------------->
提前感谢所有有兴趣的人,祝你好运征服市场!
FREE

If you love this indicator, please leave a positive rating and comment, it will be a source of motivation to help me create more products <3 How to use SuperTrend? When the price crosses above the supertrend line it signals a buy signal and when the price crosses below the supertrend line it signals a sell signal. The supertrend indicator which acts as a dynamic level of support or resistance and helps traders make informed decisions about entry and exit points. When prices are above s upertre
FREE

它预测最有可能的短线价格走势,基于先进的数学计算。
功能 评估即时价格走势; 计算实时市场趋势; 计算最重要的支撑和阻力位; 算法优化,在进行复杂数学计算时系统资源消耗最小。 最佳性能自调整, 所以它可以工作于任何品种 (无论它有多奇葩) 以及任意时间帧; 与所有 MetaTrader 平台兼容, 不管报价位数或其它参数; 与所有其它工具兼容 (指标, EA 或脚本),不会减缓终端性能和交易操作。 注: 为了获取多个时间帧的数值, 密集区域和附加的功能,您必须适用 专业版 或 大师版 。
介绍 构建一般交易策略的许多经典指标都基于简单的数学,不是因为创建这些指标时,没有优秀的数学家 (事实上,那时的数学家有可能比现在更好),但因为电脑还不存在,或是它们太简单,持续处理复杂数学操作的能力低下。如今,任何智能手机都完胜几十年前最强大的计算机。所以,处理海量信息的能力如今不再是限制,除了极其复杂的模拟处理。 高级价格走势预测者 (APMP) 指标利用当前处理能力的优势,通过一些最先进的数学、统计和概率的概念,来捕获价格波动的本质。 APMP 不能用来预测它自己,由于价格运动是一种非平稳随
FREE

通过 Consecutive Candle Indicator MT5 增强您的趋势识别能力,这是一款动态工具,旨在识别连续的看涨或看跌K线序列,为外汇、股票、加密货币和商品市场提供及时的趋势确认和潜在反转警报。在 Forex Factory 和 Reddit 的 r/Forex 等交易社区中备受推崇,并在 Investopedia 和 TradingView 的讨论中因其简化动能分析的能力而受到赞扬,该指标是寻求在波动市场中获得清晰信号的交易者的首选。用户报告称,使用较高的K线计数(例如,3-5根连续K线)时,检测持续趋势的准确率高达80%,许多人指出通过避免过早入场并专注于确认的动能变化,交易时机提高了15-25%。其优势包括精确识别趋势强度、可定制的警报实现免手动监控,以及用户友好的设计,无需额外工具即可增强剥头皮、日内交易和波段交易者的决策能力。 Consecutive Candle Indicator MT5 在用户定义的连续看涨K线数量(默认 N_CANDLE=3)后跟一根看跌K线后,在K线下方绘制绿色向上箭头(BuyBuffer),提示潜在的趋势耗尽或反转;在连续看跌K线
FREE
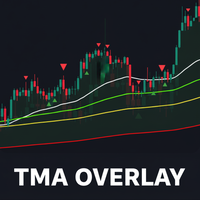
TMA Overlay Indicator for MT5 - User Guide 1. Introduction TMA Overlay is a versatile technical analysis indicator for the MetaTrader 5 platform. The indicator's goal is to provide traders with a comprehensive overview of the trend, potential entry signals, and key trading sessions, all integrated into a single chart. This is not a trading system, but a comprehensive analysis tool designed to help you make more informed decisions. 2. Core Indicator Components The indicator consists of multiple c
FREE

This is a simple Orderblock alert indicator. it alerts you once it spots a bullish or bearish OB. what you choose to do with the alert, is left to you. Feel free to test on demo before use. (I'll be working on a combo i.e this and an EA working side by side, anticipate) Bullish OB has a light blue color and bearish has a light red color (rectangle box drawn on chart). Please trade wisely and don't forget to leave a positive review. thanks More blues to you, and Happy Trading!
FREE

super trend version is to help you to have real time view of market move it will help you to get a live view of current market buy signal line and arrow to help you understand batter the direction sell signal line and arrow to help you understand batter the direction trade what you see not what you think this is an simple and best trading tool for our traders of any market crypto gold
FREE

The Bar Time Countdown indicator displays the remaining time before the current candle (bar) closes and a new one opens. It provides a clear, real-time countdown in minutes and seconds , helping traders precisely time their entries and exits during fast-moving markets — especially for scalping or breakout strategies. Designed with a clean, minimal interface , it automatically adjusts to any timeframe and symbol. The countdown is updated every second and positioned conveniently on the chart, with
FREE

Stochastic RSI makes a stochastic calculation on the RSI indicator. The Relative Strength Index (RSI) is a well known momentum oscillator that measures the speed and change of price movements, developed by J. Welles Wilder.
Features Find overbought and oversold situations. Sound alert when overbought/oversold level is reached. Get email and/or push notification alerts when a signal is detected. The indicator is non-repainting. Returns buffer values for %K and %D to be used as part of an EA. (se
FREE
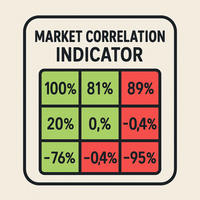
总体描述
该指标实时计算多个金融工具之间的皮尔逊相关系数。它显示一个动态相关性矩阵,用于展示货币、指数、股票和大宗商品之间关系的强度和方向。 主要参数 SymbolsList : 需要比较的工具列表(用逗号分隔) BarsToAnalyze : 用于计算的历史K线数量 TimeFrame : 相关性分析的时间周期 相关性解释 接近 +1.00 的值表示强正相关 接近 -1.00 的值表示强负相关 接近 0.00 的值表示弱相关或无相关 交易优势 监控持仓之间的相关性以降低过度暴露风险 识别投资组合中的多样化机会 支持对冲和套利策略 通过跨市场分析验证交易信号 重要提示
该指标适用于交易终端中的所有金融工具,支持日内、日线及更高级别的时间周期。内置的颜色编码系统可帮助快速识别强相关、弱相关和负相关。 关键词
mt5相关性指标, 外汇相关性, 相关性矩阵, 跨市场分析, 货币对相关性, 市场相关性, 多资产交易, 风险管理, 投资组合多样化, 外汇对冲, 套利交易, 指数相关性, 股票相关性, 大宗商品相关性, 负相关性, 正相关性, 皮尔逊系数, 金融工具相关性, 交易相关性分析
FREE
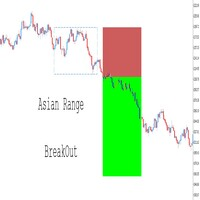
完全可定制 – 通过调整范围时间、颜色、线条样式和风险回报设置,使该指标适应您的个人交易风格。 交易水平可视化 – 根据突破条件自动绘制入场价格、止损 (SL) 和止盈 (TP) 水平。 与智能交易系统 (EAs) 无缝集成 – 通过添加额外的确认信号(如 RSI、均线、结构突破 (BOS) 等)来完全控制您的自动交易策略。您还可以 自定义缓冲区名称 ,以匹配您的 EA 需求,从而实现更大的策略灵活性。 多资产 & 多时间框架回测 – 在 外汇货币对、加密货币及其他交易工具 上测试不同配置,找到最适合您的交易策略的设置。 清晰简洁的界面 – 以非干扰性的显示方式关注价格走势,使交易信号更易于理解。 该指标为交易者提供了 突破策略的坚实基础 ,但其真正的优势在于灵活性。您可以 修改和增强 它,结合额外的指标或逻辑,以适应您的独特交易方法。 试用、回测,并优化它,以匹配您的个性化交易策略! 立即在 MQL5 上获取完整版,让您的交易更进一步!
FREE

基于成交量的支撑与阻力区域 Volume-based Support and Resistance Zones 是一款功能强大且灵活的 MetaTrader 5 指标,帮助交易者识别由成交量高峰在分形高点和低点形成的关键市场水平。 该工具会自动绘制出 支撑与阻力区域 ,显示价格最有可能出现反应的位置,帮助您以更高的信心和清晰度进行交易。
主要功能 基于成交量的逻辑 :当高成交量的K线出现在分形高点或低点时形成区域。 基于影线的区域尺寸 :每个区域的高度会根据来源K线的影线长度动态调整。 不重绘 :区域一旦形成即保持固定——适用于实时交易和历史测试。 多周期支持 :可在所有标准图表周期上稳定运行。 高度可自定义 :可调整检测灵敏度、视觉样式及区域行为以适应您的策略。 智能提醒 :当价格进入或触及区域时,可通过 弹出提示 、 推送通知 、 电子邮件 或任意组合的方式提醒您。
提醒选项 交易者可以设置提醒,在价格触碰或进入支撑/阻力区域时触发。可选的提醒方式包括: 弹出提示 :在 MetaTrader 5 终端内显示的即时消息。 推送通知 :直接发送到您的 MetaTrader 移动应用
FREE

Please check the " What's new " tab regularly for a complete and up-to-date list of all improvements + parameters. FREE indicator for my trading utility Take a Break . This indicator allows you to manage multiple other EAs with just one Take a Break EA instance. Simply specify the corresponding Chart Group in the indicator(s) and Take a Break EA settings and you are good to go.
Setup examples (Indicator + EA)
As a prerequisite, add the URL https://trading.custom-solutions.it to the list of al
FREE

The TMA Centered Bands Indicator for MT5 draws bands on the chart and shows the overall price trend. It displays three bands - the lower and upper boundaries of the channel and the median. The bands are made up of moving averages, and each of them has an MA period. The name TMA comes from triangular moving averages, as the indicator draws triangular bands. The price will fluctuate between these ranges whenever the trend changes direction, thus creating entry and exit points. How to trade
FREE

Overlay indicator on chart between 2 pairs
The Timeframe Overlay indicator displays the price action of timeframes on a single chart, allowing you to quickly assess different timeframes from a single chart. The advantage is to observe and follow the correlations of price movements in real time to help you find potential trades at a glance.
---- Symbol 1 ----
Symbol = EURUSD
Correlation Inverse = false
Display = true
Ratio
FREE

Check out my TRADE PLANNER MT5 – strongly recommended to anticipate account scenarios before risking any money. This is the moving average convergence divergence (MACD) indicator based on Heikin Ashi calculations. Here you find multi-colored histogram which corresponds to bull (green) / bear(red) trend. Dark and light colors describes weakness/strenght of price trend in time. Also you can switch calculations between normal and Heikin Ashi price type.
Note: Buffers numbers for iCustom: 0-MACD,
FREE

HiperCube Market Profile ! Discount code for 20% off at Darwinex Zero: DWZ2328770MGM_20 A Market Profile is a graphical representation that combines price and time information in the form of a distribution . It displays price information on the vertical scale (y-axis) and volume information on the horizontal scale (x-axis). This chart type provides insights into market activity, allowing traders to visualize and evaluate fair market value in real-time.
Features: Custom Colors Custom Chart Cl
FREE
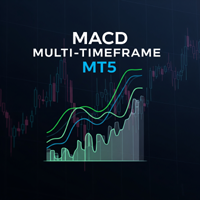
The Multi-Frame MACD Indicator is a robust MetaTrader 5 (MT5) indicator that utilizes the Moving Average Convergence Divergence (MACD) to analyze trends across multiple timeframes. This indicator synchronizes MACD-based trend signals from up to nine timeframes (M1, M5, M15, M30, H1, H4, D1, W1, MN1) and presents them with clear visual cues, including a colored MACD line, signal arrows, and a customizable dashboard. Perfect for traders seeking momentum and trend reversal insights. Features Multi-
FREE

Big bull scalper Short Description Master market structure with the precision of the popular Big bull scalper This tool automatically identifies key pivot highs and lows, plotting unique "angling" trend lines that dynamically define market context. It visually confirms Breaks of Structure (BOS) and Changes of Character (CHoCH), removing all guesswork from your analysis.
Key Features: Automatic Pivot Detection Instantly spots significant swing highs and lows. Dynamic Angling Lines Visual
FREE

Fair Value Gap Sweep is a unique and powerful indicator that draws fair value gaps on your chart and alerts you when a gap has been swept by the price. A fair value gap is a price gap that occurs when the market opens at a different level than the previous close, creating an imbalance between buyers and sellers. A gap sweep is when the price moves back to fill the gap, indicating a change in market sentiment and a potential trading opportunity.
Fair Value Gap Sweep indicator has the following
FREE

Session Killzone Indicator
Indicator that helps you to identify the killzone times of both London and NewYork sessions which usually is the most times for high volatility and taking liquidity from the market. Killzone times are configurable through indicator parameters. The indicator adjusts the range of the killzones based on the daily trading range.
FREE

Session Box Indicator for MetaTrader 5
Description: The SessionBox indicator is designed to visually represent the trading sessions on a chart, specifically the Asian, European, and American sessions. This indicator draws customizable rectangles around each session, allowing traders to easily identify different trading periods. It also includes labels to denote each session, enhancing clarity.
Users only need to input the session start and end hours in their server time. Please note, the Asia
FREE

Wyckoff fans, enjoy!
Ideally to be used with the Weis Waves indicator, but it can be easily used alone, the Waves Sizer puts the range (in resulting Price movement) done by the Price on its market swings. You can control how accurate or loose will be the swings. This tool is very helpful for visually know how much the Price has traveled in your Timeframe. This way you can confront this level of effort with the resulting Volume, etc... Weis Waves indicator:
https://www.mql5.com/en/market/produc
FREE

Detailed blogpost: https://www.mql5.com/en/blogs/post/766378
Key Features
Adaptive Upper/Lower bands Smooth Center Line Customizable Length (sensitivity) Non-Repainting (only current ongoing bar is updated every "Refresh After Ticks" number of ticks) Multiple Price Sources - Choose from close, open, high, low, median, typical, or weighted close Components:
The Basis Line The smooth center line represents the weighted average of price. Think of this as the "true" price level when all the noise
FREE
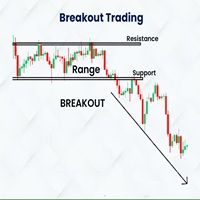
Indicador Basado en la estrategia de ruptura del rango de londres de Amaury Benedetti.
Este indicador dibuja automaticamente el rango, el maximo y minimo y sus correspondientes lineas de stoploss, entrada y takeprofit.
SE RECOMIENDA USAR EN M1 EN EL US30 (DE ACUERDO A LA ESTRATEGIA)
Los valores se pueden modificar de acuerdo a la necesidad del usuario, tambien se tienen mas configuraciones para dibujar cualquier rango en diversos horarios y con diferentes configuraciones de sl, tp, etc
Detal
FREE

El indicador técnico Trend Magic es una herramienta de análisis de tendencias que combina el Índice de Canal de Mercancía (CCI) y el Rango Verdadero Medio (ATR) para identificar la dirección de la tendencia del mercado. Aquí tienes un resumen de sus pros y contras, así como las mejores condiciones del mercado para su uso:
Pros: - Identificación clara de la tendencia: Cambia de color para indicar tendencias alcistas (azul) y bajistas (rojo), lo que facilita la visualización de la dirección del
FREE
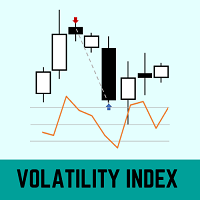
This indicator uses historical volatility and a 21-period moving average to define the price distortion in relation to the average.
The calculation of historical volatility was based on the book (Odds: The Key to 90% Winners) written by Don Fishback.
A Volatility Index with a value greater than 30 may indicate that the price is distorted from its fair price.
QUESTIONS ABOUT THE INSTALLATION OF PRODUCTS AT META TRADER You can also find some instructions on how to install a robot in the Me
FREE

Want to AUTOMATE this strategy? We have released the fully automated Expert Advisor based on this logic. Check out Range Vector Fibo Logic EA here: https://www.mql5.com/en/market/product/158065
UPGRADE AVAILABLE: Tired of manual trading? I just released the Automated MTF Version with Mobile Alerts and Auto-Targets. Get the Pro Version here: https://www.mql5.com/en/market/product/159350
Range Vector Fibo Logic (Indicator) One Candle Strategy
Stop waking up at 3 AM to draw lines manually. Ran
FREE

Volume at Price (VAP) VAP is a right-anchored Volume Profile Heatmap for MetaTrader 5 designed for clean, fast, and stable execution on any chart. It shows where trading activity clustered, not just when—so you can read balance/imbalance, spot value migration, and plan trades with precise references: VAH, VAL, and POC . What VAP shows Heatmap Profile (tick-volume):
A compact, right-anchored histogram that scales with the chart. Value Area (~70%) in Gold Non-Value in White Soft shadow gradient
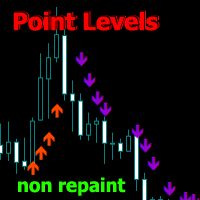
Point Directions MT5 - 款显示价格变动期间支撑位和阻力位的指标。箭头指示价格在指定方向的反弹。
箭头不会重绘,且在当前蜡烛图上形成。适用于所有时间框架和交易工具。提供多种警报类型。
它具有高级设置,可用于自定义任何图表的信号。它可以配置用于趋势交易和修正交易。
绘制箭头时,有两种移动平均线类型和一种箭头强度级别。详细设置请参见输入参数。
如有任何使用方面的问题,请发送私信。
输入参数
Method MA - 选择是否使用移动平均线生成箭头(标准或加速) Accelerated MA period/Standard MA period - 更改移动平均线周期 (5-500) Ma Metod - 更改移动平均线方法 Ma Price - 更改移动平均线价格 Arrow Intensity - 箭头强度(随着数值增加而增加) Arrow thickness - 箭头粗细 Sell arrow color/Buy arrow color - 箭头颜色 play sound / display message / send notification / send
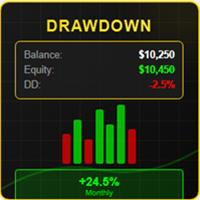
# 回撤指标 V4.0 - 掌控交易的必备工具
## 通过完整的实时绩效概览改变您的交易
在要求严苛的外汇和差价合约交易世界中,**了解您的实时绩效**不是奢侈品,而是**绝对必需**的。**回撤指标 V4.0** 不仅仅是一个简单的指标:它是您的**专业仪表板**,为您提供清晰、精确和即时的交易账户状态视图。
---
## 为什么这个指标将永远改变您的交易
### 90% 交易者面临的问题
您是否曾经遇到过以下情况之一?
**您不确切知道自己的状况** - 您的 MT5 平台显示数字,但您必须心算您的真实表现。
**您发现回撤为时已晚** - 当您意识到已经损失了 15% 的资金时,已经太晚了,无法有效应对。
**您缺乏历史可见性** - 无法快速知道本周、本月或今年是否盈利。
**您浪费时间分析交易** - 您必须打开多个窗口、进行计算,并失去对市场的关注。
**您没有概览** - 有多少持仓?我的全局盈亏是多少?我今天的表现如何?
### 解决方案:一体化专业仪表板
**回撤指标 V4.0** 通过提供一个**完整的控制面板*

MULTI INDICATOR SCANNER - PROFESSIONAL EDITION
PRODUCT DESCRIPTION
Multi Indicator Scanner is the most comprehensive technical analysis scanner on the market. It analyzes 10 different indicators simultaneously and provides you with clear BUY-SELL-NEUTRAL signals. No more checking dozens of indicators one by one!
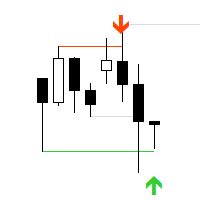
"AV Stop Hunter MT5" is an indicator for MetaTrader 5, which draws entry arrows for long and short after so-called Stop Hunt candles and has several notifications about them. Since this is a smart money concept , the periods H1 and H4 are the best. Increasing volume improves the signal, lines and arrows are then thicker. The MQL5 variant has colored stop-hunting candles. NEW: Signal Buffer: 1, 0 or -1
Definition :
Stop hunting, also known as stop running, is the practice of institutional trad

This is an advanced multi-timeframe version of the popular Hull Moving Average (HMA) Features Two lines of the Hull indicator of different timeframes on the same chart. The HMA line of the higher timeframe defines the trend, and the HMA line of the current timeframe defines the short-term price movements. A graphical panel with HMA indicator data from all timeframes at the same time . If the HMA switched its direction on any timeframe, the panel displays a question or exclamation mark with a tex

Golden Star MT5 是由一群专业交易者开发的MT5平台专业趋势指标。 其工作算法基于原作者的方法,它允许以高概率找到潜在的趋势反转点,并在趋势形成之初接收信号进入市场。 该指标适用于外汇上的黄金、加密货币和货币对。 警报系统(警报、电子邮件和移动通知)将帮助您同时监控多个交易工具。 您只需要在图表上安装指标,当指标信号出现时,就会触发警报。 使用我们的警报系统,您绝不会错过开仓信号! 使用 Golden Star 指标进行交易非常简单:如果指标线为绿色,则我们建立买入头寸。 如果指标线为红色,则开一个卖出头寸。
通过购买该指标,您将获得: 优秀的指标信号。 免费产品支持。 定期更新。 以各种方式接收信号的能力:警报、电话、邮件。 可用于任何金融工具(外汇、差价合约、期权)和期间。 指标参数 Period indicator - 指标计算周期。 Alerts on? - 启用/禁用通知。如果为真 - 启用,假 - 禁用。 Display messageas - 启用/禁用警报。如果为真 - 启用,假 - 禁用。 Send emai l - 启用/禁用发送电子邮件。
MetaTrader市场提供了一个方便,安全的购买MetaTrader平台应用程序的场所。直接从您的程序端免费下载EA交易和指标的试用版在测试策略中进行测试。
在不同模式下测试应用程序来监视性能和为您想要使用MQL5.community支付系统的产品进行付款。
您错过了交易机会:
- 免费交易应用程序
- 8,000+信号可供复制
- 探索金融市场的经济新闻
注册
登录