Articles with examples of trading robots developed in MQL5
An Expert Advisor is the 'pinnacle' of programming and the desired goal of every automated trading developer. Read the articles in this section to create your own trading robot. By following the described steps you will learn how to create, debug and test automated trading systems.
The articles not only teach MQL5 programming, but also show how to implement trading ideas and techniques. You will learn how to program a trailing stop, how to apply money management, how to get the indicator values, and much more.
Add a new article

You are missing trading opportunities:
- Free trading apps
- Over 8,000 signals for copying
- Economic news for exploring financial markets
Registration
Log in
You agree to website policy and terms of use
If you do not have an account, please register

Visualizing Strategies in MQL5: Laying Out Optimization Results Across Criterion Charts
In this article, we write an example of visualizing the optimization process and display the top three passes for the four optimization criteria. We will also provide an opportunity to select one of the three best passes for displaying its data in tables and on a chart.

Swap Arbitrage in Forex: Building a Synthetic Portfolio and Generating a Consistent Swap Flow
Do you want to know how to benefit from the difference in interest rates? This article considers how to use swap arbitrage in Forex to earn stable profit every night, creating a portfolio that is resistant to market fluctuations.
Creating Dynamic MQL5 Graphical Interfaces through Resource-Driven Image Scaling with Bicubic Interpolation on Trading Charts
In this article, we explore dynamic MQL5 graphical interfaces, using bicubic interpolation for high-quality image scaling on trading charts. We detail flexible positioning options, enabling dynamic centering or corner anchoring with custom offsets.

Neural Networks in Trading: Hierarchical Vector Transformer (Final Part)
We continue studying the Hierarchical Vector Transformer method. In this article, we will complete the construction of the model. We will also train and test it on real historical data.
Creating Dynamic MQL5 Graphical Interfaces through Resource-Driven Image Scaling with Bicubic Interpolation on Trading Charts
In this article, we explore dynamic MQL5 graphical interfaces, using bicubic interpolation for high-quality image scaling on trading charts. We detail flexible positioning options, enabling dynamic centering or corner anchoring with custom offsets.

Creating a Trading Administrator Panel in MQL5 (Part III): Extending Built-in Classes for Theme Management (II)
In this discussion, we will carefully extend the existing Dialog library to incorporate theme management logic. Furthermore, we will integrate methods for theme switching into the CDialog, CEdit, and CButton classes utilized in our Admin Panel project. Continue reading for more insightful perspectives.
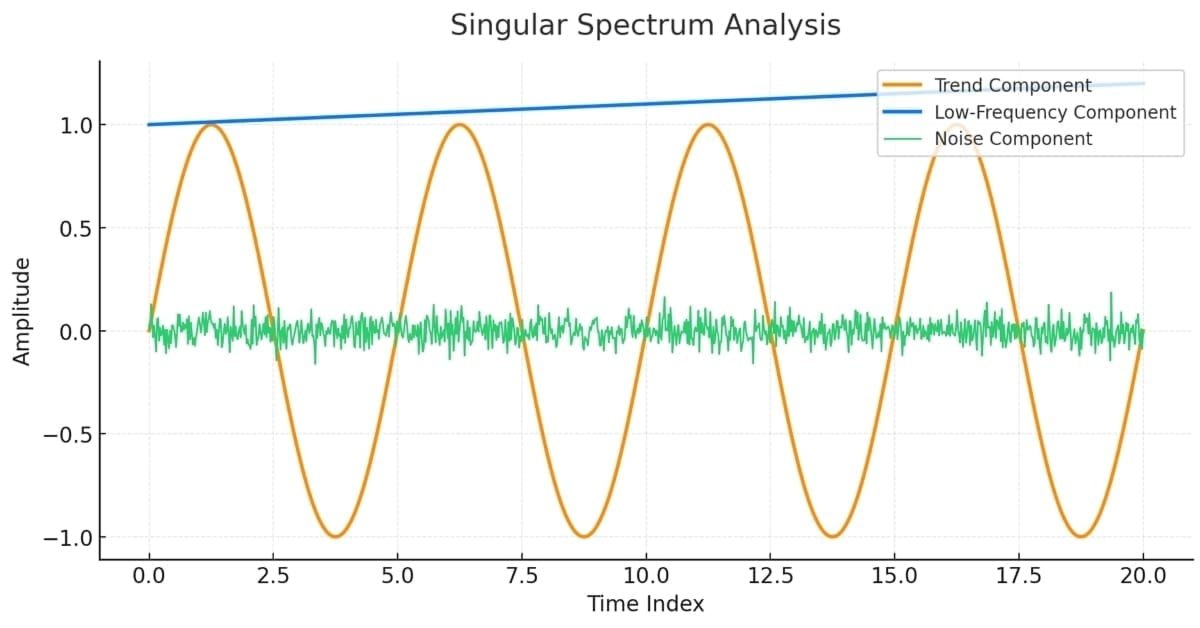
Singular Spectrum Analysis in MQL5
This article is meant as a guide for those unfamiliar with the concept of Singular Spectrum Analysis and who wish to gain enough understanding to be able to apply the built-in tools available in MQL5.

MQL5 Trading Tools (Part 26): Integrating Frequency Binning, Entropy, and Chi-Square in Visual Analyzer
In this article, we develop a frequency analysis tool in MQL5 that bins price data into histograms, computes entropy for information content, and applies chi-square tests for distribution goodness-of-fit, with interactive logs and statistical panels for market insights. We integrate per-bar or per-tick computation modes, supersampled rendering for smooth visuals, and draggable/resizable canvases with auto-scrolling logs to enhance usability in trading analysis.

Neural Networks in Trading: Contrastive Pattern Transformer (Final Part)
In the previous last article within this series, we looked at the Atom-Motif Contrastive Transformer (AMCT) framework, which uses contrastive learning to discover key patterns at all levels, from basic elements to complex structures. In this article, we continue implementing AMCT approaches using MQL5.

From Novice to Expert: Developing a Geographic Market Awareness with MQL5 Visualization
Trading without session awareness is like navigating without a compass—you're moving, but not with purpose. Today, we're revolutionizing how traders perceive market timing by transforming ordinary charts into dynamic geographical displays. Using MQL5's powerful visualization capabilities, we'll build a live world map that illuminates active trading sessions in real-time, turning abstract market hours into intuitive visual intelligence. This journey sharpens your trading psychology and reveals professional-grade programming techniques that bridge the gap between complex market structure and practical, actionable insight.

Trend Criteria. Conclusion
In this article, we will consider the specifics of applying some trend criteria in practice. We will also try to develop several new criteria. The focus will be on the efficiency of applying these criteria to market data analysis and trading.

MetaTrader 5 Machine Learning Blueprint (Part 14): Transaction Cost Modeling for Triple-Barrier Labels in MQL5
The article replaces hardcoded cost assumptions in triple-barrier labeling with measured inputs. An MQL5 script captures spread distribution, swap rates, and symbol metadata from your broker, and a Python model converts them into a broker-calibrated min ret you can pass to get events. Labels then reflect the actual round-trip friction for your instrument and holding period.

Post-Factum trading analysis: Selecting trailing stops and new stop levels in the strategy tester
We continue the topic of analyzing completed deals in the strategy tester to improve the quality of trading. Let's see how using different trailing stops can change our existing trading results.

From Novice to Expert: Animated News Headline Using MQL5 (I)
News accessibility is a critical factor when trading on the MetaTrader 5 terminal. While numerous news APIs are available, many traders face challenges in accessing and integrating them effectively into their trading environment. In this discussion, we aim to develop a streamlined solution that brings news directly onto the chart—where it’s most needed. We'll accomplish this by building a News Headline Expert Advisor that monitors and displays real-time news updates from API sources.

Developing A Swing Entries Monitoring (EA)
As the year approaches its end, long-term traders often reflect on market history to analyze its behavior and trends, aiming to project potential future movements. In this article, we will explore the development of a long-term entry monitoring Expert Advisor (EA) using MQL5. The objective is to address the challenge of missed long-term trading opportunities caused by manual trading and the absence of automated monitoring systems. We'll use one of the most prominently traded pairs as an example to strategize and develop our solution effectively.

From Novice to Expert: Animated News Headline Using MQL5 (VIII) — Quick Trade Buttons for News Trading
While algorithmic trading systems manage automated operations, many news traders and scalpers prefer active control during high-impact news events and fast-paced market conditions, requiring rapid order execution and management. This underscores the need for intuitive front-end tools that integrate real-time news feeds, economic calendar data, indicator insights, AI-driven analytics, and responsive trading controls.

Trading with the MQL5 Economic Calendar (Part 3): Adding Currency, Importance, and Time Filters
In this article, we implement filters in the MQL5 Economic Calendar dashboard to refine news event displays by currency, importance, and time. We first establish filter criteria for each category and then integrate these into the dashboard to display only relevant events. Finally, we ensure each filter dynamically updates to provide traders with focused, real-time economic insights.

From Novice to Expert: Animated News Headline Using MQL5 (IV) — Locally hosted AI model market insights
In today's discussion, we explore how to self-host open-source AI models and use them to generate market insights. This forms part of our ongoing effort to expand the News Headline EA, introducing an AI Insights Lane that transforms it into a multi-integration assistive tool. The upgraded EA aims to keep traders informed through calendar events, financial breaking news, technical indicators, and now AI-generated market perspectives—offering timely, diverse, and intelligent support to trading decisions. Join the conversation as we explore practical integration strategies and how MQL5 can collaborate with external resources to build a powerful and intelligent trading work terminal.

Creating a Trading Administrator Panel in MQL5 (Part IX): Code Organization (V): AnalyticsPanel Class
In this discussion, we explore how to retrieve real-time market data and trading account information, perform various calculations, and display the results on a custom panel. To achieve this, we will dive deeper into developing an AnalyticsPanel class that encapsulates all these features, including panel creation. This effort is part of our ongoing expansion of the New Admin Panel EA, introducing advanced functionalities using modular design principles and best practices for code organization.

Price Action Analysis Toolkit Development (Part 9): External Flow
This article explores a new dimension of analysis using external libraries specifically designed for advanced analytics. These libraries, like pandas, provide powerful tools for processing and interpreting complex data, enabling traders to gain more profound insights into market dynamics. By integrating such technologies, we can bridge the gap between raw data and actionable strategies. Join us as we lay the foundation for this innovative approach and unlock the potential of combining technology with trading expertise.

Creating a Trading Administrator Panel in MQL5 (Part VI): Multiple Functions Interface (I)
The Trading Administrator's role goes beyond just Telegram communications; they can also engage in various control activities, including order management, position tracking, and interface customization. In this article, we’ll share practical insights on expanding our program to support multiple functionalities in MQL5. This update aims to overcome the current Admin Panel's limitation of focusing primarily on communication, enabling it to handle a broader range of tasks.

Creating a Trading Administrator Panel in MQL5 (Part IX): Code Organization (I)
This discussion delves into the challenges encountered when working with large codebases. We will explore the best practices for code organization in MQL5 and implement a practical approach to enhance the readability and scalability of our Trading Administrator Panel source code. Additionally, we aim to develop reusable code components that can potentially benefit other developers in their algorithm development. Read on and join the conversation.

Neural networks made easy (Part 65): Distance Weighted Supervised Learning (DWSL)
In this article, we will get acquainted with an interesting algorithm that is built at the intersection of supervised and reinforcement learning methods.

MQL5 Trading Tools (Part 12): Enhancing the Correlation Matrix Dashboard with Interactivity
In this article, we enhance the correlation matrix dashboard in MQL5 with interactive features like panel dragging, minimizing/maximizing, hover effects on buttons and timeframes, and mouse event handling for improved user experience. We add sorting of symbols by average correlation strength in ascending/descending modes, toggle between correlation and p-value views, and incorporate light/dark theme switching with dynamic color updates.

Creating a Trading Administrator Panel in MQL5 (Part IX): Code Organization (II): Modularization
In this discussion, we take a step further in breaking down our MQL5 program into smaller, more manageable modules. These modular components will then be integrated into the main program, enhancing its organization and maintainability. This approach simplifies the structure of our main program and makes the individual components reusable in other Expert Advisors (EAs) and indicator developments. By adopting this modular design, we create a solid foundation for future enhancements, benefiting both our project and the broader developer community.

Creating a Trading Administrator Panel in MQL5 (Part IX): Code Organization (III): Communication Module
Join us for an in-depth discussion on the latest advancements in MQL5 interface design as we unveil the redesigned Communications Panel and continue our series on building the New Admin Panel using modularization principles. We'll develop the CommunicationsDialog class step by step, thoroughly explaining how to inherit it from the Dialog class. Additionally, we'll leverage arrays and ListView class in our development. Gain actionable insights to elevate your MQL5 development skills—read through the article and join the discussion in the comments section!
Visualizing Strategies in MQL5: Laying Out Optimization Results Across Criterion Charts
In this article, we write an example of visualizing the optimization process and display the top three passes for the four optimization criteria. We will also provide an opportunity to select one of the three best passes for displaying its data in tables and on a chart.
Creating Dynamic MQL5 Graphical Interfaces through Resource-Driven Image Scaling with Bicubic Interpolation on Trading Charts
In this article, we explore dynamic MQL5 graphical interfaces, using bicubic interpolation for high-quality image scaling on trading charts. We detail flexible positioning options, enabling dynamic centering or corner anchoring with custom offsets.
Creating a Trading Administrator Panel in MQL5 (Part III): Extending Built-in Classes for Theme Management (II)
In this discussion, we will carefully extend the existing Dialog library to incorporate theme management logic. Furthermore, we will integrate methods for theme switching into the CDialog, CEdit, and CButton classes utilized in our Admin Panel project. Continue reading for more insightful perspectives.
From Novice to Expert: Developing a Geographic Market Awareness with MQL5 Visualization
Trading without session awareness is like navigating without a compass—you're moving, but not with purpose. Today, we're revolutionizing how traders perceive market timing by transforming ordinary charts into dynamic geographical displays. Using MQL5's powerful visualization capabilities, we'll build a live world map that illuminates active trading sessions in real-time, turning abstract market hours into intuitive visual intelligence. This journey sharpens your trading psychology and reveals professional-grade programming techniques that bridge the gap between complex market structure and practical, actionable insight.
MetaTrader 5 Machine Learning Blueprint (Part 14): Transaction Cost Modeling for Triple-Barrier Labels in MQL5
The article replaces hardcoded cost assumptions in triple-barrier labeling with measured inputs. An MQL5 script captures spread distribution, swap rates, and symbol metadata from your broker, and a Python model converts them into a broker-calibrated min ret you can pass to get events. Labels then reflect the actual round-trip friction for your instrument and holding period.

From Novice to Expert: Animated News Headline Using MQL5 (XI)—Correlation in News Trading
In this discussion, we will explore how the concept of Financial Correlation can be applied to improve decision-making efficiency when trading multiple symbols during major economic events announcement. The focus is on addressing the challenge of heightened risk exposure caused by increased volatility during news releases.

Neural networks made easy (Part 79): Feature Aggregated Queries (FAQ) in the context of state
In the previous article, we got acquainted with one of the methods for detecting objects in an image. However, processing a static image is somewhat different from working with dynamic time series, such as the dynamics of the prices we analyze. In this article, we will consider the method of detecting objects in video, which is somewhat closer to the problem we are solving.

Optimizing Liquidity Raids: Mastering the Difference Between Liquidity Raids and Market Structure Shifts
This is an article about a specialized trend-following EA that aims to clearly elaborate how to utilize trading setups after liquidity raids. This article will explore in detail an EA that is specifically designed for traders who are keen on optimizing and utilizing liquidity raids and purges as entry criteria for their trades and trading decisions. It will also explore how to correctly differentiate between liquidity raids and market structure shifts and how to validate and utilize each of them when they occur, thus trying to mitigate losses that occur from traders confusing the two.

Neural Networks Made Easy (Part 81): Context-Guided Motion Analysis (CCMR)
In previous works, we always assessed the current state of the environment. At the same time, the dynamics of changes in indicators always remained "behind the scenes". In this article I want to introduce you to an algorithm that allows you to evaluate the direct change in data between 2 successive environmental states.

MQL5 Trading Tools (Part 22): Graphing the Histogram and Probability Mass Function (PMF) of the Binomial Distribution
This article develops an interactive MQL5 plot for the binomial distribution, combining a histogram of simulated outcomes with the theoretical probability mass function. It implements mean, standard deviation, skewness, kurtosis, percentiles, and confidence intervals, along with configurable themes and labels, and supports dragging, resizing, and live parameter changes. Use it to assess expected wins, likely drawdowns, and confidence ranges when validating trading strategies.

Neural Networks in Trading: Adaptive Detection of Market Anomalies (Final Part)
We continue to build the algorithms that form the basis of the DADA framework, which is an advanced tool for detecting anomalies in time series. This approach enables effective distinguishing random fluctuations from significant deviations. Unlike classical methods, DADA dynamically adapts to different data types, choosing the optimal compression level in each specific case.
MQL5 Trading Tools (Part 22): Graphing the Histogram and Probability Mass Function (PMF) of the Binomial Distribution
This article develops an interactive MQL5 plot for the binomial distribution, combining a histogram of simulated outcomes with the theoretical probability mass function. It implements mean, standard deviation, skewness, kurtosis, percentiles, and confidence intervals, along with configurable themes and labels, and supports dragging, resizing, and live parameter changes. Use it to assess expected wins, likely drawdowns, and confidence ranges when validating trading strategies.

Creating a Custom Tick Chart in MQL5
Learn how to implement a tick-based chart in MQL5 where each bar is built from a fixed number of ticks instead of time. The article covers creating and configuring a custom symbol, capturing real-time ticks, forming OHLC values, and pushing data with CustomRatesUpdate. This approach produces activity-driven candles that better reflect market intensity and short-term momentum for precise intraday analysis.

MQL5 Trading Tools (Part 23): Camera-Controlled, DirectX-Enabled 3D Graphs for Distribution Insights
In this article, we advance the binomial distribution graphing tool in MQL5 by integrating DirectX for 3D visualization, enabling switchable 2D/3D modes with camera-controlled rotation, zoom, and auto-fitting for immersive analysis. We render 3D histogram bars, ground planes, and axes alongside the theoretical probability mass function curve, while preserving 2D elements like statistics panels, legends, and customizable themes, gradients, and labels