
MQL5 自动化交易策略(第二十五部分):基于最小二乘法拟合的趋势线交易 EA 与动态信号生成
 269
269
 0
0

引言
上一篇文章(第 24 篇)中,我们基于 MQL5 语言开发了伦敦时段突破交易系统,依托伦敦盘前区间挂单,配套风控与移动止损功能,实现分时区间自动化交易。本篇第 25 讲,我们将编写趋势线自动交易程序,使用最小二乘法算法识别支撑、阻力趋势线;当价格触碰趋势线时自动生成买卖信号,同时搭配箭头可视化标记、可自定义交易参数等辅助功能。本文将包括几个方面:
阅读完本文,你将得到一套可自定义、功能完善的趋势交易 MQL5 策略,下面正式开始讲解。
趋势线交易框架搭建
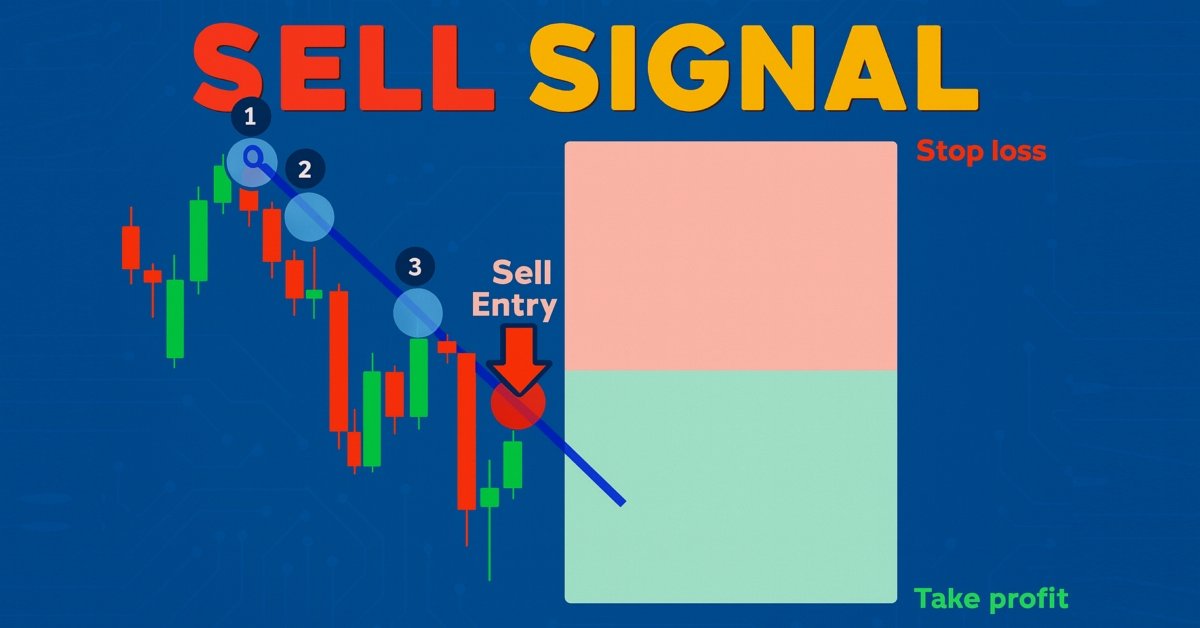
趋势线交易策略是在价格图表绘制斜线,连接波段高点(阻力)与波段低点(支撑),以此判断市场主流趋势。交易者在上升趋势的上行支撑趋势线附近做多,在下降趋势的下行阻力趋势线附近做空,预期价格触线反弹。一旦趋势线被有效突破,往往代表行情反转或原有趋势走弱,交易者会选择平仓或反向开仓。下图为下降趋势线示意图:
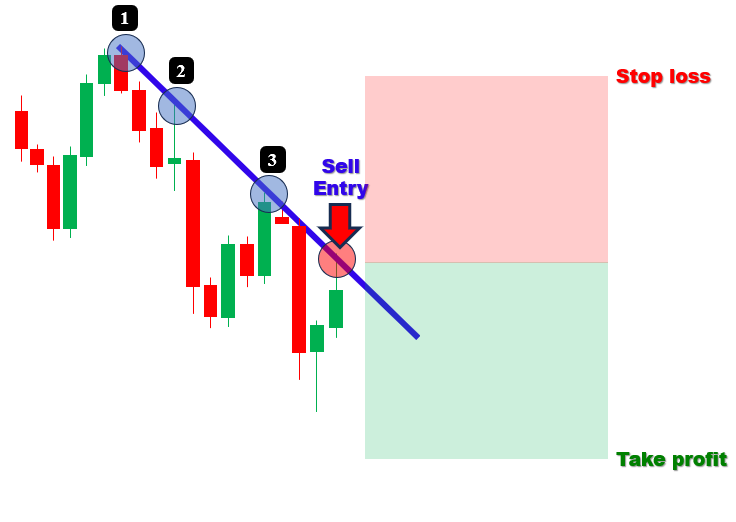
我们将开发全自动趋势线交易程序,通过最小二乘法算法识别支撑、阻力趋势线,价格触碰线条时精准生成多空交易信号。
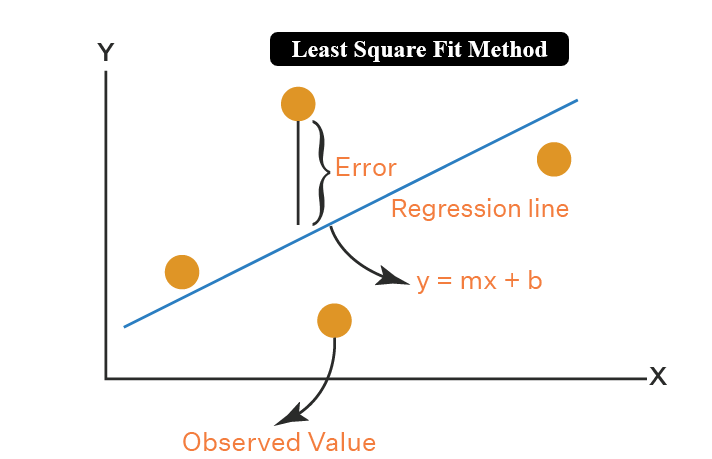
最小二乘法是一种统计学算法,通过最小化数据点与拟合直线之间纵向误差的平方和,求解最贴合一组离散数据的直线 / 曲线。该算法对本项目至关重要:它能对波段高低点做最优线性拟合,为趋势预判、行情分析、价格建模提供精准数学依据。下文为最小二乘法原理示意图。
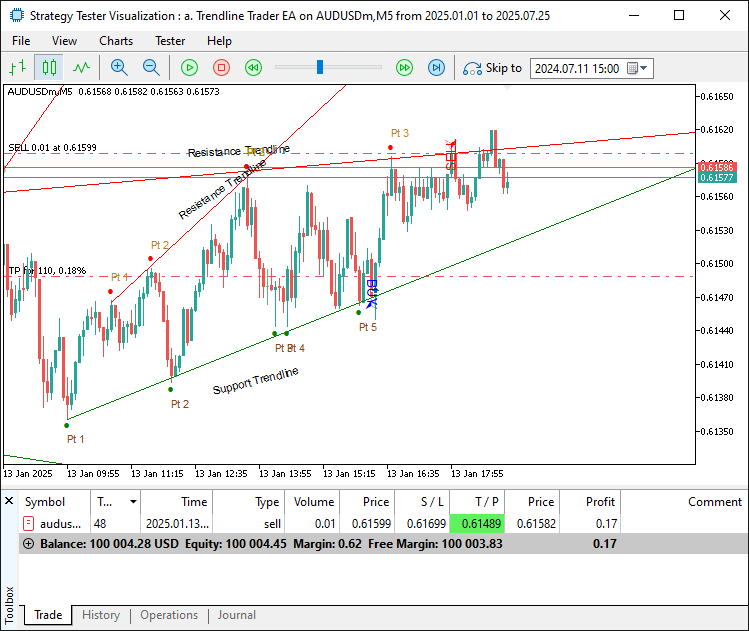
我们将数学趋势识别逻辑、图表可视化反馈、可自定义交易参数三者结合,在波动行情中高效捕捉趋势反弹交易机会。整体实现逻辑:识别波段拐点 → 最小二乘法拟合趋势线(最少 3 次价格触碰才判定有效趋势)→ 校验趋势有效性 → 带风控触发交易,同时在图表绘制趋势线与触碰点位,直观展示信号。下文为程序预期实现效果图,之后进入代码实现环节。
在MQL5中的实现
要在 MQL5 中创建程序,请打开MetaEditor,转到“导航器”窗口,找到“指标”文件夹,点击“新建”选项卡,然后按照提示创建文件。进入编程环节后,我们首先会定义一批输入参数与结构体,让整个交易程序更灵活、更具动态适配能力。//+------------------------------------------------------------------+ //| a. Trendline Trader EA.mq5 | //| Copyright 2025, Allan Munene Mutiiria. | //| https://t.me/Forex_Algo_Trader | //+------------------------------------------------------------------+ #property copyright "Copyright 2025, Allan Munene Mutiiria." #property link "https://t.me/Forex_Algo_Trader" #property description "Trendline Trader using mean Least Squares Fit" #property version "1.00" #property strict #include <Trade\Trade.mqh> //--- Include Trade library for trading operations CTrade obj_Trade; //--- Instantiate trade object //+------------------------------------------------------------------+ //| Swing point structure | //+------------------------------------------------------------------+ struct Swing { //--- Define swing point structure datetime time; //--- Store swing time double price; //--- Store swing price }; //+------------------------------------------------------------------+ //| Starting point structure | //+------------------------------------------------------------------+ struct StartingPoint { //--- Define starting point structure datetime time; //--- Store starting point time double price; //--- Store starting point price bool is_support; //--- Indicate support/resistance flag }; //+------------------------------------------------------------------+ //| Trendline storage structure | //+------------------------------------------------------------------+ struct TrendlineInfo { //--- Define trendline info structure string name; //--- Store trendline name datetime start_time; //--- Store start time datetime end_time; //--- Store end time double start_price; //--- Store start price double end_price; //--- Store end price double slope; //--- Store slope bool is_support; //--- Indicate support/resistance flag int touch_count; //--- Store number of touches datetime creation_time; //--- Store creation time int touch_indices[]; //--- Store touch indices array bool is_signaled; //--- Indicate signal flag }; //+------------------------------------------------------------------+ //| Forward declarations | //+------------------------------------------------------------------+ void DetectSwings(); //--- Declare swing detection function void SortSwings(Swing &swings[], int count); //--- Declare swing sorting function double CalculateAngle(datetime time1, double price1, datetime time2, double price2); //--- Declare angle calculation function bool ValidateTrendline(bool isSupport, datetime start_time, datetime ref_time, double ref_price, double slope, double tolerance_pen); //--- Declare trendline validation function void FindAndDrawTrendlines(bool isSupport); //--- Declare trendline finding/drawing function void UpdateTrendlines(); //--- Declare trendline update function void RemoveTrendlineFromStorage(int index); //--- Declare trendline removal function bool IsStartingPointUsed(datetime time, double price, bool is_support); //--- Declare starting point usage check function void LeastSquaresFit(const datetime ×[], const double &prices[], int n, double &slope, double &intercept); //--- Declare least squares fit function //+------------------------------------------------------------------+ //| Inputs | //+------------------------------------------------------------------+ input int LookbackBars = 200; // Set bars for swing detection lookback input double TouchTolerance = 10.0; // Set tolerance for touch points (points) input int MinTouches = 3; // Set minimum touch points for valid trendline input double PenetrationTolerance = 5.0; // Set allowance for bar penetration (points) input int ExtensionBars = 100; // Set bars to extend trendline right input int MinBarSpacing = 10; // Set minimum bar spacing between touches input double inpLot = 0.01; // Set lot size input double inpSLPoints = 100.0; // Set stop loss (points) input double inpRRRatio = 1.1; // Set risk:reward ratio input double MinAngle = 1.0; // Set minimum inclination angle (degrees) input double MaxAngle = 89.0; // Set maximum inclination angle (degrees) input bool DeleteExpiredObjects = false; // Enable deletion of expired/broken objects input bool EnableTradingSignals = true; // Enable buy/sell signals and trades input bool DrawTouchArrows = true; // Enable drawing arrows at touch points input bool DrawLabels = true; // Enable drawing trendline/point labels input color SupportLineColor = clrGreen; // Set color for support trendlines input color ResistanceLineColor = clrRed; // Set color for resistance trendlines //+------------------------------------------------------------------+ //| Global variables | //+------------------------------------------------------------------+ Swing swingLows[]; //--- Store swing lows int numLows = 0; //--- Track number of swing lows Swing swingHighs[]; //--- Store swing highs int numHighs = 0; //--- Track number of swing highs TrendlineInfo trendlines[]; //--- Store trendlines int numTrendlines = 0; //--- Track number of trendlines StartingPoint startingPoints[]; //--- Store used starting points int numStartingPoints = 0; //--- Track number of starting points
我们首先搭建程序核心组件,实现价格触碰趋势线的自动化交易逻辑。首先引入库文件 <Trade\Trade.mqh>,并实例化 obj_Trade 作为 CTrade 对象,用于管理多单、空单等各类下单操作。随后定义三种结构体:结构体 Swing,包含时间 time(datetime 类型)与价格 price(double 类型),用于存储波段拐点;结构体 StartingPoint,包含时间 time(datetime 类型)、价格 price(double 类型)以及布尔标识 is_support,用于记录已占用的支撑 / 阻力起点;结构体 TrendlineInfo,包含名称 name(string 类型)、起点时间 start_time、终点时间 end_time(datetime 类型)、起点价格 start_price、终点价格 end_price(double 类型)、斜率 slope(double 类型)、支撑标识 is_support(bool 类型)、触碰计数 touch_count(int 类型)、创建时间 creation_time(datetime 类型)、触碰索引数组 touch_indices(int 数组)以及信号标记 is_signaled(bool 类型),用于完整保存趋势线各项信息。
接下来我们对核心功能函数进行前向声明:DetectSwings 用于识别波段拐点;SortSwings 用于对波段拐点排序;CalculateAngle 用于计算趋势线倾斜角度;ValidateTrendline 校验趋势线有效性;FindAndDrawTrendlines 生成并在图表绘制趋势线;UpdateTrendlines 实时更新趋势线;RemoveTrendlineFromStorage 清理存储中的趋势线数据;IsStartingPointUsed 判断拐点是否已被占用;LeastSquaresFit 通过最小二乘法计算趋势线斜率与截距。
随后配置输入参数与全局变量:输入参数包含:LookbackBars(回溯 K 线数量,200 根),用于波段拐点识别区间;TouchTolerance(触碰容差,10.0 点),控制价格触线判定精度;MinTouches(最少触碰次数,3 次),作为趋势线有效判定标准;其余参数含义直观易懂。全局变量包含:存储波段低点的 swingLows 数组、波段高点数组 swingHighs,配套计数变量 numLows、numHighs(初始值 0);存储趋势线信息的 trendlines 数组、起点数组 startingPoints,配套计数变量 numTrendlines、numStartingPoints(初始值 0)。这套结构化框架搭建完成,为 EA 自动识别趋势线并实现趋势交易奠定基础。基础框架就绪后,我们在初始化函数中完成存储数组初始化。
//+------------------------------------------------------------------+
//| Expert initialization function                                   |
//+------------------------------------------------------------------+
int OnInit() {
   ArrayResize(trendlines, 0);                     //--- Resize trendlines array
   numTrendlines = 0;                              //--- Reset trendlines count
   ArrayResize(startingPoints, 0);                 //--- Resize starting points array
   numStartingPoints = 0;                          //--- Reset starting points count
   return(INIT_SUCCEEDED);                         //--- Return success
}

//+------------------------------------------------------------------+
//| Expert deinitialization function                                 |
//+------------------------------------------------------------------+
void OnDeinit(const int reason) {
   ArrayResize(trendlines, 0);                     //--- Resize trendlines array
   numTrendlines = 0;                              //--- Reset trendlines count
   ArrayResize(startingPoints, 0);                 //--- Resize starting points array
   numStartingPoints = 0;                          //--- Reset starting points count
}
为保证资源正常初始化与释放,在 OnInit 事件处理函数中执行如下操作: 调用 ArrayResize 将趋势线数组 trendlines 尺寸置零,numTrendlines 赋值为 0,清空历史趋势线数据;再将起点数组 startingPoints 尺寸置零,numStartingPoints 置零,重置所有起点记录;最后返回 INIT_SUCCEEDED,确认初始化流程顺利完成。
在 OnDeinit 函数中执行同样的清理逻辑,防止程序卸载时产生内存泄漏,保障 EA 运行环境干净、资源管理规范。初始化流程完成,接下来开始定义策略核心逻辑。为实现代码模块化,我们将功能拆分为独立函数。首先实现波段拐点识别逻辑,以此作为构建趋势线的基础点位。
//+------------------------------------------------------------------+
//| Check for new bar                                                |
//+------------------------------------------------------------------+
bool IsNewBar() {
   static datetime lastTime = 0;                      //--- Store last bar time
   datetime currentTime = iTime(_Symbol, _Period, 0); //--- Get current bar time
   if (lastTime != currentTime) {                     //--- Check for new bar
      lastTime = currentTime;                         //--- Update last time
      return true;                                    //--- Indicate new bar
   }
   return false;                                      //--- Indicate no new bar
}

//+------------------------------------------------------------------+
//| Sort swings by time (ascending, oldest first)                    |
//+------------------------------------------------------------------+
void SortSwings(Swing &swings[], int count) {
   for (int i = 0; i < count - 1; i++) {               //--- Iterate through swings
      for (int j = 0; j < count - i - 1; j++) {        //--- Compare adjacent swings
         if (swings[j].time > swings[j + 1].time) {    //--- Check time order
            Swing temp = swings[j];                    //--- Store temporary swing
            swings[j] = swings[j + 1];                 //--- Swap swings
            swings[j + 1] = temp;                      //--- Complete swap
         }
      }
   }
}

//+------------------------------------------------------------------+
//| Detect swing highs and lows                                      |
//+------------------------------------------------------------------+
void DetectSwings() {
   numLows = 0;                                         //--- Reset lows count
   ArrayResize(swingLows, 0);                           //--- Resize lows array
   numHighs = 0;                                        //--- Reset highs count
   ArrayResize(swingHighs, 0);                          //--- Resize highs array
   int totalBars = iBars(_Symbol, _Period);             //--- Get total bars
   int effectiveLookback = MathMin(LookbackBars, totalBars); //--- Calculate effective lookback
   if (effectiveLookback < 5) {                         //--- Check sufficient bars
      Print("Not enough bars for swing detection.");    //--- Log insufficient bars
      return;                                           //--- Exit function
   }
   for (int i = 2; i < effectiveLookback - 2; i++) {    //--- Iterate through bars
      double low_i = iLow(_Symbol, _Period, i);         //--- Get current low
      double low_im1 = iLow(_Symbol, _Period, i - 1);   //--- Get previous low
      double low_im2 = iLow(_Symbol, _Period, i - 2);   //--- Get two bars prior low
      double low_ip1 = iLow(_Symbol, _Period, i + 1);   //--- Get next low
      double low_ip2 = iLow(_Symbol, _Period, i + 2);   //--- Get two bars next low
      if (low_i < low_im1 && low_i < low_im2 && low_i < low_ip1 && low_i < low_ip2) { //--- Check for swing low
         Swing s;                                       //--- Create swing struct
         s.time = iTime(_Symbol, _Period, i);           //--- Set swing time
         s.price = low_i;                               //--- Set swing price
         ArrayResize(swingLows, numLows + 1);           //--- Resize lows array
         swingLows[numLows] = s;                        //--- Add swing low
         numLows++;                                     //--- Increment lows count
      }
      double high_i = iHigh(_Symbol, _Period, i);       //--- Get current high
      double high_im1 = iHigh(_Symbol, _Period, i - 1); //--- Get previous high
      double high_im2 = iHigh(_Symbol, _Period, i - 2); //--- Get two bars prior high
      double high_ip1 = iHigh(_Symbol, _Period, i + 1); //--- Get next high
      double high_ip2 = iHigh(_Symbol, _Period, i + 2); //--- Get two bars next high
      if (high_i > high_im1 && high_i > high_im2 && high_i > high_ip1 && high_i > high_ip2) { //--- Check for swing high
         Swing s;                                       //--- Create swing struct
         s.time = iTime(_Symbol, _Period, i);           //--- Set swing time
         s.price = high_i;                              //--- Set swing price
         ArrayResize(swingHighs, numHighs + 1);         //--- Resize highs array
         swingHighs[numHighs] = s;                      //--- Add swing high
         numHighs++;                                    //--- Increment highs count
      }
   }
   if (numLows > 0) SortSwings(swingLows, numLows);     //--- Sort swing lows
   if (numHighs > 0) SortSwings(swingHighs, numHighs);  //--- Sort swing highs
}
本节我们实现用于 K 线检测与波段拐点识别的核心函数,为趋势线分析打下基础。首先创建 IsNewBar 函数:该函数静态变量 lastTime 初始值为 0,读取当前品种、当前周期偏移 0 根 K 线的 iTime 得到 currentTime,以此判断是否生成新 K 线;若两者数值不一致则更新 lastTime,函数返回 true 代表新 K 线,否则返回 false。接下来实现 SortSwings 函数:采用冒泡排序算法,将 swings 数组按照 time 升序排列(时间更早的数据在前)。循环遍历 count - 1 个元素,当相邻两个 Swing 结构体时间顺序错乱时,借助临时变量 temp 交换两者位置。
最后实现 DetectSwings 函数:先将 numLows、numHighs 置零,并把 swingLows、swingHighs 数组尺寸重置为 0;将 effectiveLookback 取值为 LookbackBars 与 iBars 获取的总 K 线数量两者中的较小值;若可用 K 线不足 5 根,打印日志并直接退出函数。程序循环遍历第 2 根至 effectiveLookback - 2 根 K 线,对比 iLow、iHigh 与前后两根 K 线价格,识别波段低点与波段高点;利用 iTime 获取时间、iLow 或 iHigh 获取价格,构造 Swing 结构体;通过 ArrayResize 将拐点存入 swingLows 或 swingHighs 数组并递增计数;数组不为空时调用 SortSwings 完成排序。以上函数保障程序及时识别波段拐点,从而精准构建趋势线。接下来我们定义函数,用于计算趋势线倾斜角度,实现角度限制规则以及趋势线有效性校验逻辑。
//+------------------------------------------------------------------+
//| Calculate visual inclination angle                               |
//+------------------------------------------------------------------+
double CalculateAngle(datetime time1, double price1, datetime time2, double price2) {
   int x1, y1, x2, y2;                                               //--- Declare coordinate variables
   if (!ChartTimePriceToXY(0, 0, time1, price1, x1, y1)) return 0.0; //--- Convert time1/price1 to XY
   if (!ChartTimePriceToXY(0, 0, time2, price2, x2, y2)) return 0.0; //--- Convert time2/price2 to XY
   double dx = (double)(x2 - x1);                                    //--- Calculate x difference
   double dy = (double)(y2 - y1);                                    //--- Calculate y difference
   if (dx == 0.0) return (dy > 0.0 ? -90.0 : 90.0);                  //--- Handle vertical line case
   double angle = MathArctan(-dy / dx) * 180.0 / M_PI;               //--- Calculate angle in degrees
   return angle;                                                     //--- Return angle
}

//+------------------------------------------------------------------+
//| Validate trendline                                               |
//+------------------------------------------------------------------+
bool ValidateTrendline(bool isSupport, datetime start_time, datetime ref_time, double ref_price, double slope, double tolerance_pen) {
   int bar_start = iBarShift(_Symbol, _Period, start_time);          //--- Get start bar index
   if (bar_start < 0) return false;                                  //--- Check invalid bar index
   for (int bar = bar_start; bar >= 0; bar--) {                      //--- Iterate through bars
      datetime bar_time = iTime(_Symbol, _Period, bar);              //--- Get bar time
      double dk = (double)(bar_time - ref_time);                     //--- Calculate time difference
      double line_price = ref_price + slope * dk;                    //--- Calculate line price
      if (isSupport) {                                               //--- Check support case
         double low = iLow(_Symbol, _Period, bar);                   //--- Get bar low
         if (low < line_price - tolerance_pen) return false;         //--- Check if broken
      } else {                                                       //--- Handle resistance case
         double high = iHigh(_Symbol, _Period, bar);                 //--- Get bar high
         if (high > line_price + tolerance_pen) return false;        //--- Check if broken
      }
   }
   return true;                                                      //--- Return valid
}
接下来我们实现关键函数,用于计算趋势线角度并校验趋势线有效性,保障趋势线识别稳定可靠。首先创建 CalculateAngle 函数:通过 ChartTimePriceToXY 将两个坐标点(time1,price1 与 time2,price2)转换为图表像素坐标 x1、y1、x2、y2;转换失败则直接返回 0.0。随后计算横坐标差值 dx、纵坐标差值 dy;若 dx 等于 0 代表垂直线,返回 -90.0 或 90.0;再通过公式 MathArctan(-dy / dx) * 180.0 / M_PI 计算角度数值,用于直观判定趋势线倾斜方向。
接下来实现 ValidateTrendline 函数:调用 iBarShift 根据 start_time 获取起始 K 线索引,索引无效则返回 false;循环遍历从 bar_start 到 0 的所有 K 线,以参考时间、参考价格、斜率 dk(时间差值)计算对应 K 线时间位置上的趋势线价格 ref_price + slope * dk。对于支撑趋势线(isSupport 为 true),检测 K 线 iLow 是否跌破 line_price - tolerance_pen,一旦跌破直接返回 false;对于阻力趋势线,检测 K 线 iHigh 是否上穿 line_price + tolerance_pen,上穿则返回 false;若全程没有被突破,函数返回 true。现在我们着手实现 least squares fit 最小二乘拟合逻辑。代码逻辑保持简洁易懂。
//+------------------------------------------------------------------+ //| Perform least-squares fit for slope and intercept | //+------------------------------------------------------------------+ void LeastSquaresFit(const datetime ×[], const double &prices[], int n, double &slope, double &intercept) { double sum_x = 0, sum_y = 0, sum_xy = 0, sum_x2 = 0; //--- Initialize sums for (int k = 0; k < n; k++) { //--- Iterate through points double x = (double)times[k]; //--- Convert time to x double y = prices[k]; //--- Set price as y sum_x += x; //--- Accumulate x sum_y += y; //--- Accumulate y sum_xy += x * y; //--- Accumulate x*y sum_x2 += x * x; //--- Accumulate x^2 } slope = (n * sum_xy - sum_x * sum_y) / (n * sum_x2 - sum_x * sum_x); //--- Calculate slope intercept = (sum_y - slope * sum_x) / n; //--- Calculate intercept }
我们实现 LeastSquaresFit 函数,求解趋势线最优斜率与截距,实现精准趋势线拟合。首先初始化累加变量 sum_x、sum_y、sum_xy、sum_x2 为 0,用于最小二乘运算。然后遍历 times、prices 数组内共 n 个点位,每个 times[k] 强制转换为 double 作为 x,并将 prices[k] 作为 y;依次累加 x 至 sum_x、y 至 sum_y、x * y 至 sum_xy、x * x 至 sum_x2。最后套用公式计算斜率:(n * sum_xy - sum_x * sum_y) / (n * sum_x2 - sum_x * sum_x),截距计算公式:(sum_y - slope * sum_x) / n,基于输入点位输出最优拟合直线。如果你想了解公式原理,可以参考下方示意图。
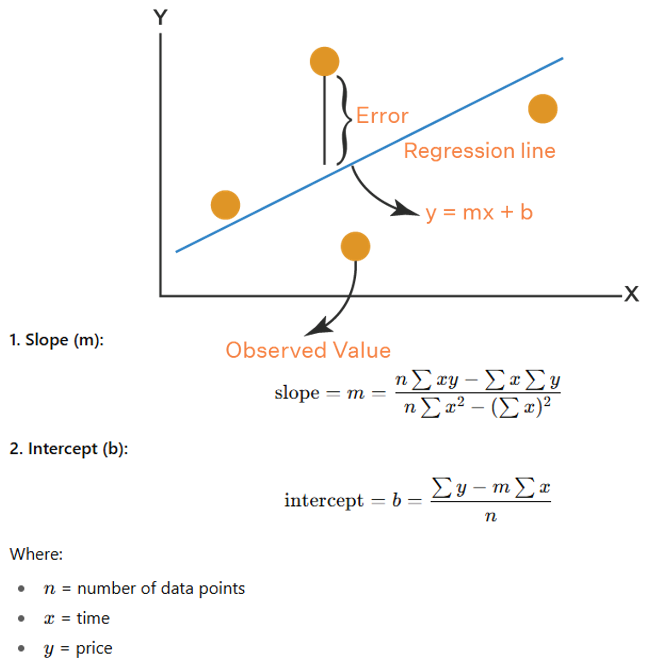
这套算法保证趋势线位置在数学层面精准可靠,以此生成可信交易信号。接下来我们定义用于管理趋势线的工具函数。
//+------------------------------------------------------------------+
//| Check if starting point is already used                          |
//+------------------------------------------------------------------+
bool IsStartingPointUsed(datetime time, double price, bool is_support) {
   for (int i = 0; i < numStartingPoints; i++) {  //--- Iterate through starting points
      if (startingPoints[i].time == time && MathAbs(startingPoints[i].price - price) < TouchTolerance * _Point && startingPoints[i].is_support == is_support) { //--- Check match
         return true;                             //--- Return used
      }
   }
   return false;                                   //--- Return not used
}

//+------------------------------------------------------------------+
//| Remove trendline from storage and optionally chart objects       |
//+------------------------------------------------------------------+
void RemoveTrendlineFromStorage(int index) {
   if (index < 0 || index >= numTrendlines) return;                    //--- Check valid index
   Print("Removing trendline from storage: ", trendlines[index].name); //--- Log removal
   if (DeleteExpiredObjects) {                                         //--- Check deletion flag
      ObjectDelete(0, trendlines[index].name);                         //--- Delete trendline object
      for (int m = 0; m < trendlines[index].touch_count; m++) {        //--- Iterate touches
         string arrow_name = trendlines[index].name + "_touch" + IntegerToString(m); //--- Generate arrow name
         ObjectDelete(0, arrow_name);                                  //--- Delete touch arrow
         string text_name = trendlines[index].name + "_point_label" + IntegerToString(m); //--- Generate text name
         ObjectDelete(0, text_name);                                   //--- Delete point label
      }
      string label_name = trendlines[index].name + "_label";           //--- Generate label name
      ObjectDelete(0, label_name);                                     //--- Delete trendline label
      string signal_arrow = trendlines[index].name + "_signal_arrow";  //--- Generate signal arrow name
      ObjectDelete(0, signal_arrow);                                   //--- Delete signal arrow
      string signal_text = trendlines[index].name + "_signal_text";    //--- Generate signal text name
      ObjectDelete(0, signal_text);                                    //--- Delete signal text
   }
   for (int i = index; i < numTrendlines - 1; i++) {                   //--- Shift array
      trendlines[i] = trendlines[i + 1];                               //--- Copy next trendline
   }
   ArrayResize(trendlines, numTrendlines - 1);                         //--- Resize trendlines array
   numTrendlines--;                                                    //--- Decrement trendlines count
}
我们接下来实现工具函数,用于管理趋势线起点与资源清理工作,保障趋势线追踪和图表对象管理高效运行。首先创建 IsStartingPointUsed 函数:遍历 startingPoints 数组内共 numStartingPoints 个起点,校验给定的 time、price、is_support 是否与已有起点匹配。精确比对时间;借助 MathAbs 判断价格差值小于 TouchTolerance * _Point,同时比对 is_support 标识;匹配成功返回 true,否则返回 false。随后实现 RemoveTrendlineFromStorage 函数:校验传入索引 index 是否小于 numTrendlines,索引非法则直接退出,同时打印删除日志。
若 DeleteExpiredObjects 为 true,调用 ObjectDelete 删除名称为 trendlines[index].name 的趋势线图形对象;循环遍历 touch_count,依次删除触碰箭头与点位标签,图形名称格式为 trendlines[index].name + '_touch' + IntegerToString(m)、trendlines[index].name + '_point_label' + IntegerToString(m);并依据 label_name、signal_arrow、signal_text 删除趋势线标签、信号箭头与信号文字。最后,将 trendlines 数组从索引位置至 numTrendlines - 1 的元素向前移位,移除目标条目;调用 ArrayResize 调整数组尺寸,趋势线计数自减。该机制能够有效防止重复趋势线,清理失效、被突破的趋势线。接下来我们将借助前面定义的各类辅助函数,编写用于查找并绘制趋势线的函数。
//+------------------------------------------------------------------+
//| Find and draw trendlines if no active one exists                 |
//+------------------------------------------------------------------+
void FindAndDrawTrendlines(bool isSupport) {
   bool has_active = false;                       //--- Initialize active flag
   for (int i = 0; i < numTrendlines; i++) {      //--- Iterate through trendlines
      if (trendlines[i].is_support == isSupport) { //--- Check type match
         has_active = true;                       //--- Set active flag
         break;                                   //--- Exit loop
      }
   }
   if (has_active) return;                        //--- Exit if active trendline exists
   Swing swings[];                                //--- Initialize swings array
   int numSwings;                                 //--- Initialize swings count
   color lineColor;                               //--- Initialize line color
   string prefix;                                 //--- Initialize prefix
   if (isSupport) {                               //--- Handle support case
      numSwings = numLows;                        //--- Set number of lows
      ArrayResize(swings, numSwings);             //--- Resize swings array
      for (int i = 0; i < numSwings; i++) {       //--- Iterate through lows
         swings[i].time = swingLows[i].time;      //--- Copy low time
         swings[i].price = swingLows[i].price;    //--- Copy low price
      }
      lineColor = SupportLineColor;               //--- Set support line color
      prefix = "Trendline_Support_";              //--- Set support prefix
   } else {                                       //--- Handle resistance case
      numSwings = numHighs;                       //--- Set number of highs
      ArrayResize(swings, numSwings);             //--- Resize swings array
      for (int i = 0; i < numSwings; i++) {       //--- Iterate through highs
         swings[i].time = swingHighs[i].time;     //--- Copy high time
         swings[i].price = swingHighs[i].price;   //--- Copy high price
      }
      lineColor = ResistanceLineColor;            //--- Set resistance line color
      prefix = "Trendline_Resistance_";           //--- Set resistance prefix
   }
   if (numSwings < 2) return;                     //--- Exit if insufficient swings
   double pointValue = _Point;                    //--- Get point value
   double touch_tolerance = TouchTolerance * pointValue; //--- Calculate touch tolerance
   double pen_tolerance = PenetrationTolerance * pointValue; //--- Calculate penetration tolerance
   int best_j = -1;                               //--- Initialize best j index
   int max_touches = 0;                           //--- Initialize max touches
   int best_touch_indices[];                      //--- Initialize best touch indices
   double best_slope = 0.0;                       //--- Initialize best slope
   double best_intercept = 0.0;                   //--- Initialize best intercept
   datetime best_min_time = 0;                    //--- Initialize best min time
   for (int i = 0; i < numSwings - 1; i++) {      //--- Iterate through first points
      for (int j = i + 1; j < numSwings; j++) {   //--- Iterate through second points
         datetime time1 = swings[i].time;         //--- Get first time
         double price1 = swings[i].price;         //--- Get first price
         datetime time2 = swings[j].time;         //--- Get second time
         double price2 = swings[j].price;         //--- Get second price
         double dt = (double)(time2 - time1);     //--- Calculate time difference
         if (dt <= 0) continue;                   //--- Skip invalid time difference
         double initial_slope = (price2 - price1) / dt; //--- Calculate initial slope
         int touch_indices[];                     //--- Initialize touch indices
         ArrayResize(touch_indices, 0);           //--- Resize touch indices
         int touches = 0;                         //--- Initialize touches count
         ArrayResize(touch_indices, touches + 1); //--- Add first index
         touch_indices[touches] = i;              //--- Set first index
         touches++;                               //--- Increment touches
         ArrayResize(touch_indices, touches + 1); //--- Add second index
         touch_indices[touches] = j;              //--- Set second index
         touches++;                               //--- Increment touches
         for (int k = 0; k < numSwings; k++) {    //--- Iterate through swings
            if (k == i || k == j) continue;       //--- Skip used indices
            datetime tk = swings[k].time;         //--- Get swing time
            double dk = (double)(tk - time1);     //--- Calculate time difference
            double expected = price1 + initial_slope * dk; //--- Calculate expected price
            double actual = swings[k].price;      //--- Get actual price
            if (MathAbs(expected - actual) <= touch_tolerance) { //--- Check touch within tolerance
               ArrayResize(touch_indices, touches + 1); //--- Add index
               touch_indices[touches] = k;        //--- Set index
               touches++;                         //--- Increment touches
            }
         }
         if (touches >= MinTouches) {             //--- Check minimum touches
            ArraySort(touch_indices);             //--- Sort touch indices
            bool valid_spacing = true;            //--- Initialize spacing flag
            for (int m = 0; m < touches - 1; m++) { //--- Iterate through touches
               int idx1 = touch_indices[m];       //--- Get first index
               int idx2 = touch_indices[m + 1];   //--- Get second index
               int bar1 = iBarShift(_Symbol, _Period, swings[idx1].time); //--- Get first bar
               int bar2 = iBarShift(_Symbol, _Period, swings[idx2].time); //--- Get second bar
               int diff = MathAbs(bar1 - bar2);   //--- Calculate bar difference
               if (diff < MinBarSpacing) {        //--- Check minimum spacing
                  valid_spacing = false;          //--- Mark invalid spacing
                  break;                          //--- Exit loop
               }
            }
            if (valid_spacing) {                  //--- Check valid spacing
               datetime touch_times[];            //--- Initialize touch times
               double touch_prices[];             //--- Initialize touch prices
               ArrayResize(touch_times, touches); //--- Resize times array
               ArrayResize(touch_prices, touches); //--- Resize prices array
               for (int m = 0; m < touches; m++) { //--- Iterate through touches
                  int idx = touch_indices[m];      //--- Get index
                  touch_times[m] = swings[idx].time;   //--- Set time
                  touch_prices[m] = swings[idx].price; //--- Set price
               }
               double slope, intercept;                //--- Declare slope and intercept
               LeastSquaresFit(touch_times, touch_prices, touches, slope, intercept); //--- Perform least squares fit
               int adjusted_touch_indices[];           //--- Initialize adjusted indices
               ArrayResize(adjusted_touch_indices, 0); //--- Resize adjusted indices
               int adjusted_touches = 0;               //--- Initialize adjusted touches count
               for (int k = 0; k < numSwings; k++) {   //--- Iterate through swings
                  double expected = intercept + slope * (double)swings[k].time; //--- Calculate expected price
                  double actual = swings[k].price;     //--- Get actual price
                  if (MathAbs(expected - actual) <= touch_tolerance) { //--- Check touch
                     ArrayResize(adjusted_touch_indices, adjusted_touches + 1); //--- Add index
                     adjusted_touch_indices[adjusted_touches] = k; //--- Set index
                     adjusted_touches++;               //--- Increment adjusted touches
                  }
               }
               if (adjusted_touches >= MinTouches) { //--- Check minimum adjusted touches
                  datetime temp_min_time = swings[adjusted_touch_indices[0]].time; //--- Get min time
                  double temp_ref_price = intercept + slope * (double)temp_min_time; //--- Calculate ref price
                  if (ValidateTrendline(isSupport, temp_min_time, temp_min_time, temp_ref_price, slope, pen_tolerance)) { //--- Validate trendline
                     datetime temp_max_time = swings[adjusted_touch_indices[adjusted_touches - 1]].time; //--- Get max time
                     double temp_max_price = intercept + slope * (double)temp_max_time; //--- Calculate max price
                     double angle = CalculateAngle(temp_min_time, temp_ref_price, temp_max_time, temp_max_price); //--- Calculate angle
                     double abs_angle = MathAbs(angle); //--- Get absolute angle
                     if (abs_angle >= MinAngle && abs_angle <= MaxAngle) { //--- Check angle range
                        if (adjusted_touches > max_touches || (adjusted_touches == max_touches && j > best_j)) { //--- Check better trendline
                           max_touches = adjusted_touches; //--- Update max touches
                           best_j = j;                     //--- Update best j
                           best_slope = slope;             //--- Update best slope
                           best_intercept = intercept;     //--- Update best intercept
                           best_min_time = temp_min_time;  //--- Update best min time
                           ArrayResize(best_touch_indices, adjusted_touches); //--- Resize best indices
                           ArrayCopy(best_touch_indices, adjusted_touch_indices); //--- Copy indices
                        }
                     }
                  }
               }
            }
         }
      }
   }
   if (max_touches < MinTouches) {                //--- Check insufficient touches
      string type = isSupport ? "Support" : "Resistance"; //--- Set type string
      return;                                     //--- Exit function
   }
   int touch_indices[];                           //--- Initialize touch indices
   ArrayResize(touch_indices, max_touches);       //--- Resize touch indices
   ArrayCopy(touch_indices, best_touch_indices);  //--- Copy best indices
   int touches = max_touches;                     //--- Set touches count
   datetime min_time = best_min_time;             //--- Set min time
   double price_min = best_intercept + best_slope * (double)min_time; //--- Calculate min price
   datetime max_time = swings[touch_indices[touches - 1]].time; //--- Set max time
   double price_max = best_intercept + best_slope * (double)max_time; //--- Calculate max price
   datetime start_time_check = min_time;          //--- Set start time check
   double start_price_check = swings[touch_indices[0]].price; //--- Set start price check
   if (IsStartingPointUsed(start_time_check, start_price_check, isSupport)) { //--- Check used starting point
      return;                                     //--- Skip if used
   }
   datetime time_end = iTime(_Symbol, _Period, 0) + PeriodSeconds(_Period) * ExtensionBars; //--- Calculate end time
   double dk_end = (double)(time_end - min_time);      //--- Calculate end time difference
   double price_end = price_min + best_slope * dk_end; //--- Calculate end price
   string unique_name = prefix + TimeToString(TimeCurrent(), TIME_DATE|TIME_MINUTES|TIME_SECONDS); //--- Generate unique name
   if (ObjectFind(0, unique_name) < 0) {               //--- Check if trendline exists
      ObjectCreate(0, unique_name, OBJ_TREND, 0, min_time, price_min, time_end, price_end); //--- Create trendline
      ObjectSetInteger(0, unique_name, OBJPROP_COLOR, lineColor);   //--- Set color
      ObjectSetInteger(0, unique_name, OBJPROP_STYLE, STYLE_SOLID); //--- Set style
      ObjectSetInteger(0, unique_name, OBJPROP_WIDTH, 1);           //--- Set width
      ObjectSetInteger(0, unique_name, OBJPROP_RAY_RIGHT, false);   //--- Disable right ray
      ObjectSetInteger(0, unique_name, OBJPROP_RAY_LEFT, false);    //--- Disable left ray
      ObjectSetInteger(0, unique_name, OBJPROP_BACK, false);        //--- Set to foreground
   }
   ArrayResize(trendlines, numTrendlines + 1);                      //--- Resize trendlines array
   trendlines[numTrendlines].name = unique_name;                    //--- Set trendline name
   trendlines[numTrendlines].start_time = min_time;                 //--- Set start time
   trendlines[numTrendlines].end_time = time_end;                   //--- Set end time
   trendlines[numTrendlines].start_price = price_min;               //--- Set start price
   trendlines[numTrendlines].end_price = price_end;                 //--- Set end price
   trendlines[numTrendlines].slope = best_slope;                    //--- Set slope
   trendlines[numTrendlines].is_support = isSupport;                //--- Set type
   trendlines[numTrendlines].touch_count = touches;                 //--- Set touch count
   trendlines[numTrendlines].creation_time = TimeCurrent();         //--- Set creation time
   trendlines[numTrendlines].is_signaled = false;                   //--- Set signaled flag
   ArrayResize(trendlines[numTrendlines].touch_indices, touches);   //--- Resize touch indices
   ArrayCopy(trendlines[numTrendlines].touch_indices, touch_indices); //--- Copy touch indices
   numTrendlines++;                                                 //--- Increment trendlines count
   ArrayResize(startingPoints, numStartingPoints + 1);              //--- Resize starting points array
   startingPoints[numStartingPoints].time = start_time_check; //--- Set starting point time
   startingPoints[numStartingPoints].price = start_price_check; //--- Set starting point price
   startingPoints[numStartingPoints].is_support = isSupport; //--- Set starting point type
   numStartingPoints++;                           //--- Increment starting points count
   if (DrawTouchArrows) {                         //--- Check draw arrows
      for (int m = 0; m < touches; m++) {         //--- Iterate through touches
         int idx = touch_indices[m];              //--- Get touch index
         datetime tk_time = swings[idx].time;     //--- Get touch time
         double tk_price = swings[idx].price;     //--- Get touch price
         string arrow_name = unique_name + "_touch" + IntegerToString(m); //--- Generate arrow name
         if (ObjectFind(0, arrow_name) < 0) {                             //--- Check if arrow exists
            ObjectCreate(0, arrow_name, OBJ_ARROW, 0, tk_time, tk_price); //--- Create touch arrow
            ObjectSetInteger(0, arrow_name, OBJPROP_ARROWCODE, 159);      //--- Set arrow code
            ObjectSetInteger(0, arrow_name, OBJPROP_ANCHOR, isSupport ? ANCHOR_TOP : ANCHOR_BOTTOM); //--- Set anchor
            ObjectSetInteger(0, arrow_name, OBJPROP_COLOR, lineColor);    //--- Set color
            ObjectSetInteger(0, arrow_name, OBJPROP_WIDTH, 1);            //--- Set width
            ObjectSetInteger(0, arrow_name, OBJPROP_BACK, false);         //--- Set to foreground
         }
      }
   }
   double angle = CalculateAngle(min_time, price_min, max_time, price_max); //--- Calculate angle
   string type = isSupport ? "Support" : "Resistance"; //--- Set type string
   Print(type + " Trendline " + unique_name + " drawn with " + IntegerToString(touches) + " touches. Inclination angle: " + DoubleToString(angle, 2) + " degrees."); //--- Log trendline
   if (DrawLabels) {                              //--- Check draw labels
      datetime mid_time = min_time + (max_time - min_time) / 2; //--- Calculate mid time
      double dk_mid = (double)(mid_time - min_time); //--- Calculate mid time difference
      double mid_price = price_min + best_slope * dk_mid; //--- Calculate mid price
      double label_offset = 20 * _Point * (isSupport ? -1 : 1); //--- Calculate label offset
      double label_price = mid_price + label_offset; //--- Calculate label price
      int label_anchor = isSupport ? ANCHOR_TOP : ANCHOR_BOTTOM; //--- Set label anchor
      string label_text = type + " Trendline";    //--- Set label text
      string label_name = unique_name + "_label"; //--- Generate label name
      if (ObjectFind(0, label_name) < 0) {        //--- Check if label exists
         ObjectCreate(0, label_name, OBJ_TEXT, 0, mid_time, label_price); //--- Create label
         ObjectSetString(0, label_name, OBJPROP_TEXT, label_text); //--- Set text
         ObjectSetInteger(0, label_name, OBJPROP_COLOR, clrBlack); //--- Set color
         ObjectSetInteger(0, label_name, OBJPROP_FONTSIZE, 8); //--- Set font size
         ObjectSetInteger(0, label_name, OBJPROP_ANCHOR, label_anchor); //--- Set anchor
         ObjectSetDouble(0, label_name, OBJPROP_ANGLE, angle); //--- Set angle
         ObjectSetInteger(0, label_name, OBJPROP_BACK, false); //--- Set to foreground
      }
      color point_label_color = isSupport ? clrSaddleBrown : clrDarkGoldenrod; //--- Set point label color
      double point_text_offset = 20.0 * _Point;   //--- Set point text offset
      for (int m = 0; m < touches; m++) {         //--- Iterate through touches
         int idx = touch_indices[m];              //--- Get touch index
         datetime tk_time = swings[idx].time;     //--- Get touch time
         double tk_price = swings[idx].price;     //--- Get touch price
         double text_price;                       //--- Initialize text price
         int point_text_anchor;                   //--- Initialize text anchor
         if (isSupport) {                         //--- Handle support
            text_price = tk_price - point_text_offset; //--- Set text price below
            point_text_anchor = ANCHOR_LEFT;      //--- Set left anchor
         } else {                                 //--- Handle resistance
            text_price = tk_price + point_text_offset; //--- Set text price above
            point_text_anchor = ANCHOR_BOTTOM;    //--- Set bottom anchor
         }
         string text_name = unique_name + "_point_label" + IntegerToString(m); //--- Generate text name
         string point_text = "Pt " + IntegerToString(m + 1); //--- Set point text
         if (ObjectFind(0, text_name) < 0) {     //--- Check if text exists
            ObjectCreate(0, text_name, OBJ_TEXT, 0, tk_time, text_price); //--- Create text
            ObjectSetString(0, text_name, OBJPROP_TEXT, point_text); //--- Set text
            ObjectSetInteger(0, text_name, OBJPROP_COLOR, point_label_color); //--- Set color
            ObjectSetInteger(0, text_name, OBJPROP_FONTSIZE, 8); //--- Set font size
            ObjectSetInteger(0, text_name, OBJPROP_ANCHOR, point_text_anchor); //--- Set anchor
            ObjectSetDouble(0, text_name, OBJPROP_ANGLE, 0); //--- Set angle
            ObjectSetInteger(0, text_name, OBJPROP_BACK, false); //--- Set to foreground
         }
      }
   }
}
本节我们实现 FindAndDrawTrendlines 函数,用于识别并绘制趋势线,保证同一类型仅保留一条有效趋势线,同时选取最优触碰点位。首先遍历 trendlines 数组内全部 numTrendlines 条趋势线,检查是否已存在同类型趋势线;若 is_support 与入参匹配,将 has_active 置为 true,直接退出函数。随后依据 isSupport 区分支撑、阻力逻辑:若是支撑趋势线,将 numLows 赋值给 numSwings,从 swingLows 填充点位数组,线条颜色赋值为 SupportLineColor,名称前缀为 "Trendline_Support_";若是阻力趋势线,则使用 numHighs、swingHighs、ResistanceLineColor、Trendline_Resistance_;若有效波段点位数量 numSwings 小于 2,直接退出。接着结合 TouchTolerance、PenetrationTolerance 与 _Point 计算触碰容差 touch_tolerance 和穿透容差 pen_tolerance;遍历所有波段点位组合,计算初始斜率 initial_slope,收集落在容差范围内点位的索引 touch_indices。
若有效触碰数量达到 MinTouches,并且通过 iBarShift 校验满足 MinBarSpacing 最小 K 线间隔要求,则调用 LeastSquaresFit 求解斜率与截距,重新校验触碰点位;再调用 ValidateTrendline 校验趋势线有效性、CalculateAngle 校验倾斜角度,确保角度介于 MinAngle 与 MaxAngle 之间。持续更新最优参数:best_j、max_touches、best_slope、best_intercept、best_min_time、best_touch_indices,筛选出触碰点位最多的最优趋势线。最后,当 max_touches 达到最小触碰次数,且 IsStartingPointUsed 判定起点未被占用时,调用 ObjectCreate 创建类型为 OBJ_TREND 的趋势线对象并分配唯一名称;若 DrawTouchArrows、DrawLabels 开启,则绘制触碰箭头与点位标签;将趋势线信息存入 trendlines 数组,把起点加入起点存储列表并打印日志,完成精准趋势线创建。剩下的工作是持续管理已生成的趋势线,实时更新并监控价格穿越趋势线,以此生成交易信号。为简化代码结构,我们会把整套逻辑整合到同一个函数内。
//+------------------------------------------------------------------+
//| Update trendlines and check for signals                          |
//+------------------------------------------------------------------+
void UpdateTrendlines() {
   datetime current_time = iTime(_Symbol, _Period, 0);       //--- Get current time
   double pointValue = _Point;                               //--- Get point value
   double pen_tolerance = PenetrationTolerance * pointValue; //--- Calculate penetration tolerance
   double touch_tolerance = TouchTolerance * pointValue;     //--- Calculate touch tolerance
   for (int i = numTrendlines - 1; i >= 0; i--) {            //--- Iterate trendlines backward
      string type = trendlines[i].is_support ? "Support" : "Resistance"; //--- Determine trendline type
      string name = trendlines[i].name;                      //--- Get trendline name
      if (current_time > trendlines[i].end_time) {           //--- Check if expired
         PrintFormat("%s trendline %s is no longer valid (expired). End time: %s, Current time: %s.", type, name, TimeToString(trendlines[i].end_time), TimeToString(current_time)); //--- Log expiration
         RemoveTrendlineFromStorage(i);                      //--- Remove trendline
         continue;                                           //--- Skip to next
      }
      datetime prev_bar_time = iTime(_Symbol, _Period, 1);   //--- Get previous bar time
      double dk = (double)(prev_bar_time - trendlines[i].start_time); //--- Calculate time difference
      double line_price = trendlines[i].start_price + trendlines[i].slope * dk; //--- Calculate line price
      double prev_low = iLow(_Symbol, _Period, 1);           //--- Get previous bar low
      double prev_high = iHigh(_Symbol, _Period, 1);         //--- Get previous bar high
      bool broken = false;                                   //--- Initialize broken flag
      if (trendlines[i].is_support && prev_low < line_price - pen_tolerance) { //--- Check support break
         PrintFormat("%s trendline %s is no longer valid (broken by price). Line price: %.5f, Prev low: %.5f, Penetration: %.5f points.", type, name, line_price, prev_low, PenetrationTolerance); //--- Log break
         RemoveTrendlineFromStorage(i);           //--- Remove trendline
         broken = true;                           //--- Set broken flag
      } else if (!trendlines[i].is_support && prev_high > line_price + pen_tolerance) { //--- Check resistance break
         PrintFormat("%s trendline %s is no longer valid (broken by price). Line price: %.5f, Prev high: %.5f, Penetration: %.5f points.", type, name, line_price, prev_high, PenetrationTolerance); //--- Log break
         RemoveTrendlineFromStorage(i);           //--- Remove trendline
         broken = true;                           //--- Set broken flag
      }
      if (!broken && !trendlines[i].is_signaled && EnableTradingSignals) { //--- Check for trading signal
         bool touched = false;                    //--- Initialize touched flag
         string signal_type = "";                 //--- Initialize signal type
         color signal_color = clrNONE;            //--- Initialize signal color
         int arrow_code = 0;                      //--- Initialize arrow code
         int anchor = 0;                          //--- Initialize anchor
         double text_angle = 0.0;                 //--- Initialize text angle
         double text_offset = 0.0;                //--- Initialize text offset
         double text_price = 0.0;                 //--- Initialize text price
         int text_anchor = 0;                     //--- Initialize text anchor
         if (trendlines[i].is_support && MathAbs(prev_low - line_price) <= touch_tolerance) { //--- Check support touch
            touched = true;                       //--- Set touched flag
            signal_type = "BUY";                  //--- Set buy signal
            signal_color = clrBlue;               //--- Set blue color
            arrow_code = 217;                     //--- Set up arrow for support (BUY)
            anchor = ANCHOR_TOP;                  //--- Set top anchor
            text_angle = -90.0;                   //--- Set vertical upward for BUY
            text_offset = -20 * pointValue;        //--- Set text offset
            text_price = line_price + text_offset; //--- Calculate text price
            text_anchor = ANCHOR_LEFT;            //--- Set left anchor
            double Ask = NormalizeDouble(SymbolInfoDouble(_Symbol, SYMBOL_ASK), _Digits); //--- Get ask price
            double SL = NormalizeDouble(Ask - inpSLPoints * _Point, _Digits); //--- Calculate stop loss
            double TP = NormalizeDouble(Ask + (inpSLPoints * inpRRRatio) * _Point, _Digits); //--- Calculate take profit
            obj_Trade.Buy(inpLot, _Symbol, Ask, SL, TP); //--- Execute buy trade
         } else if (!trendlines[i].is_support && MathAbs(prev_high - line_price) <= touch_tolerance) { //--- Check resistance touch
            touched = true;                       //--- Set touched flag
            signal_type = "SELL";                 //--- Set sell signal
            signal_color = clrRed;                //--- Set red color
            arrow_code = 218;                     //--- Set down arrow for resistance (SELL)
            anchor = ANCHOR_BOTTOM;               //--- Set bottom anchor
            text_angle = 90.0;                    //--- Set vertical downward for SELL
            text_offset = 20 * pointValue;       //--- Set text offset
            text_price = line_price + text_offset; //--- Calculate text price
            text_anchor = ANCHOR_BOTTOM;          //--- Set bottom anchor
            double Bid = NormalizeDouble(SymbolInfoDouble(_Symbol, SYMBOL_BID), _Digits); //--- Get bid price
            double SL = NormalizeDouble(Bid + inpSLPoints * _Point, _Digits); //--- Calculate stop loss
            double TP = NormalizeDouble(Bid - (inpSLPoints * inpRRRatio) * _Point, _Digits); //--- Calculate take profit
            obj_Trade.Sell(inpLot, _Symbol, Bid, SL, TP); //--- Execute sell trade
         }
         if (touched) {                           //--- Check if touched
            PrintFormat("Signal generated for %s trendline %s: %s at price %.5f, time %s.", type, name, signal_type, line_price, TimeToString(current_time)); //--- Log signal
            string arrow_name = name + "_signal_arrow"; //--- Generate signal arrow name
            if (ObjectFind(0, arrow_name) < 0) {  //--- Check if arrow exists
               ObjectCreate(0, arrow_name, OBJ_ARROW, 0, prev_bar_time, line_price); //--- Create signal arrow
               ObjectSetInteger(0, arrow_name, OBJPROP_ARROWCODE, arrow_code); //--- Set arrow code
               ObjectSetInteger(0, arrow_name, OBJPROP_ANCHOR, anchor); //--- Set anchor
               ObjectSetInteger(0, arrow_name, OBJPROP_COLOR, signal_color); //--- Set color
               ObjectSetInteger(0, arrow_name, OBJPROP_WIDTH, 1); //--- Set width
               ObjectSetInteger(0, arrow_name, OBJPROP_BACK, false); //--- Set to foreground
            }
            string text_name = name + "_signal_text"; //--- Generate signal text name
            if (ObjectFind(0, text_name) < 0) {   //--- Check if text exists
               ObjectCreate(0, text_name, OBJ_TEXT, 0, prev_bar_time, text_price); //--- Create signal text
               ObjectSetString(0, text_name, OBJPROP_TEXT, " " + signal_type); //--- Set text content
               ObjectSetInteger(0, text_name, OBJPROP_COLOR, signal_color); //--- Set color
               ObjectSetInteger(0, text_name, OBJPROP_FONTSIZE, 10); //--- Set font size
               ObjectSetInteger(0, text_name, OBJPROP_ANCHOR, text_anchor); //--- Set anchor
               ObjectSetDouble(0, text_name, OBJPROP_ANGLE, text_angle); //--- Set angle
               ObjectSetInteger(0, text_name, OBJPROP_BACK, false); //--- Set to foreground
            }
            trendlines[i].is_signaled = true;     //--- Set signaled flag
         }
      }
   }
}
为持续监控有效趋势线并触发相应交易逻辑,我们创建 UpdateTrendlines 函数,该函数为无返回值 void 类型。首先通过 iTime 获取当前 K 线的 current_time;计算 pointValue 等于 _Point,pen_tolerance 等于 PenetrationTolerance * pointValue,touch_tolerance 等于 TouchTolerance * pointValue。随后反向遍历 trendlines 数组内所有 numTrendlines 条趋势线,依据 is_support 判断趋势线类型为支撑或阻力;检测 current_time 是否超出 end_time,若趋势线已过期,使用 PrintFormat 打印日志,并调用 RemoveTrendlineFromStorage 删除该趋势线。
接着,对于未过期趋势线,利用偏移 1 根 K 线的 iTime 获取 prev_bar_time,通过公式 start_price + slope * dk 算出该时间对应的趋势线价格;对比前一根 K 线的最低价 prev_low / 最高价 prev_high 与趋势线价格,结合穿透容差 pen_tolerance 判断趋势线是否被突破。一旦确认突破,使用 PrintFormat 输出日志,并且调用 RemoveTrendlineFromStorage 将趋势线移除。
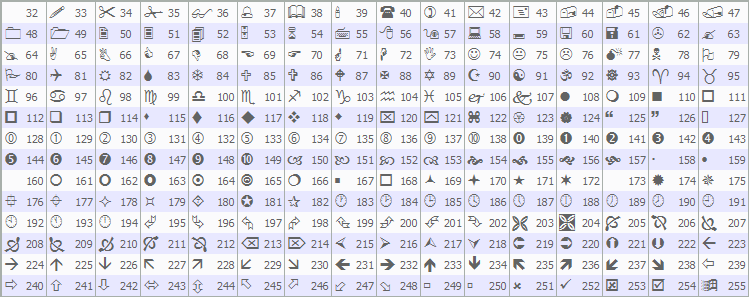
若趋势线未被突破、is_signaled 为 false 且 EnableTradingSignals 开启,程序开始检测价格触碰:支撑趋势线场景:若 prev_low 与趋势线价格差值落在触碰容差范围内,生成买入信号,调用 obj_Trade.Buy 执行多单;手数使用 inpLot,成交价为 Ask 价,止损、止盈依据 inpSLPoints 与 inpRRRatio 计算。同时在图表绘制蓝色向上箭头(字符编码 217)与文字标注。阻力趋势线场景:若 prev_high 在容差区间内,生成卖出信号,调用 obj_Trade.Sell 执行空单;绘制红色向下箭头(字符编码 218)与文字标注。通过 PrintFormat 输出日志,调用 ObjectCreate 创建图表对象,使用 ObjectSetInteger、ObjectSetString 设置图形属性,并将 is_signaled 标记为 true,以此完成趋势线动态更新与精准交易信号生成。箭头字符编码可自由选择。下方提供 MQL5 内置 Wingdings 字体编码参考列表。
我们可以在 OnTick 事件函数中调用以上函数,让系统基于报价驱动持续运行。
//+------------------------------------------------------------------+
//| Expert tick function                                             |
//+------------------------------------------------------------------+
void OnTick() {
   if (!IsNewBar()) return;                        //--- Exit if not new bar
   DetectSwings();                                 //--- Detect swings
   UpdateTrendlines();                             //--- Update trendlines
   FindAndDrawTrendlines(true);                    //--- Find/draw support trendlines
}
在 OnTick 事件内,我们统筹执行趋势线识别与新 K 线交易逻辑。首先调用 IsNewBar 判断是否生成新 K 线,条件不成立直接退出,避免重复运算。执行 DetectSwings,识别并更新存入 swingHighs、swingLows 的波段高低点。调用 UpdateTrendlines,校验现有趋势线,移除过期或被突破的线条;当价格触碰趋势线且满足容差条件时生成交易信号。最后调用 FindAndDrawTrendlines(true) 创建支撑趋势线;仅当不存在同类型有效趋势线时,才会绘制新趋势线。编译后,我们得到以下结果。
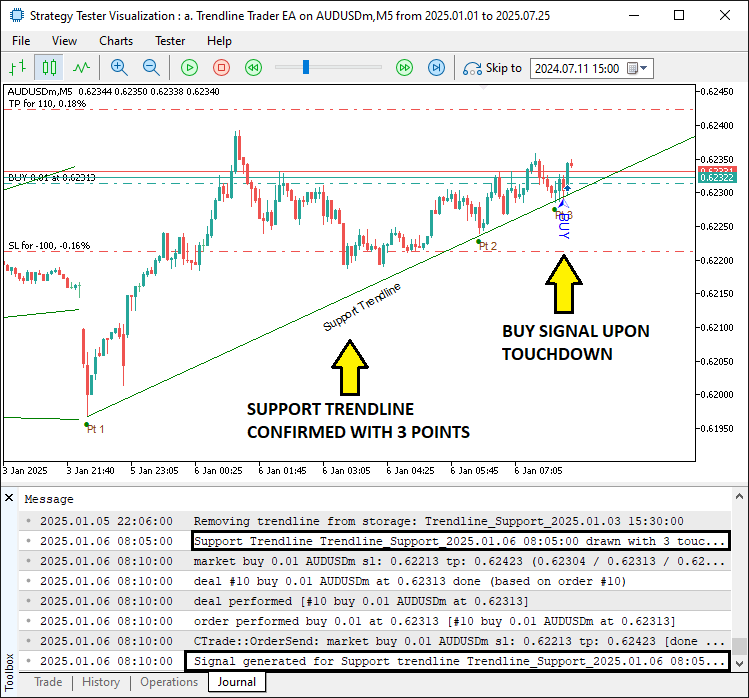
从截图可见,程序能够自动识别、分析并绘制支撑趋势线,并在价格触碰时执行交易。过期趋势线也会从存储数组中正常清除。我们只需传入参数 false 调用同一个函数,即可实现阻力趋势线的识别。
//--- other ontick functions

FindAndDrawTrendlines(false);                   //--- Find/draw resistance trendlines

//---
传入参数并完成编译,运行效果如下:
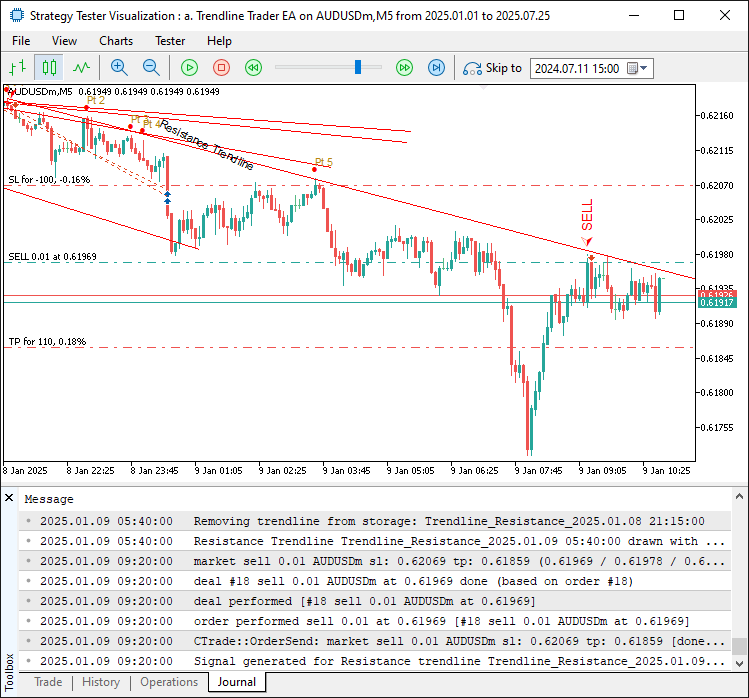
截图证明程序同样可以识别阻力趋势线并触发交易。整合全部逻辑进行测试,最终效果如下:
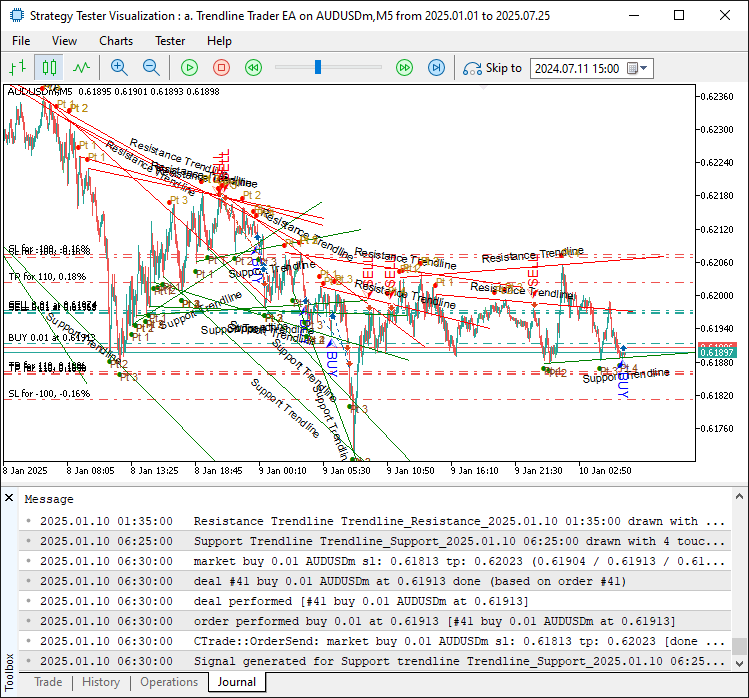
由图可见,程序能够自动识别趋势线、可视化展示,并且在价格触碰趋势线时执行交易,达成预期开发目标。剩下的事情就是对该程序进行回测,这将在下一节中处理。
回测
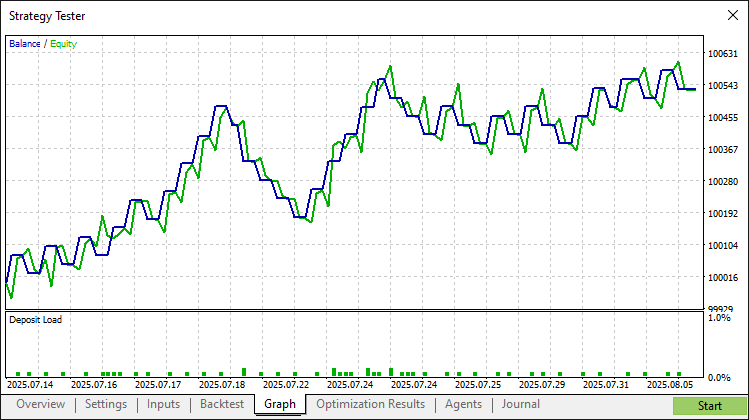
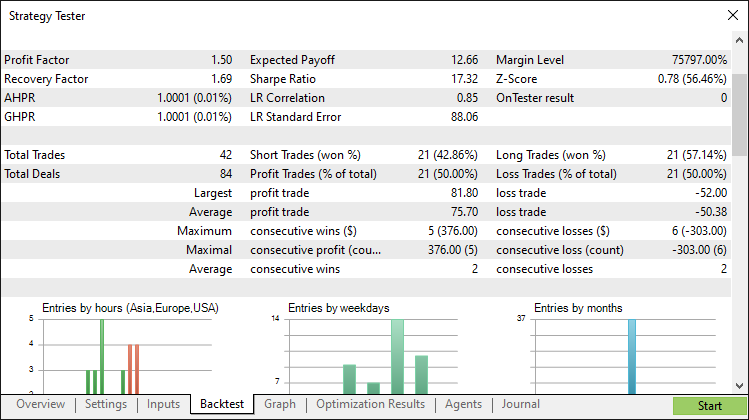
经过彻底的回测后,我们得到以下结果。
回测结果图形:
回测报告:
结论
总而言之,我们基于 MQL5 开发出一套趋势线交易策略,程序采用最小二乘法识别稳定有效的支撑、阻力趋势线,并自动生成买卖交易信号,同时搭配箭头、文字标签等可视化标识。借助 TrendlineInfo 结构体以及 FindAndDrawTrendlines 等模块化函数,该策略提供一套规范的趋势交易框架,你可以通过调整参数持续优化策略表现。
免责声明:本文仅用于教学目的。交易存在重大财务风险,市场波动可能导致亏损。在将本程序应用于实盘交易前,充分的回测与严谨的风险管理至关重要。
你可以借鉴本文介绍的思路与代码实现,改造这套趋势线系统以适配自身交易风格,进一步完善自动化交易策略。祝您交易愉快!
本文由MetaQuotes Ltd译自英文
原文地址: https://www.mql5.com/en/articles/19077
注意: MetaQuotes Ltd.将保留所有关于这些材料的权利。全部或部分复制或者转载这些材料将被禁止。
本文由网站的一位用户撰写,反映了他们的个人观点。MetaQuotes Ltd 不对所提供信息的准确性负责,也不对因使用所述解决方案、策略或建议而产生的任何后果负责。

 从基础到中级:对象事件(一)

 MQL5自动化交易策略(第二十六部分):构建针形K线均价加仓的多持仓交易系统
 市场模拟:MQL5 中的 SQL 入门(四)
