

MQL5 交易策略自动化(第二十七部分):创建带可视化反馈的价格行为螃蟹谐波形态
 420
420
 8
8

引言
在我们的上一篇文章(第 26 部分)中,我们基于MetaQuotes Language 5(MQL5)开发了一套针形 K 线(Pin Bar)加仓系统,该系统利用针形 K 线形态发起交易,并通过加仓策略管理多个持仓,同时配备动态仪表盘用于实时监控。在第 27 部分,我们搭建一套螃蟹形态系统,通过枢轴点和斐波那契比例识别看涨、看跌螃蟹谐波形态,以精准的入场、止损、止盈点位实现交易自动化,并借助三角形、趋势线等可视化图表对象清晰呈现形态结构。本文将包括几个方面:
最后,你将得到一套成熟的 MQL5 谐波形态交易策略,可直接进行自定义修改 —— 让我们开始深入学习!
理解螃蟹谐波形态框架
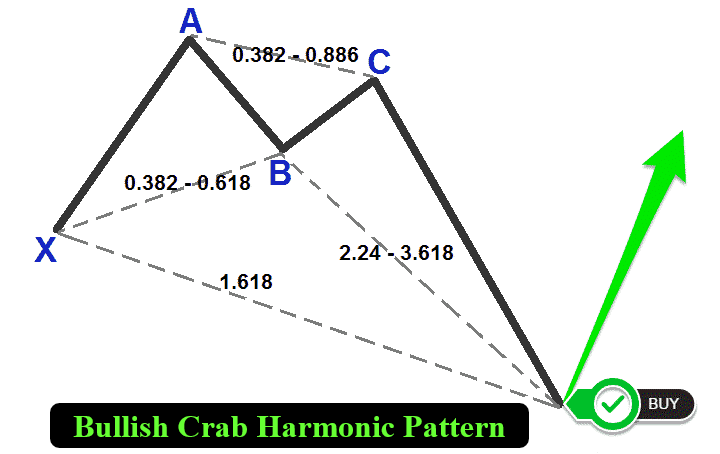
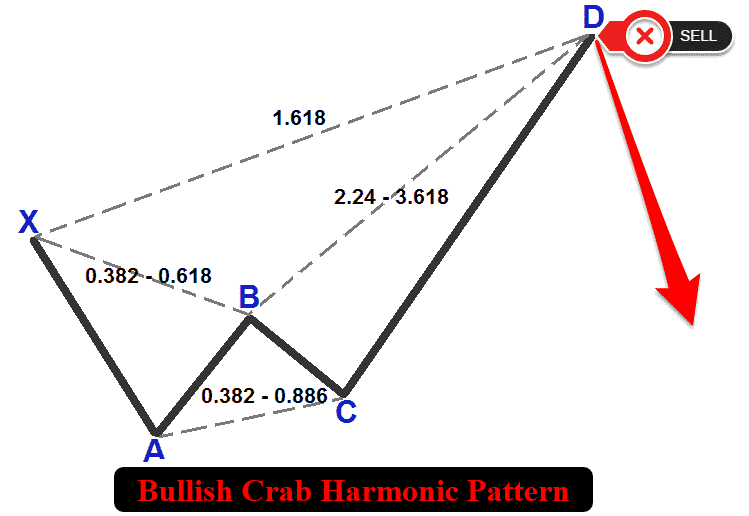
螃蟹形态是一种谐波交易形态,由五个关键枢轴点 X、A、B、C、D 定义,分为看涨形态与看跌形态两种类型。看涨螃蟹形态的结构遵循低点‑高点‑低点‑高点‑低点的序列:X 点为波段低点,A 点为波段高点,B 点为波段低点(回撤 XA 段的 0.618),C 点为波段高点(BC 相对 AB 的幅度处于 0.382–0.886 区间),D 点为波段低点(XA 段的 1.618 倍延伸,位置低于 X 点)。与之相反,看跌螃蟹形态遵循高点‑低点‑高点‑低点‑高点序列:X 点为波段高点,A 点为波段低点,B 点为波段高点,C 点为波段低点,D 点为波段高点(XA 段的 1.618 倍延伸,位置高于 X 点)。下面是各类形态的可视化示意图。
看涨螃蟹谐波形态:
看跌螃蟹谐波形态:
为了识别这些形态,我们采用以下结构化方法:
- 定义 XA 波段:从 X 点到 A 点的初始驱动行情构成形态的基础,决定整体方向(看涨为向下,看跌为向上),同时作为斐波那契计算的基准。
- 确立 AB 波段:B 点需要回撤 XA 波段约 0.618,代表行情进入回调,但不会对初始趋势形成过强反转。
- 分析 BC 波段:该波段需要达到 AB 波段 0.382~0.886 的延伸幅度,形成一轮明显反向波动,为最终的延伸段做好铺垫。
- 确定 CD 波段:最后这一波段需要达到 XA 波段 1.618 倍的延伸,D 点即为潜在反转区域,形态在此完成并生成交易信号。
通过应用这套几何与斐波那契判定标准 ,我们的交易系统将在价格数据中系统性识别有效的螃蟹形态。识别完成后,系统会在图表上渲染该形态:使用三角形、趋势线、X/A/B/C/D 点位标签,并使用虚线标记入场位与止盈位。该机制可以在 D 点自动执行交易,使用计算得出的止损与多级止盈,利用该形态的高概率反转特性实现高效入场。接下来我们进入代码实现环节!
在MQL5中的实现
要在 MQL5 中创建程序,请打开MetaEditor,转到“导航器”窗口,找到“指标”文件夹,点击“新建”选项卡,然后按照提示创建文件。文件创建完成后,在代码编辑环境中,我们需要声明一些将在整个程序中使用的全局变量。
//+------------------------------------------------------------------+
//|                                             Crab Pattern EA.mq5. |
//|                        Copyright 2025, Forex Algo-Trader, Allan. |
//|                                 "https://t.me/Forex_Algo_Trader" |
//+------------------------------------------------------------------+
#property copyright   "Forex Algo-Trader, Allan"
#property link        "https://t.me/Forex_Algo_Trader"
#property version     "1.00"
#property description "This EA trades based on Crab Strategy"
#property strict

#include <Trade\Trade.mqh>                         //--- Include Trade library for order management
CTrade obj_Trade;                                  //--- Instantiate trade object for executing orders

//--- Input parameters for user configuration
input int    PivotLeft = 5;                        // Number of bars to the left for pivot identification
input int    PivotRight = 5;                       // Number of bars to the right for pivot identification
input double Tolerance = 0.10;                     // Allowed deviation for Fibonacci levels (10% of XA move)
input double LotSize = 0.01;                       // Lot size for opening new trade positions
input bool   AllowTrading = true;                  // Enable or disable automated trading functionality

//---------------------------------------------------------------------------
//--- Crab pattern definition:
//--- Bullish Crab:
//--- Pivots (X-A-B-C-D): X swing low, A swing high, B swing low, C swing high, D swing low.
//--- Normally XA > 0; Ideal B = A - 0.5*(A-X); Legs within specified ranges.
//--- Bearish Crab:
//--- Pivots (X-A-B-C-D): X swing high, A swing low, B swing high, C swing low, D swing high.
//--- Normally XA > 0; Ideal B = A + 0.5*(X-A); Legs within specified ranges.
//---------------------------------------------------------------------------

struct Pivot {                                     //--- Define structure for pivot points
   datetime time;                                  //--- Store time of pivot bar
   double   price;                                 //--- Store price (high for swing high, low for swing low)
   bool     isHigh;                                //--- Indicate true for swing high, false for swing low
};

Pivot pivots[];                                    //--- Declare array to store pivot points
int      g_patternFormationBar = -1;               //--- Store bar index of pattern formation (-1 if none)
datetime g_lockedPatternX = 0;                     //--- Store X pivot time for locked pattern
我们开始实现螃蟹形态,首先引入 "<Trade\Trade.mqh>" 库,并实例化 "obj_Trade" 为CTrade对象,用于处理订单管理,例如发送买入、卖出请求。接下来我们定义可供用户自定义的输入参数:"PivotLeft" 与 "PivotRight" 均设为 5 根 K 线,用于指定识别波段枢轴点的回溯周期;"Tolerance" 设为 0.10,代表斐波那契比例允许的偏差;"LotSize" 设为 0.01 作为交易手数;"AllowTrading" 设置为 true 以开启自动交易。
接下来我们定义 "Pivot"结构体,包含 "time"(datetime 时间类型)、"price"(double浮点类型)以及 "isHigh"(布尔类型),用来存储枢轴点;声明 "pivots" 为 Pivot 类型数组;同时初始化全局变量:"g_patternFormationBar" 赋值‑1,用于记录形态形成所在 K 线;"g_lockedPatternX" 赋值 0,用于锁定 X 枢轴点的时间以供校验,至此完成形态识别的基础环境搭建。可视化方面,我们将编写函数用来绘制线条、文本标签以及三角形图形。
//+------------------------------------------------------------------+
//| Draw filled triangle on chart                                    |
//+------------------------------------------------------------------+
void DrawTriangle(string name, datetime t1, double p1, datetime t2, double p2, datetime t3, double p3, color cl, int width, bool fill, bool back) {
   if (ObjectCreate(0, name, OBJ_TRIANGLE, 0, t1, p1, t2, p2, t3, p3)) { //--- Create triangle with three points
      ObjectSetInteger(0, name, OBJPROP_COLOR, cl); //--- Set triangle color
      ObjectSetInteger(0, name, OBJPROP_STYLE, STYLE_SOLID); //--- Set solid line style
      ObjectSetInteger(0, name, OBJPROP_WIDTH, width); //--- Set line width
      ObjectSetInteger(0, name, OBJPROP_FILL, fill); //--- Enable or disable fill
      ObjectSetInteger(0, name, OBJPROP_BACK, back); //--- Set background or foreground
   }
}

//+------------------------------------------------------------------+
//| Draw trend line on chart                                         |
//+------------------------------------------------------------------+
void DrawTrendLine(string name, datetime t1, double p1, datetime t2, double p2, color cl, int width, int style) {
   if (ObjectCreate(0, name, OBJ_TREND, 0, t1, p1, t2, p2)) { //--- Create trend line between two points
      ObjectSetInteger(0, name, OBJPROP_COLOR, cl); //--- Set line color
      ObjectSetInteger(0, name, OBJPROP_STYLE, style); //--- Set line style (solid, dotted, etc.)
      ObjectSetInteger(0, name, OBJPROP_WIDTH, width); //--- Set line width
   }
}

//+------------------------------------------------------------------+
//| Draw dotted horizontal line on chart                             |
//+------------------------------------------------------------------+
void DrawDottedLine(string name, datetime t1, double p, datetime t2, color lineColor) {
   if (ObjectCreate(0, name, OBJ_TREND, 0, t1, p, t2, p)) { //--- Create horizontal dotted line
      ObjectSetInteger(0, name, OBJPROP_COLOR, lineColor); //--- Set line color
      ObjectSetInteger(0, name, OBJPROP_STYLE, STYLE_DOT); //--- Set dotted style
      ObjectSetInteger(0, name, OBJPROP_WIDTH, 1); //--- Set line width to 1
   }
}

//+------------------------------------------------------------------+
//| Draw anchored text label for pivots                              |
//+------------------------------------------------------------------+
void DrawTextEx(string name, string text, datetime t, double p, color cl, int fontsize, bool isHigh) {
   if (ObjectCreate(0, name, OBJ_TEXT, 0, t, p)) { //--- Create text label at specified coordinates
      ObjectSetString(0, name, OBJPROP_TEXT, text); //--- Set label text content
      ObjectSetInteger(0, name, OBJPROP_COLOR, cl); //--- Set text color
      ObjectSetInteger(0, name, OBJPROP_FONTSIZE, fontsize); //--- Set font size
      ObjectSetString(0, name, OBJPROP_FONT, "Arial Bold"); //--- Set font to Arial Bold
      if (isHigh) {                                //--- Check if pivot is swing high
         ObjectSetInteger(0, name, OBJPROP_ANCHOR, ANCHOR_BOTTOM); //--- Anchor label above pivot
      } else {                                     //--- Handle swing low
         ObjectSetInteger(0, name, OBJPROP_ANCHOR, ANCHOR_TOP); //--- Anchor label below pivot
      }
      ObjectSetInteger(0, name, OBJPROP_ALIGN, ALIGN_CENTER); //--- Center-align text
   }
}
此处我们为程序实现可视化函数,用于绘制代表螃蟹谐波形态及其交易价位的图表对象。首先创建 "DrawTriangle" 函数,该函数调用ObjectCreate绘制填充三角形OBJ_TRIANGLE,三角形三个顶点由时间 ("t1"、"t2"、"t3") 与价格 ("p1"、"p2"、"p3") 定义;通过ObjectSetInteger函数设置OBJPROP_COLOR为指定颜色、OBJPROP_STYLE 为 STYLE_SOLID 实线样式、OBJPROP_WIDTH 为传入线宽、OBJPROP_FILL 控制是否填充、OBJPROP_BACK 控制对象置于前景还是背景。
接下来实现 "DrawTrendLine" 函数,使用 ObjectCreate 在两点之间创建趋势线对象 OBJ_TREND,通过 ObjectSetInteger 配置 OBJPROP_COLOR、OBJPROP_STYLE(实线、虚线等)以及OBJPROP_WIDTH,实现可自定义的线条样式。然后编写 "DrawDottedLine" 函数,在指定价格位置,从时间 t1 到 t2 绘制水平虚线OBJ_TREND,实现逻辑与上面保持一致。最后实现 "DrawTextEx" 函数,调用对象创建函数在坐标 ("t", "p") 处生成文本标签OBJ_TEXT,格式与前述函数保持统一,确保螃蟹形态与交易价位可以在图表上清晰展示。现在我们进入OnTick事件处理函数,开始寻找波段枢轴点,后续将利用这些点位做形态识别。以下是实现该功能的代码。
//+------------------------------------------------------------------+
//| Expert tick function                                             |
//+------------------------------------------------------------------+
void OnTick() {
   static datetime lastBarTime = 0;               //--- Store time of last processed bar
   datetime currentBarTime = iTime(_Symbol, _Period, 1); //--- Get time of current confirmed bar
   if (currentBarTime == lastBarTime) return;     //--- Exit if no new bar
   lastBarTime = currentBarTime;                  //--- Update last processed bar time
   ArrayResize(pivots, 0);                        //--- Clear pivot array for fresh analysis
   int barsCount = Bars(_Symbol, _Period);        //--- Retrieve total number of bars
   int start = PivotLeft;                         //--- Set starting index for pivot detection
   int end = barsCount - PivotRight;              //--- Set ending index for pivot detection
   for (int i = end - 1; i >= start; i--) {       //--- Iterate through bars to identify pivots
      bool isPivotHigh = true;                    //--- Assume bar is a swing high
      bool isPivotLow = true;                     //--- Assume bar is a swing low
      double currentHigh = iHigh(_Symbol, _Period, i); //--- Get current bar high price
      double currentLow = iLow(_Symbol, _Period, i); //--- Get current bar low price
      for (int j = i - PivotLeft; j <= i + PivotRight; j++) { //--- Check surrounding bars
         if (j < 0 || j >= barsCount) continue;   //--- Skip out-of-bounds indices
         if (j == i) continue;                    //--- Skip current bar
         if (iHigh(_Symbol, _Period, j) > currentHigh) isPivotHigh = false; //--- Invalidate swing high
         if (iLow(_Symbol, _Period, j) < currentLow) isPivotLow = false; //--- Invalidate swing low
      }
      if (isPivotHigh || isPivotLow) {            //--- Check if bar is a pivot
         Pivot p;                                 //--- Create new pivot structure
         p.time = iTime(_Symbol, _Period, i);     //--- Set pivot bar time
         p.price = isPivotHigh ? currentHigh : currentLow; //--- Set pivot price
         p.isHigh = isPivotHigh;                  //--- Set pivot type
         int size = ArraySize(pivots);            //--- Get current pivot array size
         ArrayResize(pivots, size + 1);           //--- Resize pivot array
         pivots[size] = p;                        //--- Add pivot to array
      }
   }
}
接下来我们实现OnTick事件处理函数的初始逻辑,用来检测波段枢轴点,以此作为识别螃蟹谐波形态的基础。首先检测是否产生新 K 线:将静态变量 lastBarTime(初始值为 0)与偏移为 1 的iTime获取的 currentBarTime 做对比,避免使用尚未闭合的当前 K 线;时间无变化则直接退出,检测到新 K 线就更新 lastBarTime。然后调用ArrayResize清空 pivots 数组,保证每一轮都是全新分析。接着通过Bars获取总 K 线数量,设定枢轴点检测区间:start 等于 PivotLeft,end 等于总 K 线数减去 PivotRight,再从 end‑1 向 start 遍历每一根 K 线。
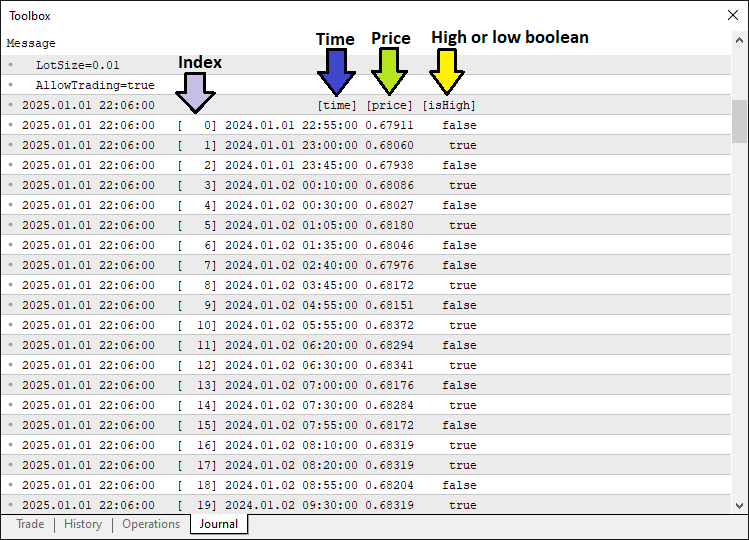
对于每一根 K 线,先假定它是波段高点(isPivotHigh 置 true)同时也是波段低点(isPivotLow 置 true);通过iHigh与iLow读取该 K 线的最高、最低价;再遍历 PivotLeft 与 PivotRight 范围内的周边 K 线,如果相邻 K 线出现更高的高点或者更低的低点,则取消该 K 线的枢轴点判定。最后,如果该 K 线依旧是有效枢轴点(高点或低点),就创建Pivot 结构体 ,用 iTime 赋值 time,依据 isPivotHigh 把 price 赋值为高点或低点,并设置 isHigh 标记;调用 ArrayResize 扩容数组,将该点位存入 pivots 数组。打印该数组之后,可以得到如下输出结果。
有了这些数据,我们可以提取枢轴点;如果我们有足够的枢轴点,就可以分析并检测形态。以下是实现这一功能的代码。
int pivotCount = ArraySize(pivots);            //--- Get total number of pivots
if (pivotCount < 5) {                          //--- Check if insufficient pivots
   g_patternFormationBar = -1;                 //--- Reset pattern formation bar
   g_lockedPatternX = 0;                       //--- Reset locked X pivot
   return;                                     //--- Exit function
}
Pivot X = pivots[pivotCount - 5];              //--- Extract X pivot (earliest)
Pivot A = pivots[pivotCount - 4];              //--- Extract A pivot
Pivot B = pivots[pivotCount - 3];              //--- Extract B pivot
Pivot C = pivots[pivotCount - 2];              //--- Extract C pivot
Pivot D = pivots[pivotCount - 1];              //--- Extract D pivot (latest)
bool patternFound = false;                     //--- Initialize pattern detection flag
if (X.isHigh && !A.isHigh && B.isHigh && !C.isHigh && D.isHigh) { //--- Check bearish Crab pattern
   double diff = X.price - A.price;            //--- Calculate XA leg difference
   if (diff > 0) {                             //--- Ensure positive XA move
      double idealB = A.price + 0.618 * diff;  //--- Compute ideal B (0.618 retracement)
      if (MathAbs(B.price - idealB) <= Tolerance * diff) { //--- Verify B within tolerance
         double AB = B.price - A.price;        //--- Calculate AB leg length
         double BC = B.price - C.price;        //--- Calculate BC leg length
         if (BC >= 0.382 * AB && BC <= 0.886 * AB) { //--- Check BC within Fibonacci range
            double extension = D.price - A.price; //--- Calculate AD extension
            if (MathAbs(extension - 1.618 * diff) <= Tolerance * diff && D.price > X.price) { //--- Verify 1.618 extension and D > X
               patternFound = true;            //--- Confirm bearish pattern
            }
         }
      }
   }
}
if (!X.isHigh && A.isHigh && !B.isHigh && C.isHigh && !D.isHigh) { //--- Check bullish Crab pattern
   double diff = A.price - X.price;            //--- Calculate XA leg difference
   if (diff > 0) {                             //--- Ensure positive XA move
      double idealB = A.price - 0.618 * diff;  //--- Compute ideal B (0.618 retracement)
      if (MathAbs(B.price - idealB) <= Tolerance * diff) { //--- Verify B within tolerance
         double AB = A.price - B.price;        //--- Calculate AB leg length
         double BC = C.price - B.price;        //--- Calculate BC leg length
         if (BC >= 0.382 * AB && BC <= 0.886 * AB) { //--- Check BC within Fibonacci range
            double extension = A.price - D.price; //--- Calculate AD extension
            if (MathAbs(extension - 1.618 * diff) <= Tolerance * diff && D.price < X.price) { //--- Verify 1.618 extension and D < X
               patternFound = true;            //--- Confirm bullish pattern
            }
         }
      }
   }
}
为识别各类形态,我们采用基于斐波那契的判定标准。首先通过 "ArraySize(pivots)"获取枢轴点总数量并存入"pivotCount";螃蟹形态需要 X、A、B、C、D 五个点位,如果检测到的枢轴点少于 5 个,则重置"g_patternFormationBar"为‑1、"g_lockedPatternX" 为 0 并直接退出。接下来从 "pivots" 数组中提取最新的五个枢轴点,分别赋值给 "X"(最早点位)、"A"、"B"、"C"、"D"(最新点位),用来代表形态结构。
接下来校验看跌螃蟹形态:校验点位序列(X 为高点、A 为低点、B 为高点、C 为低点、D 为高点);计算 XA 波段价差(X.price‑A.price)并确保结果为正数;计算理论 B 点价格为 "A.price + 0.618 * diff",并通过MathAbs函数确认实际 B 点偏差不超过 "Tolerance * diff";随后校验 BC 波段(为 AB 波段的 0.382‑0.886 倍)以及 AD 延伸段(XA 的 1.618 倍,且 D 点位于 X 点上方);全部条件满足则将 "patternFound" 置为 true。最后校验看涨螃蟹形态(X 低点、A 高点、B 低点、C 高点、D 低点);XA 价差计算为 "A.price‑X.price" 并保证为正数;校验 B 点处于 0.618 回撤位,BC 波段处于 AB 的 0.382‑0.886 区间,AD 为 XA 的 1.618 倍延伸且 D 点低于 X 点;校验通过则将 "patternFound" 置为 true。如果识别到形态,就可以在图表上对其进行可视化绘制。
string patternType = "";                                                //--- Initialize pattern type
if (patternFound) {                                                     //--- Check if pattern detected
   if (D.price > X.price) patternType = "Bearish";                      //--- Set bearish pattern (sell signal)
   else if (D.price < X.price) patternType = "Bullish";                 //--- Set bullish pattern (buy signal)
}
if (patternFound) {                                                     //--- Process valid Crab pattern
   Print(patternType, " Crab pattern detected at ", TimeToString(D.time, TIME_DATE|TIME_MINUTES|TIME_SECONDS)); //--- Log pattern detection
   string signalPrefix = "CR_" + IntegerToString(X.time);               //--- Generate unique prefix for objects
   color triangleColor = (patternType == "Bullish") ? clrBlue : clrRed; //--- Set triangle color based on pattern
   DrawTriangle(signalPrefix + "_Triangle1", X.time, X.price, A.time, A.price, B.time, B.price, triangleColor, 2, true, true); //--- Draw XAB triangle
   DrawTriangle(signalPrefix + "_Triangle2", B.time, B.price, C.time, C.price, D.time, D.price, triangleColor, 2, true, true); //--- Draw BCD triangle
}
为了在图表上对识别出的形态做分类与可视化,我们初始化空字符串 "patternType",用来存储形态是看涨还是看跌。当 "patternFound" 等于 true 时,对比 D.price 与 X.price 判断形态类型:D 点高于 X 点,"patternType" 赋值为 "Bearish"(代表卖出信号);D 点低于 X 点则赋值为 "Bullish"(代表买入信号)。接下来,确认存在有效螃蟹形态后,调用Print输出日志,打印形态类型以及 D 枢轴点时间,使用 TimeToString 格式化输出日期、分钟、秒。
最后生成唯一标识 "signalPrefix",由字符串 "CR"拼接转为字符串格式的 X.time 得到;看涨形态三角形颜色设为蓝色,看跌形态设为红色;两次调用 DrawTriangle 函数渲染形态:第一次绘制 XAB 三角形(连接 X、A、B),第二次绘制 BCD 三角形(连接 B、C、D);对象名称使用 signalPrefix 分别拼接后缀"_Triangle1"与"_Triangle2",传入对应枢轴点时间、价格、三角形颜色、线宽 2,开启填充与背景绘制;确保识别到的螃蟹形态清晰可见,辅助交易决策。这是我们当前完成的阶段性效果。
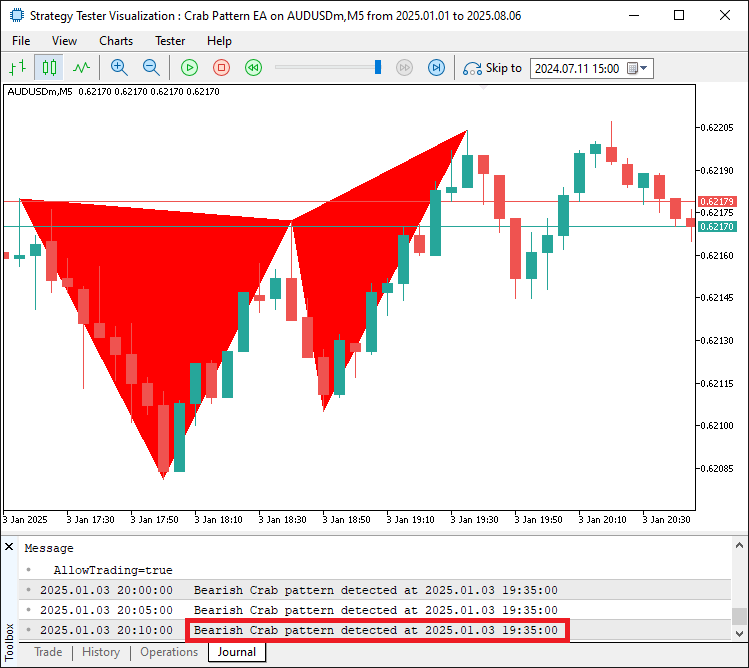
从图像中可以看出,我们能够正确地映射和可视化检测到的形态。接下来我们需要继续补充趋势线,使整个形态轮廓更加完整清晰,同时增加文本标签,方便识别各个价位。
DrawTrendLine(signalPrefix + "_TL_XA", X.time, X.price, A.time, A.price, clrBlack, 2, STYLE_SOLID); //--- Draw XA trend line
DrawTrendLine(signalPrefix + "_TL_AB", A.time, A.price, B.time, B.price, clrBlack, 2, STYLE_SOLID); //--- Draw AB trend line
DrawTrendLine(signalPrefix + "_TL_BC", B.time, B.price, C.time, C.price, clrBlack, 2, STYLE_SOLID); //--- Draw BC trend line
DrawTrendLine(signalPrefix + "_TL_CD", C.time, C.price, D.time, D.price, clrBlack, 2, STYLE_SOLID); //--- Draw CD trend line
DrawTrendLine(signalPrefix + "_TL_XB", X.time, X.price, B.time, B.price, clrBlack, 2, STYLE_SOLID); //--- Draw XB trend line
DrawTrendLine(signalPrefix + "_TL_BD", B.time, B.price, D.time, D.price, clrBlack, 2, STYLE_SOLID); //--- Draw BD trend line
double point = SymbolInfoDouble(_Symbol, SYMBOL_POINT); //--- Retrieve symbol point size
double offset = 15 * point;                    //--- Calculate label offset (15 points)
double textY_X = X.isHigh ? X.price + offset : X.price - offset; //--- Set X label Y coordinate
double textY_A = A.isHigh ? A.price + offset : A.price - offset; //--- Set A label Y coordinate
double textY_B = B.isHigh ? B.price + offset : B.price - offset; //--- Set B label Y coordinate
double textY_C = C.isHigh ? C.price + offset : C.price - offset; //--- Set C label Y coordinate
double textY_D = D.isHigh ? D.price + offset : D.price - offset; //--- Set D label Y coordinate
DrawTextEx(signalPrefix + "_Text_X", "X", X.time, textY_X, clrBlack, 11, X.isHigh); //--- Draw X pivot label
DrawTextEx(signalPrefix + "_Text_A", "A", A.time, textY_A, clrBlack, 11, A.isHigh); //--- Draw A pivot label
DrawTextEx(signalPrefix + "_Text_B", "B", B.time, textY_B, clrBlack, 11, B.isHigh); //--- Draw B pivot label
DrawTextEx(signalPrefix + "_Text_C", "C", C.time, textY_C, clrBlack, 11, C.isHigh); //--- Draw C pivot label
DrawTextEx(signalPrefix + "_Text_D", "D", D.time, textY_D, clrBlack, 11, D.isHigh); //--- Draw D pivot label
datetime centralTime = (X.time + B.time) / 2;                                       //--- Calculate central label time
double centralPrice = D.price;                                                      //--- Set central label price
if (ObjectCreate(0, signalPrefix + "_Text_Center", OBJ_TEXT, 0, centralTime, centralPrice)) { //--- Create central pattern label
   ObjectSetString(0, signalPrefix + "_Text_Center", OBJPROP_TEXT, patternType == "Bullish" ? "Bullish Crab" : "Bearish Crab"); //--- Set pattern name
   ObjectSetInteger(0, signalPrefix + "_Text_Center", OBJPROP_COLOR, clrBlack);     //--- Set text color
   ObjectSetInteger(0, signalPrefix + "_Text_Center", OBJPROP_FONTSIZE, 11);        //--- Set font size
   ObjectSetString(0, signalPrefix + "_Text_Center", OBJPROP_FONT, "Arial Bold");   //--- Set font type
   ObjectSetInteger(0, signalPrefix + "_Text_Center", OBJPROP_ALIGN, ALIGN_CENTER); //--- Center-align text
}
为了描绘形态结构,我们继续添加线段和标签。首先调用 "DrawTrendLine" 函数,传入唯一的 "signalPrefix" 标识,绘制六条趋势线连接关键枢轴点:XA、AB、BC、CD、XB 以及 BD;每条线条的端点由对应枢轴点的时间与价格定义(例如 "X.time"、"X.price"),线条颜色为 "clrBlack" 黑色,线宽 2,STYLE_SOLID代表实线样式,勾勒出 XABCD 整体结构与辅助波段。接下来计算标签偏移量:通过 "SymbolInfoDouble(_Symbol, SYMBOL_POINT)"获取品种的 point 最小报价单位并乘以 15;依据每个枢轴点是波段高点("isHigh"为 true)还是波段低点,对偏移量做加减运算,得到各个点位标签的 Y 轴坐标("textY_X"、"textY_A"、"textY_B"、"textY_C"、"textY_D"),保证高点的标签显示在价格上方,低点标签显示在价格下方。
然后调用 "DrawTextEx" 为 X、A、B、C、D 枢轴点生成文本标签;每个标签都使用 "signalPrefix" 搭配 "_Text_X" 这类后缀作为对象名,显示对应点位字母;定位在枢轴点时间与经过偏移调整后的 Y 坐标,颜色 "clrBlack",字号 11,并依据枢轴点的 "isHigh" 状态设置锚点。最后计算中心标签位置:"centralTime" 取 "X.time" 与 "B.time" 的中间时刻,"centralPrice" 使用 "D.price";调用ObjectCreate创建文本对象,对象名称为 "signalPrefix + '_Text_Center'";根据 "patternType" 把OBJPROP_TEXT文本内容设置为 "Bullish Crab" 或者 "Bearish Crab";再通过ObjectSetString与 "ObjectSetInteger" 配置属性:"OBJPROP_COLOR" 设为 "clrBlack","OBJPROP_FONTSIZE" 字号 11,"OBJPROP_FONT" 字体为 "Arial Bold","OBJPROP_ALIGN" 对齐方式为 "ALIGN_CENTER" 居中。以上操作可以在图表上完整展示螃蟹形态的结构与形态类型。运行程序后,我们可以得到如下可视化效果。
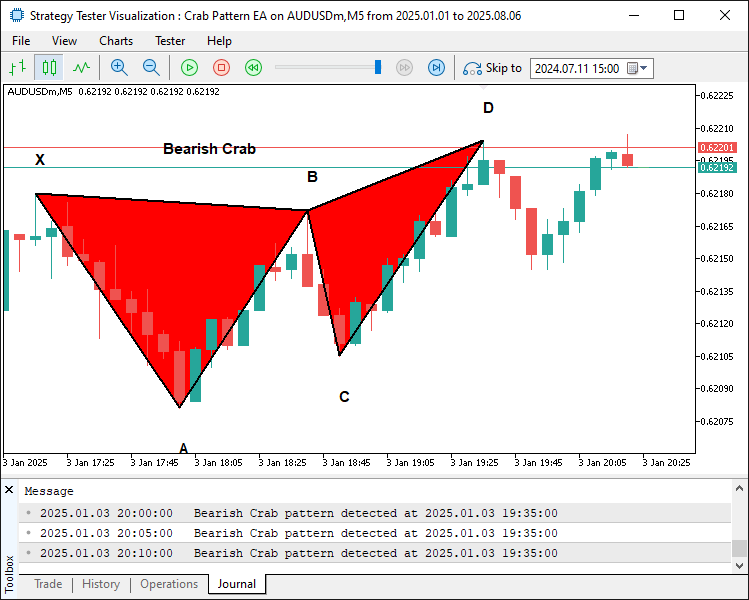
从图像中可以看出,我们已经为形态添加了边框和标签,使其展示效果更完整,也更具说明性。接下来我们需要做的是确定该形态的交易价位。
datetime lineStart = D.time;                                     //--- Set start time for trade level lines
datetime lineEnd = D.time + PeriodSeconds(_Period) * 2;          //--- Set end time for trade level lines
double entryPriceLevel, TP1Level, TP2Level, TP3Level, tradeDiff; //--- Declare trade level variables
if (patternType == "Bullish") {                                  //--- Handle bullish trade levels
   entryPriceLevel = SymbolInfoDouble(_Symbol, SYMBOL_ASK);      //--- Set entry at ask price
   TP3Level = C.price;                                           //--- Set TP3 at C pivot price
   tradeDiff = TP3Level - entryPriceLevel;                       //--- Calculate total trade distance
   TP1Level = entryPriceLevel + tradeDiff / 3;                   //--- Set TP1 at 1/3 of distance
   TP2Level = entryPriceLevel + 2 * tradeDiff / 3;               //--- Set TP2 at 2/3 of distance
} else {                                                         //--- Handle bearish trade levels
   entryPriceLevel = SymbolInfoDouble(_Symbol, SYMBOL_BID);      //--- Set entry at bid price
   TP3Level = C.price;                                           //--- Set TP3 at C pivot price
   tradeDiff = entryPriceLevel - TP3Level;                       //--- Calculate total trade distance
   TP1Level = entryPriceLevel - tradeDiff / 3;                   //--- Set TP1 at 1/3 of distance
   TP2Level = entryPriceLevel - 2 * tradeDiff / 3;               //--- Set TP2 at 2/3 of distance
}
DrawDottedLine(signalPrefix + "_EntryLine", lineStart, entryPriceLevel, lineEnd, clrMagenta);  //--- Draw entry level line
DrawDottedLine(signalPrefix + "_TP1Line", lineStart, TP1Level, lineEnd, clrForestGreen);       //--- Draw TP1 level line
DrawDottedLine(signalPrefix + "_TP2Line", lineStart, TP2Level, lineEnd, clrGreen);             //--- Draw TP2 level line
DrawDottedLine(signalPrefix + "_TP3Line", lineStart, TP3Level, lineEnd, clrDarkGreen);         //--- Draw TP3 level line
datetime labelTime = lineEnd + PeriodSeconds(_Period) / 2;                                     //--- Set time for trade level labels
string entryLabel = patternType == "Bullish" ? "BUY (" : "SELL (";                             //--- Start entry label text
entryLabel += DoubleToString(entryPriceLevel, _Digits) + ")";                                  //--- Append entry price
DrawTextEx(signalPrefix + "_EntryLabel", entryLabel, labelTime, entryPriceLevel, clrMagenta, 11, true); //--- Draw entry label
string tp1Label = "TP1 (" + DoubleToString(TP1Level, _Digits) + ")";                           //--- Create TP1 label text
DrawTextEx(signalPrefix + "_TP1Label", tp1Label, labelTime, TP1Level, clrForestGreen, 11, true); //--- Draw TP1 label
string tp2Label = "TP2 (" + DoubleToString(TP2Level, _Digits) + ")";                           //--- Create TP2 label text
DrawTextEx(signalPrefix + "_TP2Label", tp2Label, labelTime, TP2Level, clrGreen, 11, true);     //--- Draw TP2 label
string tp3Label = "TP3 (" + DoubleToString(TP3Level, _Digits) + ")";                           //--- Create TP3 label text
DrawTextEx(signalPrefix + "_TP3Label", tp3Label, labelTime, TP3Level, clrDarkGreen, 11, true); //--- Draw TP3 label
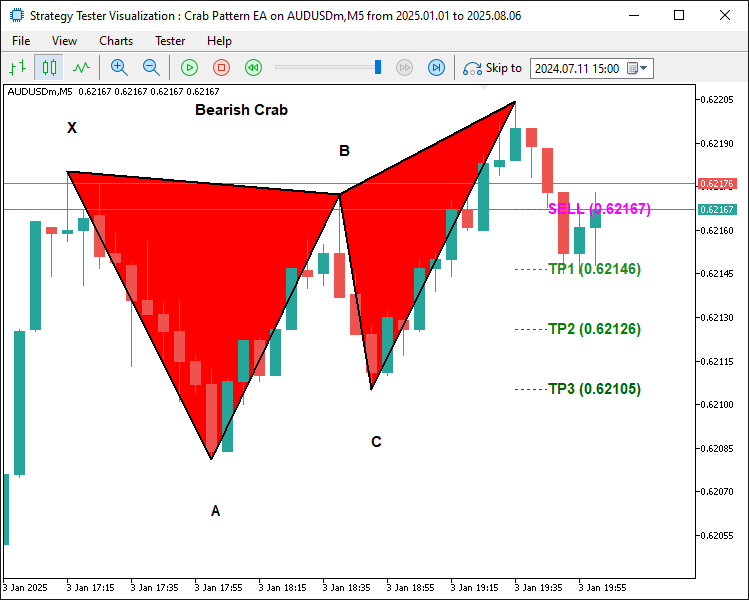
此处我们继续为已识别出的形态定义并可视化交易价位。首先将 "lineStart" 赋值为 D 枢轴点的时间 "D.time",借助 "PeriodSeconds(_Period) * 2"把"lineEnd"设置为往后两个周期的时刻;同时声明交易计算所需变量:"entryPriceLevel"、"TP1Level"、"TP2Level"、"TP3Level"以及"tradeDiff"。对于看涨形态("patternType == 'Bullish'"),通过SymbolInfoDouble将 "entryPriceLevel" 设置为当前 Ask 价,"TP3Level" 赋值为 C 枢轴点价格;"tradeDiff" 计算为 "TP3Level - entryPriceLevel";"TP1Level" 与 "TP2Level" 分别为入场价加上 "tradeDiff" 的 1/3、2/3。若是看跌形态,则取用当前 Bid 价,"TP3Level" 同样设为 C 点价格,"tradeDiff" 等于 "entryPriceLevel - TP3Level";"TP1Level"、"TP2Level" 由入场价分别减去价差的 1/3、2/3 得到。
接下来调用 "DrawDottedLine" 绘制四条水平虚线:品红色的入场价位线位于 "entryPriceLevel";止盈线分别在 "TP1Level"(森林绿)、"TP2Level"(绿色)、"TP3Level"(深绿色);所有线条时间范围从 "lineStart" 延伸至 "lineEnd"。最后将 "labelTime" 设置为 "lineEnd" 再加上半个周期;通过DoubleToString格式化价格生成标签文本,例如入场位显示 “BUY (价格)” 或 “SELL (价格)”、止盈位显示 “TP1 (价格)” 等;调用 "DrawTextEx" 在 "labelTime" 位置绘制标签,使用对应颜色、字号 11,标签锚定在各价位线上方。编译完成后,我们得到了以下结果。
看跌形态:
看涨形态:
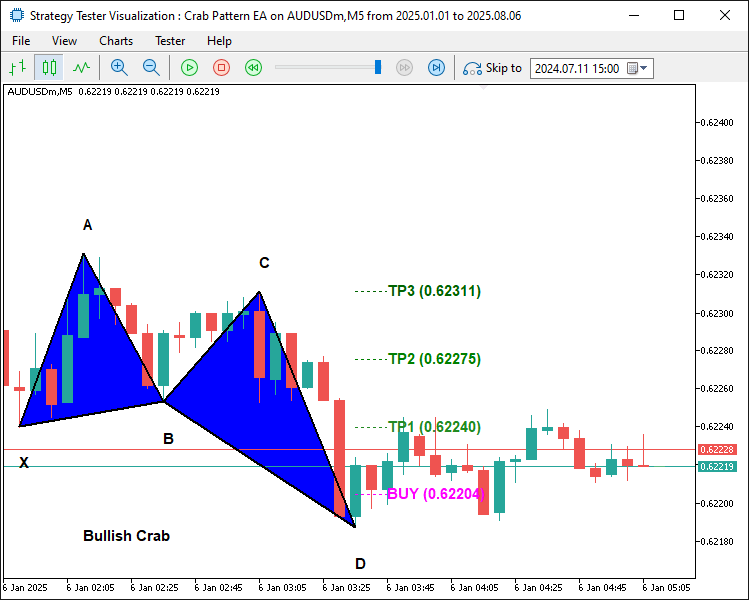
从图像中可以看出,我们已经正确地绘制了交易价位。现在我们需要做的就是启动实际交易仓位,仅此而已。
int currentBarIndex = Bars(_Symbol, _Period) - 1;       //--- Retrieve current bar index
if (g_patternFormationBar == -1) {                      //--- Check if no pattern is locked
   g_patternFormationBar = currentBarIndex;             //--- Lock current bar as formation bar
   g_lockedPatternX = X.time;                           //--- Lock X pivot time
   Print("Pattern detected on bar ", currentBarIndex, ". Waiting for confirmation on next bar."); //--- Log detection
   return;                                              //--- Exit function
}
if (currentBarIndex == g_patternFormationBar) {         //--- Check if still on formation bar
   Print("Pattern is repainting; still on locked formation bar ", currentBarIndex, ". No trade yet."); //--- Log repainting
   return;                                              //--- Exit function
}
if (currentBarIndex > g_patternFormationBar) {          //--- Check if new bar after formation
   if (g_lockedPatternX == X.time) {                    //--- Verify same X pivot for confirmation
      Print("Confirmed pattern (locked on bar ", g_patternFormationBar, "). Opening trade on bar ", currentBarIndex, "."); //--- Log confirmed pattern
      g_patternFormationBar = currentBarIndex;          //--- Update formation bar to current
      if (AllowTrading && !PositionSelect(_Symbol)) {   //--- Check trading allowed and no open position
         double entryPriceTrade = 0, stopLoss = 0, takeProfit = 0; //--- Declare trade parameters
         point = SymbolInfoDouble(_Symbol, SYMBOL_POINT); //--- Update point value
         bool tradeResult = false;                      //--- Initialize trade result flag
         if (patternType == "Bullish") {                //--- Process bullish trade
            entryPriceTrade = SymbolInfoDouble(_Symbol, SYMBOL_ASK); //--- Set entry at ask price
            double diffTrade = TP2Level - entryPriceTrade; //--- Calculate trade distance
            stopLoss = entryPriceTrade - diffTrade * 3; //--- Set stop loss (3x distance)
            takeProfit = TP2Level;                      //--- Set take profit at TP2
            tradeResult = obj_Trade.Buy(LotSize, _Symbol, entryPriceTrade, stopLoss, takeProfit, "Crab Signal"); //--- Execute buy trade
            if (tradeResult) {                          //--- Check trade success
               Print("Buy order opened successfully."); //--- Log successful buy
            } else {                                    //--- Handle trade failure
               Print("Buy order failed: ", obj_Trade.ResultRetcodeDescription()); //--- Log failure reason
            }
         } else if (patternType == "Bearish") {         //--- Process bearish trade
            entryPriceTrade = SymbolInfoDouble(_Symbol, SYMBOL_BID); //--- Set entry at bid price
            double diffTrade = entryPriceTrade - TP2Level; //--- Calculate trade distance
            stopLoss = entryPriceTrade + diffTrade * 3; //--- Set stop loss (3x distance)
            takeProfit = TP2Level;                      //--- Set take profit at TP2
            tradeResult = obj_Trade.Sell(LotSize, _Symbol, entryPriceTrade, stopLoss, takeProfit, "Crab Signal"); //--- Execute sell trade
            if (tradeResult) {                          //--- Check trade success
               Print("Sell order opened successfully."); //--- Log successful sell
            } else {                                    //--- Handle trade failure
               Print("Sell order failed: ", obj_Trade.ResultRetcodeDescription()); //--- Log failure reason
            }
         }
      } else {                                          //--- Trading not allowed or position exists
         Print("A position is already open for ", _Symbol, ". No new trade executed."); //--- Log no trade
      }
   } else {                                            //--- Pattern has changed
      g_patternFormationBar = currentBarIndex;         //--- Update formation bar
      g_lockedPatternX = X.time;                       //--- Update locked X pivot
      Print("Pattern has changed; updating lock on bar ", currentBarIndex, ". Waiting for confirmation."); //--- Log pattern change
      return;                                          //--- Exit function
   }
}
} else {                                               //--- No valid pattern detected
   g_patternFormationBar = -1;                         //--- Reset formation bar
   g_lockedPatternX = 0;                               //--- Reset locked X pivot
}
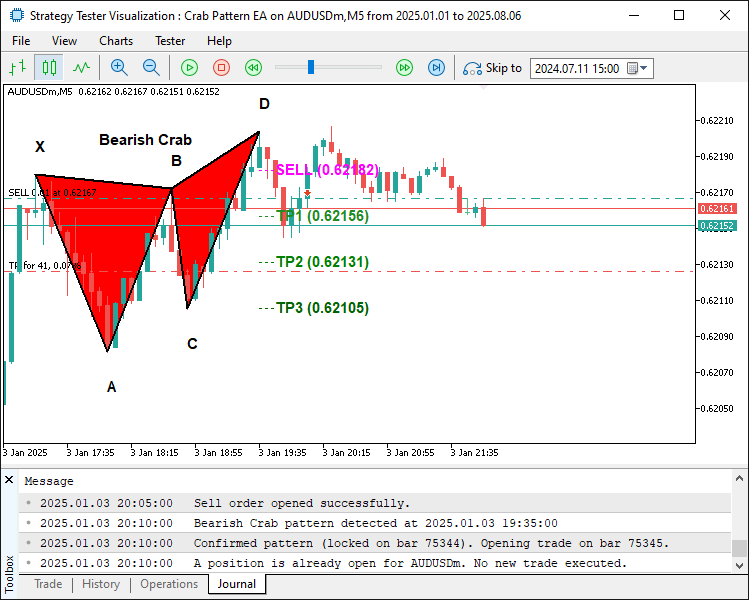
首先通过 "Bars(_Symbol, _Period) - 1"获取当前 K 线索引,并存入"currentBarIndex"。如果尚未锁定任何形态("g_patternFormationBar == -1"),就将 "g_patternFormationBar" 赋值为 "currentBarIndex",把 X 枢轴点时间 "X.time" 锁定保存到 "g_lockedPatternX",打印日志提示等待形态确认,随后退出。如果仍然处在形态形成的同一根 K 线("currentBarIndex == g_patternFormationBar"),打印日志说明形态存在重绘,直接退出,避免过早触发交易。
当已经生成新 K 线("currentBarIndex > g_patternFormationBar"),并且 X 枢轴点与 "g_lockedPatternX" 匹配时,确认该形态并输出日志,更新 "g_patternFormationBar";再通过 "AllowTrading" 检查是否允许交易,并借助PositionSelect确认当前没有持仓。对于看涨形态,将 "entryPriceTrade" 设置为当前 Ask 价,计算 "diffTrade" 等于 "TP2Level - entryPriceTrade",把止损位设置为该价差的三倍距离下方,止盈设置为 "TP2Level";调用 "obj_Trade.Buy" 执行买入,传入手数 "LotSize" 与注释 "Crab Signal",打印交易成功或失败日志。对于看跌形态,则取用当前 Bid 价,止损设置为价差三倍距离的上方,调用 "obj_Trade.Sell" 执行卖出。如果不允许交易或者已有持仓,则输出日志说明不执行交易。如果形态发生变化,则更新锁定信息继续等待。如果没有识别到形态,则重置 "g_patternFormationBar" 与 "g_lockedPatternX"。以此保证只有经过确认的螃蟹形态才会触发交易,并配套严谨的风险管控。
//+------------------------------------------------------------------+
//| Expert deinitialization function                                 |
//+------------------------------------------------------------------+
void OnDeinit(const int reason) {
   ObjectsDeleteAll(0, "CR_");                    //--- Remove all chart objects with "CR_" prefix
   ArrayResize(pivots, 0);                        //--- Clear pivots array
   g_patternFormationBar = -1;                    //--- Reset pattern formation bar index
   g_lockedPatternX = 0;                          //--- Reset locked pattern X pivot time
   ChartRedraw(0);                                //--- Redraw chart to reflect changes
}
此处我们实现OnDeinit事件处理函数,保证 EA 从图表移除时可以完成正确的资源清理工作。首先使用ObjectsDeleteAll删除所有以 "CR_" 为前缀的图表对象,清除螃蟹形态相关的三角形、趋势线、标签等可视化元素。然后通过ArrayResize将 "pivots" 数组大小置为 0,清空已存储的拐点数据。接下来把 "g_patternFormationBar" 重置为‑1、"g_lockedPatternX" 重置为 0,清空形态跟踪变量。最后调用ChartRedraw刷新图表,确保图表同步体现所有对象与数据已被清除。以此实现干净的退出逻辑,释放资源,避免产生残留图表元素。编译完成后,我们得到了以下结果。
看跌信号:
看涨信号:
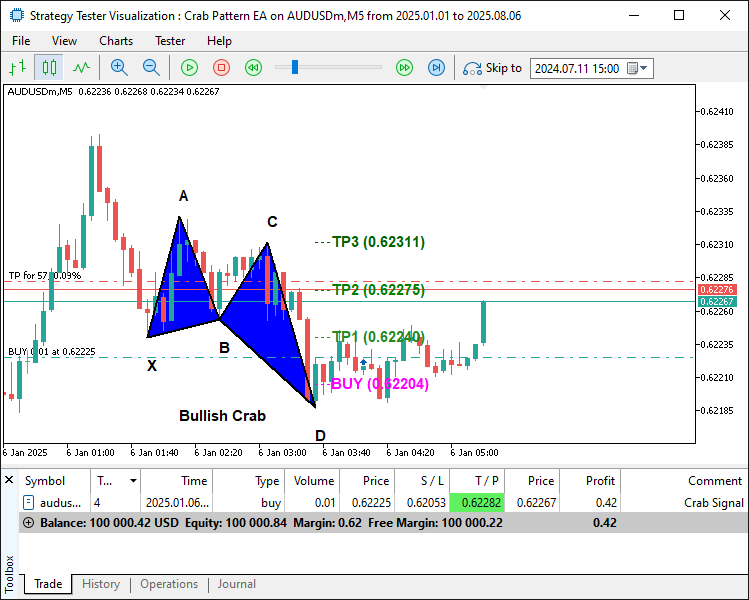
从截图可以看到,我们能够绘制出谐波形态,并且在形态确认后执行对应的交易,由此完成了对该形态识别、绘图以及自动化交易的设计目标。剩下的事情就是对该程序进行回测,这将在下一节中处理。
回测
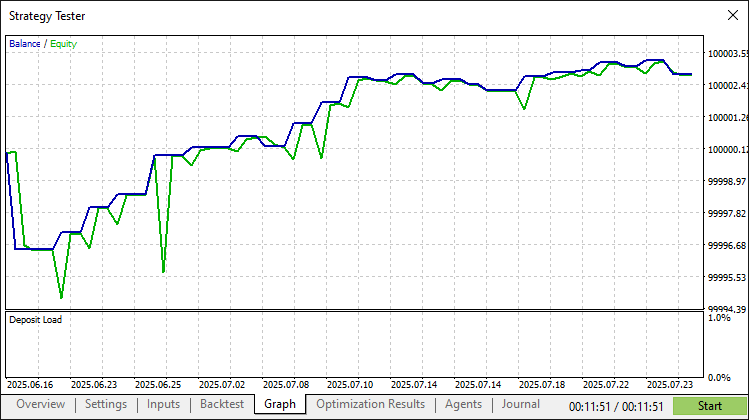
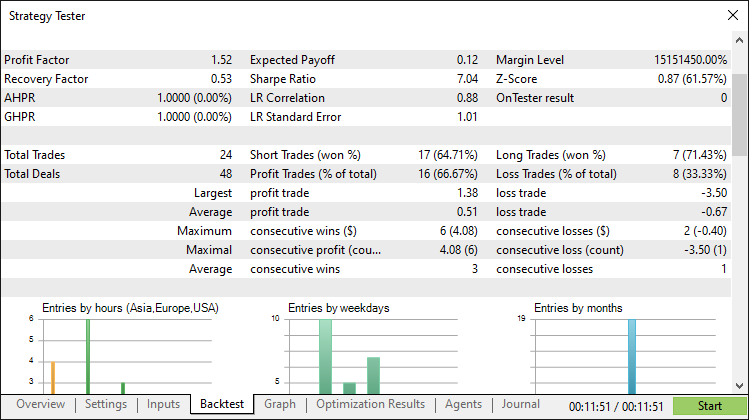
经过彻底的回测后,我们得到以下结果。
回测结果图形:
回测报告:
结论
总而言之,我们在 MQL5 中开发完成了一套螃蟹形态交易系统,依托价格行为,结合精确的斐波那契比率识别看涨与看跌螃蟹谐波形态;系统自动执行交易,计算入场位、止损位与多级止盈位,并通过三角形、趋势线这类动态图表对象完成形态可视化展示。
免责声明:本文仅用于教学目的。交易存在重大财务风险,市场波动可能导致亏损。在将本程序应用于实盘交易前,充分的回测与严谨的风险管理至关重要。
借助本文介绍的思路与代码实现,你可以将这套螃蟹形态交易系统改造适配为符合自身交易风格的版本,以此完善你的算法交易策略。祝您交易愉快!
本文由MetaQuotes Ltd译自英文
原文地址: https://www.mql5.com/en/articles/19099
注意: MetaQuotes Ltd.将保留所有关于这些材料的权利。全部或部分复制或者转载这些材料将被禁止。
本文由网站的一位用户撰写,反映了他们的个人观点。MetaQuotes Ltd 不对所提供信息的准确性负责,也不对因使用所述解决方案、策略或建议而产生的任何后果负责。

 利用深度强化学习优化Ilan智能交易系统
 价格行为分析工具包开发(第三十六部分):实现Python直接读取MetaTrader 5行情数据流

 MQL5自动化交易策略(第二十六部分):构建针形K线均价加仓的多持仓交易系统

根本没什么 :-)
右侧突起扩大了1.68倍,也就是说还是那个蝴蝶形态,只是额外增加了一个斐波那契位。如果你要实现的话,代码完全一样。
任何形态的关键不在于代码,而在于信号。
不同形态的信号类型各不相同——这意味着一种形态适用于某种情况,而另一种形态则适用于另一种情况。
任何模式都不是关于代码的,而是关于信号的。
模式的信号类型各不相同——这意味着一种模式适用于某种情况,而另一种模式则适用于另一种情况。
……而结果依然是50/50
这篇文章讲的是交易模式,而不是信号的哲学。
信号哲学早已被阐述、演绎并极其通俗易懂地解释过,例如在经典电影《华尔街之狼》中,马克·汉恩与乔丹·贝尔福特的对话就体现了这一点:
俄语配音版视频请见此处:https://www.youtube.com/watch?v=fRVwyZ6t7Fk&t=112s
引文:“没人知道股价是会上涨、下跌、横盘还是打转——这一切都是胡默尔,是海默拉,只有胡默尔才能理解它。”
……而结果依然是50/50
只是除了该模式发出的一个信号之外——还有一系列不同类型的信号(进场/出场信号、过滤信号),还有资金管理策略——最终,实际结果的概率远非50/50
已发布文章:《MQL5中的交易策略自动化(第27部分):创建带有视觉信号的“螃蟹”谐波价格走势模式》:
作者:Allan Munene Mutiiria