Guarda i video tutorial del Market su YouTube
Come acquistare un Robot di Trading o un indicatore
Esegui il tuo EA
hosting virtuale
hosting virtuale
Prova un indicatore/robot di trading prima di acquistarlo
Vuoi guadagnare nel Market?
Come presentare un prodotto per venderlo con successo
Nuovi Expert Advisors e Indicatori per MetaTrader 5 - 85

https://www.mql5.com/en/users/gedeegi/seller
GEN Smart Pulse Levels for MetaTrader 5 GEN Smart Pulse Levels is a visual indicator designed to help traders identify short-term momentum shifts and directional bias. It plots dynamic “Pulse Levels” derived from Hull Moving Average (HMA) momentum transitions. These levels act as adaptive reference points that assist in reading market structure, spotting potential reversals, and validating breakouts or false breaks. The indicator includes on-chart s

Overview
SmartComboSignalDashboard is a multi-strategy signal scanner and visual dashboard for MetaTrader 5. It combines six technical indicator combinations to detect Buy/Sell opportunities and visualize them on the chart. It includes:
Signal table with real-time updates
Push notifications (with time-frame-based throttling)
Visual on-chart entry levels (Buy/Sell stops)
Interactive buttons per strategy for toggling entry levels
Setup & Installation
Open MetaEdito

Scalping MultiTimeFrame EA is a powerful and flexible Expert Advisor developed for advanced intraday strategies including:
ScalpingRangeSystem
NeutralCandleSystem
NewsTradingSystem
RangeBreakoutSystem This EA offers dynamic trading logic that adapts to different market conditions using range detection , breakout confirmation , and configurable risk management . Key Features: Dual Timeframe Logic : Strategy execution on external timeframe (e.g., H2) Range calculati

This EA specializes in the USDJPY symbol. It aims to achieve stable trading results over the long term.
[Input Parameter] EA name :: No editing required Magic number :: No editing required Lots :: Basic trading lot BUY TP value :: TP setting point SELL TP value :: SL setting point Time_frame :: Time frame Candle differential level 1 buy :: Price change point determining BUY entry Candle differential level 1 sell :: Price change point determining SELL entry Candle differential level 2 buy :: Pr

INDICATOR: GEN Support and Resistance Pro Developer: gedeegi General Description GEN Support and Resistance Pro is a technical indicator for MetaTrader that automatically identifies support and resistance (S&R) levels using price pivot logic. It supports multi-timeframe analysis and includes a trend momentum detection system that helps traders understand current market bias with additional visual and alert tools. Main Features Automatic S&R Detection: Identifies key support and resistance levels

https://www.mql5.com/en/users/gedeegi/seller
FIBO NOVA is an indicator based on EMA + ATR/StdDev , forming Fibonacci volatility bands (0.618 – 2.618) to detect trend direction (uptrend/downtrend) , Entry signals , Take Profit (Rejection) , and Bounce (trend continuation) . It comes with pop-up alerts & push notifications , and a clean visual display with trend-colored zones. Quick Usage Guide Identify Trend Only Lower Bands active (green) → uptrend, focus on buy setups. Only Upper Bands active

#property description " ANUBIS – WHY ANUBIS ?" #property description " YOU CAN START WITH LITTLE AND MAKE A LOT OF PROFIT" #property description " CCI INDICATOR FOR TRIGGERS with thousands of filters for precise entries" #property description " Trade only at the best times or 24 hours, you choose!" #property description " Resets lot size when targets are reached" #property description " Customizable ATR BASED STOPS settings for any trading style" #property description " CREATED BY

SpectraPip – Advanced RSI Forex Algo Trading System for MetaTrader 5 Elevate your Forex trading potential with the SpectraPip Algo Trading System —an innovative, fully automated trading robot crafted for MetaTrader 5 (MT5). SpectraPip leverages the proven Relative Strength Index (RSI) strategy, seamlessly merging modern AI-mindset automation with classic technical analysis principles to provide you with robust, intelligent, and hands-free trading performance. SpectraPip is designed for traders s
WillSpread — Market Strength Indicator by Larry Williams for MetaTrader 5 !!!!!!!!!! Check out my Expert Advisor systems that also use market correlation https://www.mql5.com/ru/users/consig/seller WillSpread is a professional indicator based on Larry Williams’ proprietary methodology (a trader with decades of experience), designed to analyze the hidden strength and weakness of assets through intermarket correlations. Perfect for identifying leading signals and confirming trends. What i
FREE
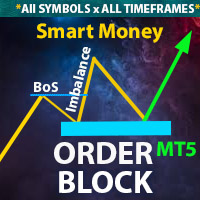
** All Symbols x All Time frames scan just by pressing scanner button ** Discount : Only 4 of 5 copy is 35$.
*** Contact me to send you instruction and add you in "Order Block group" for sharing or seeing experiences with other users. Introduction: The central banks and financial institutions mainly drive the market, Order block is considered a market behavior that indicates accumulation of orders from banks and institutions, then the market tends to make a sharp move(Imbala

ONLY 5 COPIES OUT OF 5 LEFT AT $99, NEXT PRICE $149
This EA uses a smart grid system with EMA for trend filtering, and RSI + CCI to confirm entry signals. Designed for adaptive and efficient trading in trending markets.
Feel free to DM me if you'd like to check my Myfxbook.
Recommended
Symbol: XAUUSD
Timefirm: m5
Account: Cent/STD
Minimum Balance: 30000USC/30000USD
Recommend a raw spread broker (interstellar,IC Market,Exness)
Input Setting digit_gold : Set the number of digits for gold symb
tak.VWAP – Volume Weighted Average Price A reliable and lightweight VWAP indicator designed for traders who require flexibility and visual clarity. Key Features: Two calculation modes: Rolling VWAP: Based on a configurable number of candles. Daily VWAP: Automatically resets at the start of each trading day. Fully customizable line style : color, width, visibility, and line type. Clean input structure with grouped sections for ease of use. EA-friendly : exposes buffer for use in Expert Advisors

Auto BreakEven Pro is a lightweight, no-nonsense Expert Advisor designed to automatically move your Stop Loss to breakeven once your trade reaches a predefined profit level. This EA is ideal for traders who want to protect profits without constantly monitoring the charts.
Key Features: Automatically sets Stop Loss to break-even after a custom number of pips in profit. Optional break-even offset to lock in small gains (e.g., +0.5 pips). Compatible with any manual or automated strategy – simpl
FREE

Quantum Breaker PRO - Intelligent Breakout Trading System Quantum Breaker PRO is a sophisticated Expert Advisor crafted with passion and precision to capitalize on market breakouts with surgical accuracy. This isn't just another EA - it's a complete trading system designed to identify and trade the most profitable breakout opportunities in the market.
Key Features Smart Breakout Detection Automatically identifies recent swing highs and lows using advanced algorithms Places strategic buy-st

AT Break - Smart Breakout Points Indicator General Description The AT Break indicator is an advanced technical analysis tool for the MetaTrader 5 platform, designed based on detecting breakouts of resistance and support levels. This indicator uses sophisticated algorithms to identify potential entry and exit points and displays them visually on the chart. Main Settings Parameter Description Range/Options Default Price Type Determines the price type used for calculations Close, Open, High, Lo

AutoVerse EA – Your All-in-One, Fully Customizable Trading Solution AutoVerse EA is a powerful and intuitive expert advisor designed for traders who want full control over their strategy without writing a single line of code.
With a visual interface , integrated strategy builder , and smart multi-currency support , AutoVerse EA adapts to your trading style — not the other way around. Key Features : Strategy Customization : Build your own strategy using visual signal combinations and advanc

Introduction Copytrade Online is a powerful EA tool that helps you automatically copy trades from a Master account to Slave accounts on MetaTrader 4/5 (MT4/MT5) platforms. The EA ensures fast, secure, and easy trade transmission, suitable for both individuals and trading groups. Copy online via the internet from an MT4/MT5 account on one computer to MT4/MT5 accounts on multiple other computers. Key Features Automatically copy trades from the Master account to multiple Slave accounts. Supports b

Alpha V1: Your Automated, Disciplined Trading Partner
This expert advisor relies on the hypothesis that, for a specific financial asset (like USD/JPY or the NASDAQ index), there are statistically significant patterns based on the time of day or day of the week. For example, a hypothesis might be "The NASDAQ tends to rise between 4 AM and 10 AM server time on Wednesdays and Fridays." The Alpha V1 is the tool to test and exploit such a hypothesis. Its success is entirely dependent on whether th

RSIBandsTREND is a custom trend-focused indicator that enhances the classic RSI approach by visualizing dynamic upper and lower bands based on RSI calculations.
It plots three clean bands (upper, lower, and midline) directly on the chart, helping traders identify overbought and oversold zones with precision. Features: Three-band system: upper, lower, and center RSI lines EMA-smoothed RSI band calculation Clear trend zone visualization on chart Works on all timeframes (M1 to Monthly) Fully opt

The algorithm scans the price history on a specified timeframe to identify relevant Order Blocks. Key features of EA_OB_v10.0: Intelligent analysis of Order Blocks across multiple timeframes Trend filtering using a secondary timeframe Graphical display of OB zones on the chart for better readability Flexible configuration for entry, Stop Loss, Take Profit, trailing stop, risk management, etc. Built-in protection against excessive losses (daily or cumulative) Optimized examples provided for XAUUS

FusionPro v1.1 Beta - Multi-Strategy News-Aware EA ️ CONSERVATIVE Multi-Pair Trading System with Advanced Risk Protection LIMITED BETA RELEASE - $299 (Price increases +$100 after every 10 sales - Secure your copy now!) ️ SAFETY-FIRST TRADING APPROACH Conservative Risk Management - Maximum 0.1%-2.0% risk per pair, never risky martingale
News Event Protection - Automatically blocks trades during high-impact volatile events
Smart Position Limits - Maximum open trades cap prevents o

Free Slave Version – Remote Trade Receiver MT5.
This is the FREE Slave version of our professional Remote Trade Copier system. It allows you to receive trades from a Master account running our full Copy Trade solution. Designed for simplicity and reliability, this version is read-only and cannot send trades or operate independently.
Key Features: One-click setup – simply connect to the Master. Fast and accurate order copying. Supports all symbols, order types, and brokers. Minimal resource us
FREE

SDR26 Gold Master Mind Expert has been developed Especially for Gold XAU/USD Pair on MT5 platform and it can also works in all pairs. This Expert Advisor works good on H1 and H4 timeframe but we recomend kindly use H4 time frame for 96% to 99% accuracy and in H1 time frame it work with 80% to 92% accuracy.
SDR26 Gold Master Mind Advisor do not create overtrade it means never create multiple orders in non profit/loss direction. This Expert create a Single order at a time and will create another
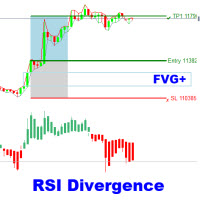
The RSI Divergence + FVG Signal indicator combines Relative Strength Index (RSI) Divergence with Fair Value Gap (FVG) detection to generate high-probability buy and sell signals based on both momentum shifts and institutional imbalance zones. Core Features: RSI Divergence Detection :
Identifies both regular and hidden bullish/bearish divergences between price and RSI. Divergences indicate potential trend reversals or continuation. FVG Zone Recognition :
Detects Fair Value Gaps (imbalances caused
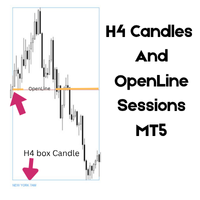
H4 Candles And OpenLine Sessions MT5 is a professional indicator for MetaTrader 5 that visualizes your trading sessions and key 4-hour candle ranges with clear, customizable boxes and stylish opening price lines. Highlight Asia , London , and New York market sessions plus up to 6 custom H4 candle ranges — each with fully adjustable colors, line styles, thickness, opacity, and labels. The powerful OpenLine feature marks the exact opening price for each session or H4 range, helping you instantly s

TradeSilent AI – Modular Autotrader with AI Relay & Market Safety TradeSilent AI is a next-generation trading system that combines artificial intelligence, modular safety layers, and dynamic risk management to deliver powerful autonomous trading on MetaTrader 5. Designed for both retail traders and prop firm challenges, it balances precision, performance, and protection. Key Features AI Signal Relay with Local Fallback Uses an external AI relay (ChatGPT-compatible) to make trade decisions b
FREE
Welcome to order block indicator – your complete solution for identifying high-probability zones using order blocks , BOS (Break of Structure) , and CHOCH (Change of Character) .
Designed for precision and speed, this tool gives you the edge in spotting potential reversal and continuation zones just like the pros.
Features : Automatic Order Block Detection: Effortlessly identifies valid bullish and bearish order blocks based on price structure and market behavior. BOS & CHOCH Detection: Buil

Smart Risk Manager Dashboard is a MetaTrader 5 indicator designed to assist traders with structured risk control and real-time account monitoring.
It provides a visual interface for managing position size, tracking losses and gains, and setting custom trading limits. Key Features SL/TP Risk Calculator
Displays estimated risk and reward directly on the chart using adjustable horizontal lines. Live Dashboard with Metrics
Shows equity, balance, daily gain/loss, trade count, and other key values i

StrikeBot AI Relay Edition
Fully autonomous trading bot with real-time ChatGPT integration & advanced grid logic. StrikeBot AI Relay Edition is the most advanced version of the StrikeBot series, equipped with full OpenAI-powered trade signal relay via local or remote endpoints. With a validated JSON-based AI communication pipeline, this bot reacts dynamically to live market conditions and adapts trade entries using sentiment-aware prompts. Key Features : Autonomous AI Control – Connect
FREE
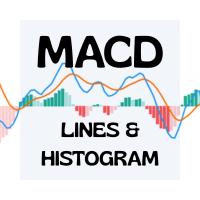
Advanced MACD Indicator with 6 Colors & Adjustable Line Thickness Elevate your trading charts with this fully customizable MACD indicator for MetaTrader 4/5. With six independent color slots and per-line thickness controls, you can tailor every element to your exact preferences. Key Features Six Separate Color Slots
Customize each component with its own color: MACD Line Signal Line Histogram Bars (Bullish) Histogram Bars (Bearish) Zero Line Adjustable Line Thickness
Choose any thickness—from e
FREE

Daily Bias Indicator with Statistics and Dashboard Unlock the power of market bias analysis with the Multi-Timeframe Bias Indicator, a versatile tool designed for traders seeking a clear edge in the markets. This indicator provides actionable insights by displaying Daily Bias, Weekly Bias, and Custom Period Bias, enabling you to align your trades with the prevailing market direction across multiple timeframes and symbols. Key Features: Daily Bias Analysis: Identify the bullish, bearish, or neutr

Mantis Shrimp Convergence (MSC) A new way to see market momentum — no lag, no confusion.
What is MSC? Mantis Shrimp Convergence (MSC) is a powerful non-repainting oscillator, inspired by the logic of MACD but rebuilt for modern trading: zero lag, no false divergences, and dual-line precision. Designed for traders who demand clarity, speed, and reliability, MSC reveals momentum shifts with unmatched visual and structural accuracy.
How it Works MSC uses two signal lines — Fast and Slow,

Rangex EA – Intelligent Range Breakout Trading with Trend Filters Rangex EA is a fully automated Expert Advisor built for traders who prefer structured, rule-based strategies. It specializes in detecting price consolidation zones (ranges) and executing trades based on breakout or reversal logic, configurable by the user. The EA adapts to various market conditions with the aid of sophisticated filters and logical risk management. IMPORTANT! After the purchase, please send me a private message to

GoldforestEA - 40X ROI Gold Trading Robot - $5K to $2M Gold Trading System | 86% Winrate
PROVEN PERFORMANCE: Turned $5,000 into $2,043,104 (40,862% ROI) EXCEPTIONAL WIN RATE: 86.12% winning trades (55,019 winners vs 8,870 losers) SMART RISK MANAGEMENT: Maximum drawdown only 2.91% (low risk mode) - keeps your account safe GOLD SPECIALIST: Optimized specifically for XAUUSD M5 timeframe
WHAT MAKES IT SPECIAL: • Advanced HeikinAshi pattern recognition • Built-in news filter to avoid

Overview This indicator automatically plots and labels major price levels from different timeframes and trading sessions—specifically, it draws horizontal lines for the high and low of the: Asia session London session Previous day Weekly and monthly periods It features strong visual and functional customization—each level group can be toggled on or off, colored or styled differently, and, uniquely, each type of level can trigger real-time price alerts when price approaches or crosses these k
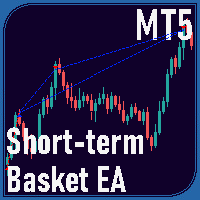
Overview Short-Term Basket EA MT5 is an Expert Advisor for the MetaTrader 5 platform, designed to manage a sequence of trades with a basket trading strategy, aiming to achieve a specified profit target. Features Opens an initial trade in a user-specified direction. Reopens a trade in the same direction with the same lot size and target if the previous trade closes in profit. Opens a hedge trade in the opposite direction with the same lot size and target, plus an additional trade in the opposite

AlertTrader Overview AlertTrader is a powerful MetaTrader 5 (MT5) Expert Advisor (EA) designed to automate trading based on alerts generated by the Trend Catcher indicator. This EA listens for alert messages, parses the trade details (symbol, buy/sell signal, price, stop loss, and take profit), and executes trades accordingly, ensuring precision and efficiency. Key Features Automated Trade Execution : Places buy or sell orders based on Trend Catcher alerts. Customizable Lot Size : Adjust the lot
*Quantum Core MT5 - AI-Powered Swing Trading EA for XAUUSD (Gold)**
**PROFESSIONAL | SAFE | LOW-FREQUENCY** A premium swing trading advisor delivering **15-30 high-quality trades/month** with advanced risk management.
**KEY FEATURES:** **AI-Enhanced Strategy**: Combines MQL5 algorithms with AI-driven market analysis for precise entries/exits. **Compounding & Auto-Lot Sizing**: Automatically adjusts position sizes based on equity growth (user-configurable). **Flexible Risk Co

Unlock Market Insights: Dynamic Trend Analysis with Statistical Precision for MT5 Are you seeking a deeper understanding of market movements? Many traditional tools may not fully capture the complex, non-linear dynamics often seen in financial markets. This can sometimes lead to uncertainty in identifying subtle trend shifts. Introducing Adaptive PolyBands Optimizer – an advanced MQL5 indicator designed to enhance your market analysis. Unlike some conventional tools, Adaptive PolyBands Optimizer

How ATR Bot Works Tracks Market Trends with Precision: ATR Bot leverages the Average True Range (ATR) to calculate a dynamic Trailing Stop, continuously adapting to market volatility. This ensures you always have a clear view of key support and resistance levels, helping you stay ahead of price movements. Delivers Clear Trading Signals: The indicator generates vivid green arrows for optimal buy opportunities and striking red arrows for sell signals, triggered when the price crosses the ATR Trail

The Alpha: Your Ultimate Trend-Tracking Powerhouse Dive into the markets with The Alpha , a dynamic MetaTrader 5 indicator that supercharges your trading with its core SuperTrend component. Built on the robust Average True Range (ATR), The Alpha delivers crystal-clear, color-coded signals to help traders of all levels conquer trends with precision and flair. How The Alpha’s Works : ATR-Powered Precision : The Alpha uses the ATR (default period: 20) and a multiplier (default: 1.5) to calculate a

Overview Stratbot is a sophisticated and highly flexible Expert Advisor designed for MetaTrader 5 that combines multiple advanced trading strategies into one powerful system. This EA is built for serious traders who demand precision, flexibility, and professional-grade risk management in their automated trading operations. Key Features & Capabilities 1. Advanced Multi-Condition Trading System 5 Customizable Conditions : Set up to 5 different trading conditions for both BUY and SELL signals

SR Zone Averager: Master Support & Resistance with Intelligent Averaging Unlock the power of multi-timeframe Support and Resistance (S&R) with the SR Zone Averager Expert Advisor . Designed for precision and adaptability, this EA intelligently identifies critical price levels across H4, Daily, and Weekly charts , providing a robust foundation for your trading decisions. SR Zone Averager doesn't just react to S&R; it optimizes entries and manages trades with an advanced averaging strategy. When p
Forex Signal Indicator — Automate Smart Pending Orders with Precision Are you tired of missing high-probability trades or struggling to manage your entries in fast-moving markets?
The Forex Signal Indicator is designed to make trading easier and smarter — even for beginners. Key Features Auto Placement of Buy Stops and Sell Stops
Automatically places pending orders at optimized zones based on market structure. Built-In Stop Loss Calculation
Calculates SL levels intelligently — no more guessing

PRICE WILL BE INCREASED TO £4999 SOON!
Knight Rider FX is a precision-engineered trading indicator that delivers highly accurate, non-repainting signals without flooding your chart. It filters out noise and selectively highlights only the highest probability trade setups. On higher timeframes, it anticipates major market reversals, while on intraday charts it pinpoints mini reversals with tactical clarity. By focusing on quality over quantity, Knight Rider FX equips traders with disciplined ent

Indicator Description: Market Session Overlay The Market Session Overlay indicator for MT5 visually highlights the key global trading sessions — Asian, European, and American — directly on your chart.
It allows traders to clearly identify the time ranges of each session and their respective highs, lows, and opening levels, improving session-based analysis and strategy execution. Features: Draws colored rectangles for each session (Asian, European, American) on the chart.
Configurable se

Discretion Assistant v1 – Manual Trading Utility for MT5 Discretion Assistant v1 is a comprehensive discretionary trading tool designed to support manual traders with visual clarity, intuitive chart overlays, and streamlined position control. It improves timing, judgment, and execution precision across all trading styles. Full Feature List (Customizable in pips and seconds) Position Control Automatic Take-Profit Placement Fixed-Width Trailing Stop ATR-Based Trailing Start Trailin

This Expert Advisor (EA) is designed for the USD/JPY pair, focusing on multi-timeframe Support and Resistance (S&R) levels to identify trading opportunities. It incorporates features like progressive lot sizing, averaging, and optional fractal analysis to enhance its trading strategy. Key Features Multi-Timeframe S&R Analysis: The EA identifies and utilizes Support and Resistance levels from H4, Daily, and Weekly timeframes for robust signal generation. Progressive Lot Sizing (Optional): When en

Unlock the Power of Institutional Trading with Precision Entry System Diablo EA is a revolutionary Expert Advisor that implements an advanced 5-Stage Key Level Sweep Strategy , designed to identify and capitalize on institutional liquidity sweeps with surgical precision. THE STRATEGY REVEALED What Makes Diablo EA Unique? Diablo EA operates on a sophisticated 5-step process that mirrors how institutional traders move markets: STEP 1: Sweep Detection Identifies precise sweeps of critical mar

This Signal Running With Fusion 1 EA
Fusion 2 EA is an Expert Advisor based on the fractal Lines Breakouts.
Although recommended pair and set files are provided, it is built with many easy-to-understand money management settings, allowing you to adjust according to market conditions as well as customize for other currency pairs as desired.
Live Signal
Key Features
- 100% Automated Trading System - Works on Any Broker (ECN Recommended) - Money Management & Risk Control Settings - User-Fri

This Expert Advisor (EA) automatically closes market orders after a specified time interval — essentially, it works as a trade timer. Use this tool when you need to automatically close trades after a certain period. Input Parameters: Only current symbol – If set to true , the EA will close only the orders for the chart's symbol. If false , it will close orders on any symbol. Timeout – The duration (in seconds) after which open orders will be closed. This EA is lightweight, easy to use, and has n
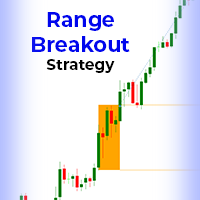
Custom Range Breakout EA (CRB) is a highly configurable breakout trading system that lets you define any price range and automate trades based on your strategy. Whether you're targeting the London open, New York session, or a custom intraday level, CRB gives you complete control over how and when to enter trades, with advanced risk tools and precise timing filters. The EA includes trailing stop, break-even logic, news filtering, day-of-week control, and more. All dynamic trade management inputs

GOBLIN EA - Advanced Fair Value Gap Strategy Professional Multi-Timeframe FVG Analysis with Automated Sweep Detection Goblin EA is a sophisticated automated trading system that specializes in Fair Value Gap (FVG) analysis across multiple timeframes. Using advanced sweep detection algorithms, Goblin identifies high-probability trading opportunities when price sweeps through established FVG zones. CORE STRATEGY Fair Value Gap Methodology Fair Value Gaps represent inefficient price movemen
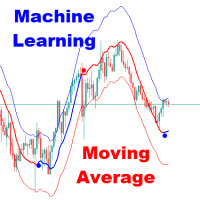
The Adaptive Gaussian Moving Average or also known as Machine Learning Moving Average (MLMA) is an advanced technical indicator that computes a dynamic moving average using a Gaussian Process Regression (GPR) model. Unlike traditional moving averages that rely on simple arithmetic or exponential smoothing, MLMA applies a data-driven, non-linear weighting function derived from the Gaussian process, allowing it to adaptively smooth the price while incorporating short-term forecasting capabilitie

Last frontier. Spartan is a premium "AI powered indicator" designed to identify the direction of price movements and potential reversal and exhaustion points. This tool is particularly beneficial for individuals seeking a clearer price movement. It can function as an enhancement to existing trading systems, operate independently, or assist in scalping strategies.
Price $499 for the first 5 customers, then it will reach $1999
Suggested time frame M1
1. Open BUY trades on arrow signal. Open SE

Murphy Order Block is a highly optimized and visually clean indicator for identifying key institutional zones based on pure market structure logic. It is designed for traders who follow Smart Money Concepts (SMC), ICT-style OB trading, and structure-based break & retest strategies.
This indicator dynamically detects and draws: - **1 valid Bullish Order Block (Buy Zone)** - **1 valid Bearish Order Block (Sell Zone)**
### Key Features:
**Market Structure-Based Logic** - Uses swing high

Clean Reversal Signals is a clean and efficient visual tool designed to highlight when price touches the upper or lower extremes of a Donchian channel (120 periods) — zones that are often critical for potential reversals or price reactions. This indicator does not generate buy or sell signals and should not be used to enter trades by itself . As the name implies, it’s an indicator — its job is to indicate , not confirm. Use it as an extra layer of confirmation within your own trading strategy .
FREE

Hello, I am HiPro_GoldMax+. My focus is on gold. In this segment I only trade XAUUSD.
IMPORTANT! After the purchase please send me a private message to receive the setup instructions.
Using compounding profit strategy to get max profits, trailing stop for sl & tp.
Minimum requirements and recommendations Broker: Any broker with a low spread.I recommend Exness. 2 decimal price quota for Gold. HiPro GoldMax is not compatible with brokers which offer a 3 decimal price quota for Gold Minimum init
KN DASHBOARD PRO – Smart Dashboard ️ Everything is displayed live on the chart: Give me a rating please
Number of open trades (Buy / Sell)
Total lot size
Daily, weekly, and monthly profit
Margin, balance, liquidity, and floating profit
Accurate real-time results monitoring system
This gives you complete control over performance without opening your trading history.
A quick breakdown of the indicator's function: This indicator displays a dashboard on the chart containin
FREE

This Tool is designed to automate one of the most critical aspects of trade management — setting and managing Stop Loss, Take Profit , and Trailing Stop levels — directly on your MetaTrader 5 platform.
Key Features:
Automatic SL, TSL and TP Placement: Instantly sets initial Stop Loss and Take Profit levels on any new position based on customizable parameters, helping to enforce disciplined risk and reward management.
Dynamic Trailing Stop: Automatically moves the Stop Loss to lock in profits
FREE

BBTrader – Adaptive Bollinger Bands Auto-Trader ( best for AUDCAD pair 1H,4H, D ) BBTrader is a fully automated trading algorithm designed for MetaTrader 5, built on a dynamic Bollinger Bands breakout and reversal strategy. The system opens trades when the price deviates significantly beyond the upper or lower bands, followed by intelligent scaling and exit mechanisms. Key features: Automated entry on strong momentum outside Bollinger Bands Dynamic scaling with increasing lot size Confi

This Expert Advisor is built for traders who want a smart, reliable, and adaptive system based on true market structure — support and resistance zones plus trendlines plus candlesticks plus stoploss (in support or resistence) . It doesn’t rely on lagging indicators, but on real price reactions across timeframes. Core Features: True Price Action Logic
Trades based on dynamic support and resistance zones plus trendlines plus candlesticks — no moving averages, no black-box formula

Description GOLD666 is a powerful, AI rule-based Expert Advisor engineered for XAUUSD on M5 , combining trend-confirmation, adaptive risk management, and institutional-grade signal filters. Built for serious traders and FTMO compatibility , this EA uses multi-layer indicator logic to enter only the highest-probability setups – and exits dynamically through partial close and trailing stop systems. Whether you're scaling prop firm accounts or trading gold manually, GOLD666 is your edge. Core

This is a USD Trading EA for USD pairs and Gold trading which is only active during the US session This trading EA works great on Gold and EURUSD Makes use of martingale and only works while the chart is on the 30 minute timeframe There is no news filter so risk should be mitigated when nearing major news events Lot sizes are adjustable and should be adjusted according to proper risk management Backtesting uses the 0.1 lot size

Algold EA5 by Algold Tech Algold EA5 is an institutional-grade Expert Advisor for Meta Trader 5, meticulously engineered to identify high-volume liquidity zones and capture market momentum at exactly the right moment fully automated, fully optimized, and fully reliable. This isn’t just an Expert Advisor.
It’s your edge in a fast-moving market a trading engine that combines advanced algorithms , intelligent money management , and exceptional customization , delivering performance that meets

The ** SmoothedTrender Indicator** is a custom MetaTrader 5 (MT5) indicator designed to display smoothed Renko bars on a chart, helping traders identify trends with reduced market noise. It transforms traditional price data into Renko bars, which are based on a user-defined price movement (brick size) rather than time, making it easier to spot significant trend changes. The indicator applies a smoothing mechanism to the price data, enhancing clarity by filtering out minor fluctuations.
### Key

指标功能说明 使用周期:M5 适用品种:所有流动性好的金融产品,推荐:黄金,BTC,指数,股票,外汇直盘货币对
此指标是价格行为学最好的辅助工具,一共包含三个主要功能 1,每个交易时段K线序列标记,对于不同的交易瓶中,你可以自由选择需要标记的时段 2,每个交易时段开盘后第一根k线的最高价和最低价范围标记 3,每个交易时段开盘后的前6根K线形成的价格区间标记以及开盘区间被突破后可能去到的目标位
指标设置说明 1,时区偏移设置:这个部分设置非常重要,加载指标时要根据自己的服务器时区设置偏移,以适应交易品种的开盘时间准确对准
BrokerTimeZoneOffset = 0; // Broker's timezone offset from UTC (hours) EnableAsia = true; // Enable Asia session marking AsiaStartTime = "01:00"; // Asia session start (HH:MM) MaxAsiaBars = 60;

Adaptive Grid Elite Pro Indicator - Professional Trading Signal Indicator Transform Your Trading with Intelligent Divergence Detection and Grid Strategy Guidance Real Trading Results Live Trading Performance https://www.mql5.com/en/signals/2322688 AGE Pro MT5 EA https://www.mql5.com/en/market/product/144042 Adaptive Grid Elite Pro Indicator is a sophisticated technical analysis indicator that combines advanced divergence detection with intelligent grid trading guidance. This indicator provides

This EA focuses on placing a large number of orders to generate rebates and secure quick profits.
It only opens trades in the direction of the trend, which is determined based on historical statistics. You can enable either Buy-only or Sell-only mode.
For gold trading, it is recommended to enable Buy-only mode. If the trade goes against the intended direction, the EA will initiate recovery trades at set intervals while also taking profits in the opposite direction.
Martingale can be enabled, wit

Hybrid Scalping & Recovery EA: Precision Entry with Martingale Grid Management Core Concept This Expert Advisor is a sophisticated, fully automated trading tool that combines a high-precision scalping strategy for initial entries with a robust Grid Martingale system for trade management and recovery. It is designed to find specific, high-probability setups on the M1 timeframe and then manage the trade to a collective profit target, even if the initial market direction is unfavorable. How It Work
Il MetaTrader Market è l'unico negozio online dove è possibile scaricare la versione demo gratuita di un robot di trading che consente di effettuare test e ottimizzazioni utilizzando dati statistici.
Leggi la descrizione dell'applicazione e le recensioni di altri clienti, scaricala direttamente sul tuo terminale e prova un robot di trading prima di acquistarlo. Solo sul MetaTrader Market è possibile testare un'applicazione in modo assolutamente gratuito.
Ti stai perdendo delle opportunità di trading:
- App di trading gratuite
- Oltre 8.000 segnali per il copy trading
- Notizie economiche per esplorare i mercati finanziari
Registrazione
Accedi
Se non hai un account, registrati
Consenti l'uso dei cookie per accedere al sito MQL5.com.
Abilita le impostazioni necessarie nel browser, altrimenti non sarà possibile accedere.