YouTubeにあるマーケットチュートリアルビデオをご覧ください
ロボットや指標を購入する
仮想ホスティングで
EAを実行
EAを実行
ロボットや指標を購入前にテストする
マーケットで収入を得る
販売のためにプロダクトをプレゼンテーションする方法
MetaTrader 5のための新しいエキスパートアドバイザーとインディケータ - 85

Nova OBV Trader is an advanced automation of the On-Balance Volume (OBV) indicator — turning raw volume dynamics into actionable trade signals. It builds on this classic momentum tool to identify when price moves are backed by real participation, not just empty fluctuations. Instead of reacting to shallow spikes or fake rallies, Nova OBV Trader focuses on the deeper flow of market pressure. When price aligns with volume, it acts decisively. When the confirmation is absent, it waits with discipli

Nova OCB Trader is a streamlined automation of the One Candle Breakout strategy — a clean, price-action method that transforms a single candle into a decisive trading opportunity. Instead of relying on lagging indicators, it focuses purely on structure: the highs and lows of a chosen candle define the breakout zone, and the EA acts when price confirms the move. This approach cuts through the noise — no clutter, no overfitting. Nova OCB Trader waits for the market to show intent, then trades the

Nova BBX Trader is a balanced automation of the Bulls and Bears Power indicators — blending the push and pull of market forces into a single, disciplined system. Where the Bulls show buying strength and the Bears reveal selling pressure, Nova BBX Trader unites them to filter out indecision and highlight only the moments when one side truly dominates. This isn’t about reacting to every flicker of movement. Nova BBX Trader waits until the battle between buyers and sellers is clear, then trades wit

Nova MFS Trader is a refined automation of the Money Flow Index (MFI) and Stochastic Oscillator — combining volume-based momentum with price-based timing for a sharper edge in entries. By uniting these two complementary indicators, the EA delivers a disciplined framework that filters out false signals and acts only when both market strength and timing align. Where the MFI tracks capital flow behind the candles, the Stochastic measures overbought and oversold conditions. Together, they create a s

Nova RSI Trader — Momentum & Structure Precision System View the Nova Live Signal Performance Now available as a fully managed signal — trades executed in real time under the same disciplined framework and risk management that powers the EA. Note: The price will increase by $10 for every 10 sales, ensuring early adopters get the best value. Nova RSI Trader automates the Relative Strength Index (RSI) — one of the most widely respected momentum indicators in trading. By combining overbought/ove

Nova AC Trader is a modern automation of the Accelerator Oscillator (AC) — a Bill Williams momentum tool designed to detect shifts in market acceleration before trends fully form. This EA transforms the indicator’s early-warning nature into a structured trading system that reacts only when momentum changes are clear and consistent. Instead of waiting for the trend to be obvious, Nova AC Trader identifies when market acceleration starts to turn — offering opportunities at the earliest stage of mo

Nova MOM Trader is a disciplined automation of the Momentum indicator — a classic tool that measures the speed and strength of price movement. This EA turns raw momentum into a structured strategy, entering trades only when the market demonstrates clear, sustained force in one direction. Rather than reacting to every small swing, Nova MOM Trader waits for genuine acceleration in price. It filters out weak moves, focusing only on trades where momentum confirms the trend and increases the probabil

Nova VOL Trader is a structured automation of the Volume indicator — a classic tool that measures market participation and the strength behind price movements. This EA transforms raw volume data into disciplined trade decisions, acting only when activity confirms momentum in a particular direction. Instead of reacting to every price fluctuation, Nova VOL Trader focuses on setups supported by real market participation. Trades are taken only when volume confirms the move, filtering out weak signal

Nova FRC Trader is a disciplined automation of the Fractals indicator — a classic tool that identifies local highs and lows to pinpoint potential reversal and breakout points. This EA transforms fractal patterns into a structured trading system, entering trades only when price confirms a meaningful shift in market structure. Instead of chasing every swing, Nova FRC Trader focuses on setups where fractals indicate a real change in momentum. Trades are executed with discipline, avoiding noise and

Nova GTR Trader is a precise automation of the Gator indicator — a Bill Williams tool designed to track market phases by analyzing convergence and divergence of trend signals. This EA turns the Gator’s visual cues into a disciplined, automated strategy that identifies when the market is trending, consolidating, or ready for a breakout. Instead of reacting to every small fluctuation, Nova GTR Trader waits for clear alignment between the indicator’s jaws, teeth, and lips. Trades are executed only

Nova DPO Trader is a structured automation of the Detrended Price Oscillator (DPO) — a tool designed to isolate short-term price cycles by filtering out long-term trends. This EA transforms the DPO’s cycle-focused signals into a disciplined trading system that acts only when momentum aligns with clear, repeatable patterns. Instead of chasing every swing, Nova DPO Trader waits for genuine cyclical signals. Trades are executed when the DPO indicates meaningful overbought or oversold conditions, re

Nova OET Trader is a disciplined automation combining the On-Balance Volume (OBV) and Exponential Moving Average (EMA) indicators — blending volume-based momentum with trend confirmation for clear, actionable trades. This EA waits for alignment between the OBV and EMA to identify setups where price moves are supported both by market participation and directional strength. Instead of reacting to every minor swing, Nova OET Trader filters out weak signals, entering trades only when both volume and

Nova MBB Trader is a disciplined automation combining the MACD and Bollinger Bands (BB) indicators — blending momentum, trend, and volatility into a structured trading system. This EA waits for the alignment of MACD signals with price behavior around the Bollinger Bands to identify high-quality entry opportunities. Instead of reacting to every market wiggle, Nova MBB Trader filters out noise, trading only when momentum, trend, and volatility all confirm the move. It focuses on setups with clear

Nova STM Trader is a disciplined automation combining the Stochastic and Simple Moving Average (SMA) indicators — blending momentum timing with trend direction for precise trading decisions. This EA acts only when both indicators align, ensuring trades occur during meaningful market moves rather than reacting to every fluctuation. Instead of chasing every swing, Nova STM Trader filters out weak signals. Trades are executed when Stochastic momentum confirms a potential move and the SMA trend ali

Nova CAT Trader is a disciplined automation combining the Commodity Channel Index (CCI) and Average True Range (ATR) indicators — blending momentum, trend, and volatility into a structured trading system. This EA acts only when the CCI signals align with price volatility measured by the ATR, ensuring trades occur during meaningful market moves rather than random fluctuations. Instead of chasing every swing, Nova CAT Trader filters out weak setups. Trades are executed when momentum, trend, and vo

Nova DNA Trader is a disciplined automation combining the Donchian Channel and Alligator indicators — blending trend detection with dynamic support/resistance levels for structured trade entries. This EA identifies clear breakout and continuation setups by tracking price relative to the Donchian Channel while confirming trend direction using the Alligator’s jaws, teeth, and lips. Instead of reacting to every price movement, Nova DNA Trader waits for confirmed alignments: trades are taken only wh

Nova HAR Trader is a disciplined automation combining Heiken Ashi and the Relative Strength Index (RSI) — blending trend smoothing with momentum confirmation for precise trade execution. This EA analyzes Heiken Ashi candles to identify clear trend direction, while RSI confirms overbought or oversold conditions to filter entries and exits. Instead of reacting to every small swing, Nova HAR Trader waits for aligned signals: trades are taken only when Heiken Ashi shows a clear trend and RSI confirm

Nova PAX Trader is a disciplined automation combining the Parabolic SAR and ADX (Average Directional Index) — blending trend direction, momentum, and timing into a structured trading system. This EA identifies setups where price is clearly trending and momentum is strong, using the Parabolic SAR for directional cues and ADX to confirm trend strength. Instead of reacting to every market fluctuation, Nova PAX Trader waits for clear alignment: trades are executed only when the Parabolic SAR indicat

Nova PCH Trader is a disciplined automation of the Price Channel — a tool that tracks dynamic upper and lower boundaries to define market structure and potential breakout or reversal points. This EA interprets the channel to identify clear trading opportunities, acting only when price interacts meaningfully with the channel edges. Instead of reacting to every market fluctuation, Nova PCH Trader waits for structured setups: trades are executed when price respects or decisively breaks the channel,

Nova KC Trader is a disciplined automation of the Keltner Channel — a volatility-based tool that defines dynamic upper, middle, and lower price levels to identify trend, breakout, and reversal opportunities. This EA interprets price action relative to the channel, executing trades only when movement confirms a meaningful interaction with the boundaries. Instead of reacting to every minor fluctuation, Nova KC Trader waits for structured setups: trades are taken when price respects or breaks the c

Trend indicators on the FOREX market are extremely useful for increasing your ability to open winning positions and for better anticipating market movements.
OPTIMISED TREND PRO is one of these indicators.
• SuperTrend PRO is available on MetaTrader 5 (MT5)
• Green/Red candles according to the trend, easy to read at a glance
• A single arrow at the start of each phase: BUY (green), SELL (red)
• The SuperTrend line helps set the stop and follow the position
• Usable on all FOREX symbols
•

GoldStar EA is a fully automated trading program (Expert Advisor) designed exclusively for trading gold (XAU/USD).
It analyzes multiple timeframes to detect high-probability trading opportunities and integrates advanced trade management tools — all while remaining easy to set up and operate . Key Advantages of GoldStar EA Advanced algorithm scanning multiple timeframes for optimal entry signals. Built-in money management and capital protection to minimize risk. Stable and consistent results ba

Golden pot pro - Expert Advisor Professional Trading System for Gold (Limited time offer- just $99) Golden pot pro is a sophisticated Expert Advisor designed for serious traders who want automated, intelligent trading with advanced risk management. This EA combines multiple proven technical indicators with smart position management to deliver consistent performance in various market conditions.This Ea works well with M10 and H1 time frames This EA uses a carefully optimized trading algorithm

This is the Goldborg Gold EA. It trades on the XAUUSD chart in the 1H timeframe. This EA is optimized for the Broker ICTrading only! NO MARTINGALE OR GRID The signal is a combination of both Stonks Go Up EA and Goldborg (both EAs that I sell). The price will be changed to $500 each if the signal hits 210%!
https://www.mql5.com/en/signals/2322075?source=Site
So get the power duo until the price increases! : https://www.mql5.com/en/market/product/135150?source=Site+Market+MT5+Expert+Search+Rat

O Scartrader é um robô de day trade desenvolvido para o Mini-Índice da B3, combinando os indicadores Williams %R, Z-Score e Filtro VHF com uma camada adicional de análise de correlação entre ativos , garantindo assertividade nas operações. Sua arquitetura inclui gestão de risco , com stop dinâmico, limite diário de perdas e controle de exposição por operação. A correlação pode ser realizada em diversos ativos: dólar, ações, ETF, juros futuros DI. A estratégia foi validada em backtests extensos ,

O Hunter Scalper Fx usa uma confluência de vários indicadores, Price Action e filtros para identificar padrões específicos e gerar Sinais de entrada no mercado . Este setup é frequentemente usado por traders profissionais Ao redor do mundo. Se queres um EA seguro, o Hunter Scalper Fx é pra você. O Hunter Scalper Fx não usa AI, martingale ou Grid, não faz milagres, mas é seguro. Os resultados Aqui apresentados nas imagens são de (out of Sample), portanto, muito mais confiável, Além disso, inclui

Why You Need VLine Alarm
Stop Missing Trade Setups.
News events, session opens, key timeframes - they all happen whether you're watching or not. VLine Alarm keeps you on point.
Set It Once. Forget It.
Drag a line. Walk away. Get alerted. No babysitting charts. No missing opportunities because you switched timeframes or stepped away.
The Problem It Solves:
You know that moment when you realize the news already hit 5 minutes ago? Or you miss the London open because you were analyzing the daily cha
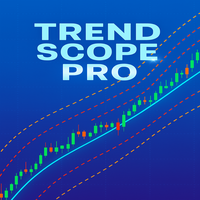
Trend Scope Pro – Precision Linear Regression Channels for Smarter Trading
Trend Scope Pro is a powerful trading indicator built on the concept of Linear Regression Channels, designed to give traders a crystal-clear view of market trends, volatility, and potential reversal zones. This professional-grade tool brings advanced statistical analysis right onto your MetaTrader 5 charts, helping you make smarter, more confident trading decisions.
Unlike traditional moving averages or static trendlin

PS Assistance is hybrid EA. It make trade easier than general trading. It shows necessary value real time for help to trading and has button for Buy/Sell/Close All Buy/Close All Sell/especially close remain 3 orders has profit highest. It has break event line for order buy or sell. It made you get price when you have profit or you plan to order in big lots for close all. I hope you enjoy trading with my "PS Assistance".

INDICATOR: TRIBOX SIGNAL GEN Developer: gedeegi General Description GEN TRIBOX SIGNAL is a technical indicator designed to automatically identify and visualize the 1-2-3 Pattern or price reversal pattern. This pattern is a classic price action formation frequently used by traders to detect potential trend reversals. This indicator not only displays the 1-2-3 pattern on the chart but also automatically identifies the breakout signal from the critical level (point 2) and projects Entry, Stop Loss

AnacottTrading MultiAI – The Honest Multi-Asset Trading Robot AnacottTrading MultiAI is not just another “blender EA” promising dream-like revenues with fake backtests.
This is a transparent, professional trading system built on 15+ years of market experience. AnacottTrading MultiAI trades with discipline: Only one position at a time No Martingale, no Grid, no trade spam Full risk control for every single trade This EA uses a rolling optimization approach – always tuned to the last 3 months o

STAR 160 in One (MT5 EA) — 160-Strategy Multi-Market Scalper/Trader All-in-one MT5 Expert Advisor for Forex, Indices & Commodities — 160 built-in strategies, anti-martingale risk, and full automation.
No grid. No martingale. No indicator dependency (pure price-action core). STAR 160 in 1 - User Manual & Set Files Live Signals & Other Products What is STAR 160 in One? STAR 160 in One is a Swiss-army MT5 EA that packs 160 unique strategies —from breakouts and momentum pushes to regressions,

Non Repaint Diamonds is a precision-engineered MT5 indicator designed to provide traders with highly reliable chart signals that remain stable once confirmed.
Unlike repainting tools that shift or vanish after the fact, this indicator locks its signals in place, allowing traders to analyze with confidence. It marks the chart with distinct diamond-shaped signals that highlight potential turning points in market structure.
The tool offers flexible customization of signal appearance, offsets, an
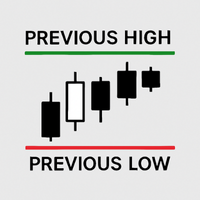
Previous Candle High/Low with Custom Time and Timeframe This indicator automatically plots two horizontal lines on your chart, showing the high and low of the most recent completed candle from a user-selected timeframe. It is designed for traders who want to clearly mark important intraday or higher-timeframe levels without manually drawing them. At the start of each trading day, the indicator waits until your chosen activation time (HH:MM server time). Once that time is reached, it deletes Prev

Overview XAUUSD ICT SMC – Lean Core (v1.4) is a MetaTrader 5 Expert Advisor focused on fast, clean FVG entries with tight risk and simple, robust exits .
It trades XAUUSD (and other symbols you list) using a direction-aware Fair Value Gap detected on a single, user-selected entry timeframe. Direction is seeded by short-term momentum, optionally filtered by a higher-TF EMA bias. The exit engine combines a hybrid ATR / R-multiple take-profit , optional breakeven , and ATR trailing with a minimum
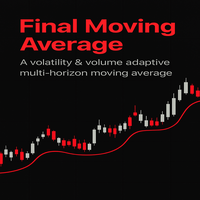
Final Moving Average – Indicator Description
The Final Moving Average is a next-generation technical tool designed for traders who demand precision, adaptability, and clarity in their charts. Unlike traditional moving averages that use fixed periods and often lag behind the market, this indicator is built on a smart adaptive algorithm that dynamically adjusts itself based on market volatility and trading volume.
How to Read the Indicator
Line Direction:
An upward-sloping Final Moving Averag
Gold Donchian Breakout EA is a rule-based breakout system for XAUUSD (MT5) .
On each new bar it validates data, confirms momentum with an embedded Gann High/Low Activator , places Buy Stop orders at recent Donchian highs , and protects the trade with an ATR-based stop-loss . The indicator is embedded as a resource, so the EA works out of the box in the Strategy Tester and on live charts.
Recommended usage
Designed for XAUUSD (gold) with a recommended timeframe of M30 . It can also be used on
QUANTUM PHASE - Advanced Quantum Resonance Trading Signals for MT5 Revolutionize Your Trading with Quantum-Inspired Cycle Synchronization! QUANTUM PHASE is a cutting-edge, non-repainting indicator designed for MetaTrader 5, harnessing the power of Quantum Phase Resonance (QPR) to deliver precise buy/sell signals based on synchronized market cycles. Inspired by quantum mechanics principles, this indicator detects phase alignments across multiple dominant cycles, filtering out noise for high-conf

Delta Quantum EA by Xignal Coding
This price is for the first 20 purchases. Next price -> 100$ Delta Quantum is a mean reversion Expert Advisor designed for traders who want both simplicity and power.
It calculates the Delta (distance) – a unique measurement that highlights potential turning points in the market – and uses this as a signal for precise entries. Why choose Delta Quantum? Beginner-friendly with ready-to-use defaults for EURUSD H1. Advanced customization for traders who want to take

Title: Universal Trade Closer & Risk Manager Description:
This Expert Advisor is designed as a simple yet powerful tool for managing trades . It provides traders with an efficient way to instantly close all open positions and pending orders across any symbol or timeframe with just one click or automated execution. Instead of manually managing trades during volatile conditions, this EA offers a fast, reliable, and safe method to exit the market when needed. Whether you want to protect your accou

-------------------------------------------------------------------------------------------------------------------------------------------------------------------------------------------------------------------------------------------------------------------------------------------------------------- MARKET PROFILE PRO - Professional Volume Analysis & Smart Trading Dashboard Transform Your Trading with Institutional-Grade Market Profile Analysis Market Profile Pro brings Wall Street's most pow

SISTEMA DE TRADING ALGORITMICO PROFESIONAL VISIÓN GENERAL CRT ADVANCED es un sistema de trading automatizado de alta precisión que opera basado en el análisis de formaciones de velas japonesas. Desarrollado específicamente para mercados de Forex, indices y commodities, implementa una metodología sistemática que combina price action puro con gestión avanzada de riesgo. Contacte conmigo después de la compra, le enviaré sets y soporte gratuito. Gracias.

The Custom Alert Lines.mq5 Indicator is designed to create two horizontal lines on the chart that serve as levels for alerts when the price crosses them. Key Functions and Features Two Customizable Lines (L1 and L2): The indicator allows the user to set the color, style, and thickness for each of the two lines via input parameters. Crossing Alerts: The indicator monitors when the closing price of the current bar crosses the level of one of the lines. Upon crossing, a pop-up alert is generated a
FREE
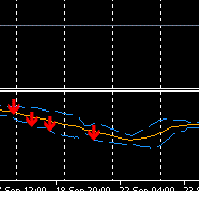
How the Sell Signal Works 1. Bollinger Band condition The current candle must close at or above the Upper Bollinger Band . This signals potential overbought conditions. 2. OBV confirmation (On Balance Volume) OBV must be falling → OBV_now < OBV_prev . Stronger confirmation: OBV decreasing for 2–3 consecutive bars. This shows that buying pressure is weakening . 3. ATR filter (Average True Range) Current ATR must be below its moving average (e.g., ATR_now < ATR_SMA(14) * 1.2 ). Purpose: avoid ente
FREE

LAUNCH PROMO first 10 copies = 49$ the price will increase by 50$ for every 10 copies sold PropFirmEA – Advanced Monthly Trading Expert Advisor Optimized for Prop Firms & Low Drawdown Accounts Description:
PropFirmEA is a fully automated Expert Advisor for MetaTrader 4, built around a proprietary monthly strategy and specifically optimized for Prop Firm Challenges thanks to its extremely low drawdown and strict risk control mechanisms .
Unlike conventional grid or martingale systems, it feature
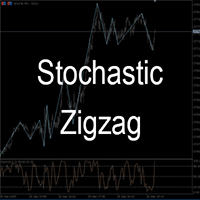
The Stochastic ZigZag is a powerful and intuitive indicator designed to identify significant market swing points with a high degree of reliability. By integrating the Stochastic Oscillator, this indicator plots swing highs and lows only after they are validated by a clear shift in market momentum by using Stochastic overbought and oversold zone. Features: Stochastic Confirmation: Uses momentum to filter out insignificant price movements. Simple Chart Visualization: Draws clear trend lines connec

BLao Gold is the latest version of the gold trading EA, optimized for better performance with significant drawdown. It works on all timeframes, delivers high performance and maintains a simple configuration.
It is better to control the EA semi-manually, for example, when the market is in an uptrend, it is better to turn off "Auto Sell" and the EA only executes "BUY". In addition, it has a trend recognition function according to EMA to automatically "BUY" or "SELL" or both.
The results obtaine

# Beepsticks v1.92 – Extended Technical Description
Beepsticks: - For those who want to rest their eyes and prefer to hear every tick! - For those who want to maintain control over the proper functioning of their trading platform and connection, even when they are unable to watch the screen for a period of time.
User Manual for Beepsticks v1.92 – Tick & Candle Direction Sound Alert Indicator for MetaTrader 5 Platform
---
## 1. Description
The `Beepsticks` indicator provides sound alerts o

This Expert Advisor has been developed to provide consistent trading execution with clear parameters and flexible settings for two different trading styles. Designed for both new and experienced traders, the EA comes with a straightforward setup and easy-to-adjust inputs. A powerful and fully customizable Expert Advisor designed to trade Breakouts from classic fractal patterns. Featuring versatile settings, this EA can be configured for different risk tolerance , from conservative fixed-lot to

UJ Go Go – Dominate USDJPY with Enhanced Precision!
UJ Go Go is a powerful Expert Advisor optimized for USDJPY on the H4 timeframe. Powered by an advanced EMA + RSI strategy, it delivers exceptional returns with controlled risk. Backtested from September 2024 to August 2025 with a $100 starting capital and 0.01 lot, it achieves:
- 1 Month: 9.99% return - 3 Months: 126.25% return - 6 Months: 119.49% return - 12 Months: 138.47% return - Max Drawdown: 32.94%, Profit Factor: 2.21
Why Choose UJ Go

Channel Trend Bands – A Comprehensive Indicator for Market Analysis Simple to Use, Effective in Application User-Friendly and Suitable for All Traders This indicator stands out due to its straightforward functionality. Whether you're a beginner exploring the market or an experienced trader refining your strategy, this tool offers valuable insights. Using a Triangular Moving Average (TMA) with additional ATR-based bands , it provides structured market data to support well-informed decision-

FXGrowth2 – Automated Trading Strategy FXGrowth2 is an automated trading strategy developed with a primary objective: maximizing the return-to-drawdown ratio while maintaining strict risk control , with maximum account drawdown kept below 15% . To ensure robustness and consistency, the system has been backtested over 5 years of historical data across 28 currency pairs , derived from the 7 major currencies: USD, EUR, GBP, AUD, CAD, NZD, and JPY . Only when a currency pair meets our predefined per

Total opened lots calculation & Average price show on chart. You can manage lots size it's helpful who opened many lots in different price leval and it's shows Average price of lots.it's indicator not EA. Available only Mt5. Attach on chart which open positions pairwhich you want to calculate and want to know all lots average price. Excellent indicator which may help to controls your lots size.

Scalping Emas Mini Konsisten
Gold Scalping Mini Consistent adalah EA scalping intraday untuk XAUUSD (Emas) yang fokus pada keuntungan kecil tetapi sering dengan risiko rendah. Strategi Utama Gold Scalping Mini Consistent dirancang untuk XAUUSD (Emas) dengan target tetap sekitar 100 poin (10 pip) per perdagangan. Strategi ini fokus pada entri short, keluar cepat, dan meminimalkan paparan volatilitas tinggi.
Fitur Utama
Performa Konsisten – keuntungan kecil tapi sering
Manajemen Uang Aman

This Expert Advisor (EA) is an automated trading system designed for MetaTrader 5 (MT5). It eliminates emotional trading by executing trades based on predefined strategies and algorithms. The bot continuously monitors the market, identifies entry and exit opportunities, and manages risk with built-in money management rules. Key Features: Fully automated trading – no manual intervention required. Works 24/5 on MT5 platforms. Supports multiple currency pairs and timeframes. Risk managemen

Support Resistance Catcher Indicator Features and Explanation
Overview: The Support Resistance Catcher is a custom MT5 indicator designed to identify and visualize supply (resistance) and demand (support) zones based on candlestick price action. It detects zones where price has reversed after rallies or drops, using wick rejections and clustering. The indicator draws horizontal rectangles for active and historical zones, with customizable colors, labels, and alerts.
Key Features:
1. Zone Det
Trades Manager Pro – Only Buy is a professional trade management tool designed to fully automate risk control and profit-taking for BUY trades only, on any symbol, pair, or instrument you apply it to . It calculates a risk-based stop loss once per position, ensuring consistent capital protection without repeated modifications. The system supports up to three customizable partial take profit levels (TP1, TP2, TP3), each closing a defined percentage of trade volume to secure profits step by step,

Trades Manager Pro – Only Sell is a professional trade management solution built exclusively for SELL trades, giving traders full automation of risk control and profit-taking with maximum precision on any symbol, pair, or instrument you apply it to . The EA calculates a risk-based stop loss once per trade, ensuring disciplined capital protection without unnecessary modifications. It supports up to three customizable partial take profit levels (TP1, TP2, TP3) to secure profits step by step, plus

Overview Market Structure Analysis Indicator MT5 Structure Analysis Indicator automatically identifies Market Structure based on Smart Money Concepts (SMC). It clearly displays Break of Structure (BoS), Change of Character (CHoCH), Higher Highs, Higher Lows, Lower Highs, and Lower Lows in real-time. Key Features Automatic Market Structure Detection Break of Structure (BoS) - Price breaks previous structure in trend direction Change of Character (CHoCH) - Trend reversal signals Hi
Synchronize symbol changes across multiple charts instantly and effortlessly. Overview Chart Symbol Synchronizer is a professional tool for traders who work with multiple charts simultaneously. Change the symbol on your master chart, and watch all your follower charts update automatically in real-time. Perfect for multi-pair analysis, correlation trading, and efficient workspace management. Key Features Instant Synchronization - Updates all linked charts within 200ms Multiple Independent Gro

概要 Golden Hen EA は、 XAUUSD 専用に設計されたエキスパートアドバイザー(EA)です。異なる市場状況や時間枠(M5、M30、H2、H4、H6、H12、W1)でトリガーされる 9つ の独立した取引戦略を組み合わせて動作します。 EAは、エントリーとフィルターを自動的に管理するように設計されています。EAの中核となるロジックは、特定のシグナルを識別することに重点を置いています。Golden Hen EAは、 グリッド、マーチンゲール、またはナンピン(averaging)手法を使用しません 。 EAによって開かれるすべてのトレードは、事前に定義された ストップロス(Stop Loss) と テイクプロフィット(Take Profit) を使用します。 ライブシグナル | アナウンスチャンネル | セットファイルをダウンロード v2.7
9つの戦略の概要 EAは複数の時間枠で同時にXAUUSDチャートを分析します: 戦略 1 (M30): この戦略は、定義された弱気パターンの後に、潜在的な強気(bullish)反転シグナルを識別するために、直近のバーの特

ABSマニュアル : ABSシステムの使用方法とリスクプロファイルに関する完全ガイド
リアルタイム監視 アカウント仕様 資本金: $10,000
レバレッジ: 1:1000
サーバー: ICMarketSC 追加リソース セットアップと使用ガイドは ABSチャンネル で入手可能です。 ABS EAとは? ABS EAは、H1時間足での XAUUSD(ゴールド) 専用に開発されたプロフェッショナルトレーディングロボットです。
リスク管理機能を組み込んだ マーチンゲールシステム に基づいています。 初心者から経験豊富なトレーダーまで対応できるように設計されたABS EAは、セットアップが簡単で、完全自動化され、異なるトレーディングスタイルに合わせてカスタマイズ可能です。 主な特徴 ユーザー定義の安全設定を持つマーチンゲール戦略 柔軟なロット管理:固定ロットまたは自動ロット 選択した閾値で取引を一時停止する最大ドローダウン制限 シンプルなセットアップ:チャートに添付し、設定を構成して取引 技術仕様 シンボル: XAUUSD 時間足: H1 最低入金額: $300 推奨入金額: $1,00

AI STRIX - トレーディングロボット MetaTrader 5用AI STRIXトレーディングロボット 購入後、インストール支援についてお問い合わせください: AI STRIXコミュニティチャット || インストールガイド AI STRIXは、人工知能と機械学習アルゴリズムを活用して市場状況を分析し、MetaTrader 5プラットフォームで取引を実行するトレーディングロボットです。 主な機能 AI駆動分析 このロボットは、ニューラルネットワークを利用して市場データを処理し、パターンを識別し、テクニカル分析に基づいて取引決定を行います。 マルチモデル統合 複数の分析モデルからの洞察を組み合わせて、市場分析の精度を向上させます。 動的適応 システムは変化する市場ダイナミクスに適応し、分析アプローチを継続的に調整します。 リスク管理 エクスポージャー管理を支援する統合リスク管理機能が含まれています。 自動実行 取引機会が特定されると、ロボットは自動的に取引を実行し、エントリーからエグジットまでのポジションのライフサイクル全体を管理できます。 仕組み このロボットは金融市場を継続的に

MT5Phoenix — MetaTrader 5 向け XAUUSD ブレイクアウトEA MT5Phoenix は、XAUUSD 向けに設計された MetaTrader 5 用の自動売買プログラム(Expert Advisor / EA)です。 複数時間足のフィルターと設定可能なリスク管理に基づき、ブレイクアウト条件で取引を行います。 シグナル監視(任意): https://www.mql5.com/en/signals/2355194 主な機能 戦略ルールと入力設定に基づく自動執行 マルチタイムフレーム構成:上位足フィルターと下位足エントリー リスク設定:固定ロット、またはリスク計算によるポジションサイズ(銘柄設定に依存) 取引管理:stop loss、take profit、trailing stop、任意の部分決済 安全チェック:スプレッドフィルター、証拠金チェック、日次制限(有効時) 戦略ロジック(概要) EA はスイング基準のブレイクアウトトリガーにトレンドフィルターを組み合わせます: Trend filter: 選択した上位足における指数移動平均(EMA)の関係 Entr

An advanced Expert Advisor powered by artificial intelligence and machine learning, specifically designed for analyzing FOREX . It adapts to price movements and market fluctuations to detect potential trading opportunities. Contact me if you need the settings file, have any questions, or need any assistance. Artificial Intelligence Integration: At the heart of this EA les a sophisticated AI engine capable of recognizing complex patterns in FOREX price data. The system continuously processes

An advanced Expert Advisor powered by artificial intelligence and machine learning, specifically designed for analyzing Gold (XAU/USD). It adapts to price movements and market fluctuations to detect potential trading opportunities. Contact me if you need the settings file, have any questions, or need any assistance. Artificial Intelligence Integration: At the heart of this EA les a sophisticated AI engine capable of recognizing complex patterns in gold price data. The system continuously process

始める前に、あなたに完全に正直でなければなりません。もし一晩であなたを金持ちにしてくれるEAを探しているのなら、Lumerisはあなたには向いていません。もし500ドルを1か月で5万ドルに変えることを期待しているのなら、別を探してください。このEAは、真の持続可能な富がフォレックスでどのように築かれるかを理解している忍耐強いトレーダーのために設計されています。それは、一回一回のトレード、日ごと、月ごとに着実に積み上げられるものです。フォレックス取引 ― 手動であれアルゴリズムであれ ― には忍耐が必要です。市場はあなたの請求書や夢、焦りなど気にしません。市場は忍耐を報い、欲に罰を与え、結果を無理に強要しようとする者を破滅させます。長年の取引と、何か月もかけてこのEAを開発した経験から、最も成功するトレーダーとは、すべての動きを捉える人ではなく、複利成長が魔法を発揮するまでゲームに残り続ける人であると学びました。 Lumerisはこの哲学を体現しています。 私はすべての機会を追いかけたり、すべてのピップを捕まえようとして不必要なリスクを取るために開発したのではありません。その代わりに、

An advanced Expert Advisor powered by artificial intelligence and machine learning, specifically designed for analyzing BTC. It adapts to price movements and market fluctuations to detect potential trading opportunities. Contact me if you need the settings file, have any questions, or need any assistance. Artificial Intelligence Integration: At the heart of this EA les a sophisticated AI engine capable of recognizing complex patterns in BTC price data. The system continuously processes historic
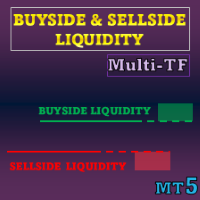
特別オファー : すべてのツール 、各 $35 。 新ツール は 最初の1週間 または 最初の3件の購入 まで $30 です! MQL5 の Trading Tools チャンネル :最新情報を受け取るには私の MQL5 チャンネルに参加してください 本インジケーターは 流動性レベル および 流動性ゾーン を ICT コンセプト に基づいて可視化し、さらに一方向の価格変動を強調する Liquidity Voids を表示します。ストップ注文や指値注文が集まりやすい箇所と、価格がそこを通過した後の推移に焦点を当てます。
MT5 版はこちら: Buyside and Sellside Liquidity MT5 Multi Timeframe MT4 版はこちら: Buyside and Sellside Liquidity MT4 Multi Timeframe その他の製品: All P roducts 主なポイント • カラー分けされたレベルとゾーンにより、双方向の流動性構造(buyside/sellside)を明確化 • レベル
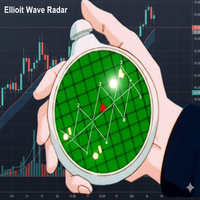
このインジケーターは何をしますか? このインジケーターは、チャートを自動的に分析して エリオット波動のパターン (推進波と修正波)を特定し、リアルタイムで波1、2、3、4、5がどこにあるかを表示します。さらに、 価格予測 、 出来高の検証 、および 三角保ち合いの検出 も含まれています。 この「レーダー」バージョンはどのように改善されましたか? 目標の予測: 第5波での価格の行方を提案します。 出来高による検証: 出来高が検出されたパターンを支持しているか確認します。 三角保ち合いの検出: 複雑な修正(収縮、拡張、対称)を特定します。 確率分析: 検出されたパターンの信頼性(%)を示します。 複数の代替カウント: 市場が曖昧な場合に、複数の有効な選択肢を提供します。 色と線の見方 波の線: 青: 推進波 (1、3、5)— 主要なトレンド。 赤: 修正波 (2、4)— トレンド内の後退。 黄色い線(推奨される後退) この線は、修正が終了する可能性が最も高い水準を示します。 もし価格が後退し、黄色の線の基部(価格に最も近い点であり、エントリーレベルとして機能します)を破ると、その線が反対側
FREE
MetaTraderマーケットが取引戦略とテクニカル指標を販売するための最適な場所である理由をご存じですか?宣伝もソフトウェア保護も必要なく、支払いのトラブルもないことです。これらはすべて、MetaTraderマーケットで提供されます。
取引の機会を逃しています。
- 無料取引アプリ
- 8千を超えるシグナルをコピー
- 金融ニュースで金融マーケットを探索
新規登録
ログイン