适用于MetaTrader 5的新EA交易和指标 - 85

EA Goldlytic use a trend built-in indicator. It's specifically designed for trading the XAUUSD (GOLD) but can be used with other assets (forex, crypto...).
The Expert Advisor opens an order based on a signal from the indicators and fixes the profit at a certain level with the ability to open order basket For best results, it is recommended to cancel the direction of trade on the EA panel on the chart Since this is a trend-following Expert Advisor, we recommend disabling the Expert Advisor in


The WAPV ADH Supply and Demand indicator is part of a set of indicators called (Wyckoff Academy Wave Market)
The WAPV ADH Supply and Demand indicator for MT5 is intended to identify the winning side between buyers and sellers.
Its reading is very simple, when the green line is above the red line the demand is in charge, when the red line is above the green line the supply is in charge.
The more positive the green and red lines, the greater the volume input, the closer to zero or negative,

The WAPV ADH Supply and Demand Forex Indicator is part of a set of Indicators called (Wyckoff Academy Wave Market) The WAPV ADH Forex Supply and Demand Indicator for MT5 is intended to identify the winning side between buyers and sellers. Its reading is very simple, when the green line is above the red line demand is in command, when the red line is above the green line supply is in command. The more positive the green and red lines, the higher the volume input, the closer to zero or negative, t

The Weis Wave Bouble Side Indicator for MT5 is part of the toolkit (Wyckoff Academy Wave Market) The Weis Wave Bouble side Indicator for MT5 was created based on the already established Weis Wave created by David Weis. The Weis Wave Double Side indicator reads the market in waves as it was done by R. Wyckoff in 1900. It helps in the identification of effort x result, cause and effect, and Supply and demand Its differential is that it can be used below the zero axis, further improving plus operat

The Weis Wave Bouble Side Indicator for MT5 is part of the toolkit (Wyckoff Academy Wave Market) The Weis Wave Bouble side Indicator for MT5 was created based on the already established Weis Wave created by David Weis. The Weis Wave Double Side indicator reads the market in waves as R. Wyckoff did in 1900. It helps in the identification of effort x result, cause and effect, and Supply and demand Its differential is that it can be used below the zero axis and has a breakout alert showing Who is s

The VSA Candle Signal for MT5 is part of the toolset (Wyckoff Academy Price and Volume). Its function is to identify the correlation of Price and Volume in the formation of the candle. Its creation is based on the premises of R.Wyckoff , a precursor in the analysis of Price and Volume. VSA Candle Signal for MT5 assists in decision making, leaving your reading clearer and more fluid. See the images below.

The Force and Weakness Indicator for MT5 Real Volume is part of the (Wyckoff Academy Price and Volume) toolset The Force and Weakness Indicator for MT5 Real Volume was developed to identify the Strength and Weakness of volume in an accumulated way. Enabling the vision of a panorama between price and volume. The Indicator can be used as an oscillator and as a histogram. As a fantasy it has all the premises of R. Wyckoff's three laws when put together with the price: Cause and Effect, Effort x Res

User Grid MT5 is a multifunctional grid Expert Advisor designed to fully or partially automate various ideas related to grid trading (on a hedging account) . The Expert Advisor can trade on any timeframe, on any currency pair, on several currency pairs, on any number of signs. It does not interfere with manual trading, trading of other Expert Advisors, or the operation of any indicators. It allows you to adjust your settings on the fly, works only with your own positions and orders. It has a

The Force and Weakness Indicator for MT5 Forex is part of the (Wyckoff Academy Price and Volume) Toolkit The Force and Weakness Indicator for MT5 Forex was developed to identify the Strength and Weakness of volume in an accumulated way. Enabling the vision of a panorama between price and volume. The Indicator can be used as an oscillator and as a histogram. As usual it has all the premises of R. Wyckoff's three laws when put together with the price: Cause and Effect, Effort x Result and Supply a

The indicator plots a trend channel using the technique by Gilbert Raff. The channel axis is a first-order regression. The upper and lower lines show the maximum distance the Close line had moved away from the axis line. Therefore, the upper and lower lines can be considered as resistance and support lines, respectively. A similar version of the indicator for the MT4 terminal
As a rule, most movements of the price occur within a channel, going beyond the support or resistance line only for a s
FREE

This indicator is very useful for day traders or short term traders. (MT5 version) No need to calculate the number of pips manually, just look at the chart and you will see the Virtual Take Profit / Virtual Stop Loss target line and evaluate whether the entry point is feasible to reach the intended target or not.
Enter the intended Take Profit / Stop Loss pips for your trade. The indicator will display Virtual Take Profit / Virtual Stop Loss lines for you to easily see if the target i
FREE

Very powerful indicator! converted from TradingView with upgraded alerts and added notifications. Ideal use in EAs.
Use as a supplementary Indicator to confirm your entries, but it is as good on it's own.
The indicator consists of 3 different Trend Meters and a 2 Trend Bars which are used to confirm trend
How to Use:
The more Trend meters are lit up the better =>>
-more GREEN COLOR at one bar means more confirmation to open buy trade,
- more RED COLOR signals for one bar = more

Adds the symbols listed in Binance Future to Metatrader5
With this free file, you can list the entire list right away. You can easily install it on your demo account It is the first file to be uploaded for Binance Future Tick and is offered for free.
Tools menu / Options / Expert Advisors / You need to select Use WebRequest for listed
You can watch videos to add metatrader
FREE

The EA uses a scalping strategy on a breakout, uses innovative advanced technologies using a Neural Network. To create the EA , we used the latest advanced algorithms to find the best moments to enter the market. The EA uses many smart filters to adapt to almost any economic situation. The EA sets a protective stop order, so the trader does not have to worry that the robot will allow significant drawdowns. The adviser is safe and does not require any settings from the user, just install it on th

You can see Binance Futures data instantly in Metatrader 5 and it allows you to use all the features that Metatrader has provided to you.
You can access the data of all symbols listed on Binance Futures. Don't forget to set the timezone. Binance it's 00:00 UTC. You need to fix it according to your own country You need to pre-install the free Binance Future Symbol List plugin. https://www.mql5.com/tr/market/product/82891 After loading, it automatically downloads the data of the cryptos in the

The idea of a Value Chart indicator was presented in the very good book I read back in 2020 , " Dynamic Trading Indicators: Winning with Value Charts and Price Action Profile ", from the authors Mark Helweg and David Stendahl. The idea is simple and the result is pure genius: Present candlestick Price analysis in a detrended way!
HOW TO READ THIS INDICATOR
Look for Overbought and Oversold levels. Of course, you will need to test the settings a lot to find the "correct" one for your approach.
FREE

1. Торговая стратегия Что делает советник: Советник следит за некотоными индикаторами и при определенном условии (или условиях) помещать торговый запрос (на продажу или покупку) в зависимости от условий. Стратегия:
Используем индикатор Moving Average (скользящие средние) с периодом 8 (вы можете выбрать любой период, но в данной стратегии мы будем использовать период 8). Советник покупает, если 8-периодная скользящая средняя (далее для удобства будем называть ее MA-8) возрастает и текущая цена з
FREE
BOOM Killer Pro
Here is an excellent robot that will allow you to trade the Boom with some ease. The strategy used allows through a combination of Buy and Sell to ensure that you are always in blue. The robot is set to stop losses at -150 and this is obviously configurable. This will rarely happen if the following recommendations are followed. Some practical recommendations: Use the robot in clear upward or downward trends. Avoid using the robot in the ranges Boom 1000 recommended for robot Ti

ADX 指标(平均方向指数)是一种旨在衡量市场趋势强度的技术工具。 ADX 指标用于各种目的,例如测量趋势强度、寻找趋势和交易范围,以及作为各种外汇交易策略的过滤器。
一些最好的交易策略是基于跟随市场趋势。还有一些策略可以让交易者通过逆势交易来获利。无论如何,如果你能及时发现新出现的趋势,你赚钱的机会就会明显增加。
对于交易者来说,好消息是现代交易软件会自动为您进行这些计算。 在这种情况下,您无需单独下载 ADX 指标:ADX 会自动包含在平台指标列表中
如您所知,ADX 指标用于确定市场是否呈趋势。 但是你怎么知道趋势何时发生? 因此,ADX 的范围从 0 到 100。Wilder 认为高于 25 的值表明市场存在趋势,而低于 20 的值表明趋势较弱或根本没有趋势。 出于这个原因,许多现代技术分析师认为 25 的值是市场中“趋势”和“无趋势”之间的关键点。
Crash Killer Pro
This robot automatically assists you in trading the Crash index. However, knowledge of reading the trend is necessary to avoid losses. Launch the robot only in clear periods of trends either uphill or downhill. Some recommendations: Check trend with 1h timeframe Crash 1000 recommended for robot Timeframe 1 minute Minimum capital 300 You can use default settings or adjust.

Andrew Pitch fork is one of the most interesting string trend & Channel & Fibo technical analysis , it's like ALL in ONE tool would be very enough for you.
FYI, This indicator will expire by end of July 2022.
Using 2 Andrew pitch Forks with 2 different time frames on same chart is really very hard working and might be impossible , but with this indicator is possible now , moreover , using this method as Candle Volume based analysis give strong trust for your trade.
I assume if you are hav
FREE

What is this indicator? This EA is a plugin of MT5's FX verification software " Knots Composito r". You can open, change and close positions just like in a real trade.
The profit and loss of all positions is recorded in account.
How to set up
1. Download all historical data for the target currency pair to calculate the profit of the position in dollars. 2. Open the chart of the target currency pair and scroll to the end in the past direction. 3. If the target currency pair is a cross cur
FREE

What is this indicator? This indicator is a plugin of MT5's FX verification software " Knots Composito r". You can take a screenshot of the entire chart by pressing the hotkey and save it to a specified folder.
Features
- Screenshot the entire chart by pressing the hotkey. - Saves the screenshot image in the sandbox folder specified by the relative path. - Show the time of Common Thread on the screenshot image. - Play the screenshot sound.
How to open the sandbox folder 1. Hold down th
FREE

What is this indicator? This indicator plots a customized text object as a note at any point on the chart. To plot the text object, press the hotkey and then click at any point on the chart. You can also add your favorite words and sentences to the template and plot them.
How to stick a note 1. Press the hotkey to enter sticky mode. 2. Click any point to stick. 3. Edit the text of the text object plotted as a note.
About sticky mode
This mode is for plotting a text object as a note. If
What is this indicator?
This indicator controls the visibility of graphic objects on the chart when the hotkey is pressed. If you switch on, the graphic objects will be hidden. If you switch off, the graphic objects will be shown. You can specify the object to control with object type.
List of supported object types - Vertical Line - Horizontal Line - Trendline - Trendl By Angle - Cycle Lines - Arrowed Line - Equidistant Channel - Standard Deviation Channel - Linear Regression Channel - An

What is this indicator? This indicator stamps any customized number at any point on the chart. To stamp any number, press the hotkey (0–9) and then click at any point on the chart. You can also stamp a series of numbers to indicate a chart pattern. (Each number synchronizes modification)
How to stamp any number
1. Press the hotkey (0–9) to enter stamping mode. 2. Click any point to stamp.
How to stamp a double top/bottom pattern 1. Press the hotkey to enter stamping mode. 2. Click any p
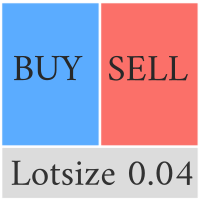
This Pro version of the LotSizePanel let's you set the stoploss with a line. Instantly the ea will calculate the lotsize based on where you drag the line on the chart. Press the "Show Line" button again, and the line dissappears and the ea reverts back to calculating the lot size from an ATR based stoploss again.
I can't see how I would ever trade manually without this panel again.
Remember that autotrading needs to be turned on to place orders with the buttons.

What is this indicator? This indicator draws a customized vertical, horizontal, or trend line at any position on the chart. To draw each line, press the hotkey and then click at any point on the chart. Each drawn line is synchronized with other charts by timeframe. (Each chart requires this indicator to be installed)
How to draw a vertical or horizontal line 1. Press the hotkey to enter drawing mode. 2. Move the mouse to any point. 3. Click to draw the line.
How to draw a trendline 1. Pr

What is this indicator? This indicator draws a customized Fibonacci retracement or expansion at any position on the chart. To draw the object, press the hotkey and then click at any point on the chart. Each anchor point magnets to the high or low price of the nearest bar on the chart.
How to draw
1. Press the hotkey to enter drawing mode. 2. Click any point to draw. 3. Drag and drop each anchor point to adjust if needed.
About drawing mode
This mode is for drawing a Fibonacci retracem

本指标的目的是识别反转点. 蓝色箭头是做多信号,它对应的黄色星是止损. 红色箭头是多空信号,它对应的黄色星是止损.
报警功能: 如果产生了信号,指标会发送三种报警:弹窗,邮件,或者手机推送 Inputs: Popup Window Alert: 弹窗报警,默认是关闭的 Email Alert : 邮件报警,默认是关闭的 Mobile Push Alert: 手机推送报警,默认是关闭的. MetaTrader 4 Version : Reversal Point 请注意,这个信号是逆势的,可能会连续失败. 请注意,这个信号是逆势的,可能会连续失败. 请注意,这个信号是逆势的,可能会连续失败. 请注意,这个信号是逆势的,可能会连续失败. 请注意,这个信号是逆势的,可能会连续失败. 请注意,这个信号是逆势的,可能会连续失败.

A ideia do indicador é mudar de cores assim que o candle viole a banda; Caso o candle viole a banda superior, pinta o candle de vermelho, Caso o candle viole a banda inferior , pinta o candle de verde, Se o candle passar em algum momento pela média, ele assume uma cor acinzentada; Os candles que não passem pela média, nem violem a banda, apresentarão cor verde fraca, se for de alta e cor vermelha fraca se for de baixa. Projeto concebido no canal Aprenda a programar, keltner cores.
FREE

40% off. Original price: $50 Ichimoku Trend Finder is a multi symbol multi timeframe trend dashboard that helps traders to monitor and identify potential market trends from one chart. This panel scans the Ichimoku Kinko Hyo indicator in 28 configurable instruments and 9 timeframes for classic Ichimoku trend signals with a deep scan feature to scan all market watch symbols (up to 1000 instruments!).
Download Demo here (Scans only M1 and M6) Settings description here MT4 version here

Indicator alerts for Dual Relative strength index rsi. Large rsi preset at 14 is below 30 small rsi preset at 4 is below 10 for buy bullish signals .
Large rsi preset are 14 is above 70 small rsi preset at 4 is above 90 for sell bearish signals . Includes mobile and terminal alerts. draws lines when alerts.
This indicator can help identify extremes and then the tops or bottoms of those extremes .
FREE

Starting sale price is 159$ The next price will be 299$. So grab yours now! Stallion expert advisor is the product of years of research, development, and testing. This EA uses two price action strategies for entering a position and recovering the lost trades. Every position has its specific stop-loss and take-profit but by increasing lot-size EA will recover losses. with all that said the drawdown is often fairly low. minimum balance 500$, recommended balance 1000$. minimum leverage: 1:500, rec

I always wondered if I can have multiple time frame Moving average on same chart , it is not possible , now with my Indicator is possible , As you know Moving average is lagging not leading indicator , but how can I predict future levels of it ?
I came with this idea , I hope you will like it , I made a Mirror of Moving average , the other side of specific time will be shown in the other side of the chart where the price didnt reach yet , that will help you to know the levels you can start sel
FREE
Tool converted from tradingview indicator. Modified version with pivot points calculated in a more intuitive way.
This tool displays relative volatility and directional trend. Excellent way to pickup diversions and reversals. Length can be lowered to 11 or 13 in settings to show price range.
Can be used to identify patterns such as parallel channels and likely direction of price action.

Funciona como bandas de bollinger normais. Criado por Joe Ross, é um setup de maior risco por ser contra-tendência. Pode ser usado para Day Trade, Swing Trade e Position. Para identificar, é necessário inserir no gráfico as Bandas de Bollinger, com uma Média Móvel Simples de 20 períodos e largura (desvio) 2. Verifica-se um fechamento de determinado candle abaixo da banda inferior de Bollinger. Se o próximo candle fechar dentro das Bandas, marca-se a máxima dele. O rompimento dessa máxima será o
FREE

Supported currency pairs: EURUSD,USDCAD, GBPUSD, EURGBP Recommended timeframe: M15
The EA should run on a VPS continuously Setting Fixed Lot - fixed frist trading lot StopLoss, in pips - stop loss value TakeProfit, in pips - t ake profit value CCI: averaging period, Averaging period for calculation
CCI: type of price, Use martingale, martingale Mode Martingale coefficient, martingale multiplier Order Maximum number of multiplications
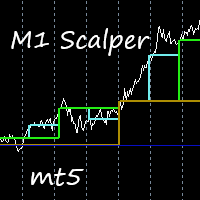
This indicator is excellent for scalping on the M1 or M5 chart. Uses a special algorithm for the lines. No need to set up the indicator. Does not feature any alerts and is best used manually after visually confirming the line displays. NB: Make sure to download M1 history before testing and use.
How to use: Simply attach to M1 or M5 chart. Zoom chart out completely. Sell when all lines above the white line (PriceLine). Sniper line crosses above white line. Buy when all lines below the white li

Optimize before back test or use.
New Wave trades trends. 3 moving averages and trends up and trends down, buying and selling. Finding the optimal parameters for yourself, you will need to optimize in the platform. A set file is in the comments to use in the test to show the Expert. Optimize inputs according to your asset and risk. I optimized this with EURUSD on a 1 hour time frame. Percentage of balance is used to trade by.

This indicator gives you arrows, two SR lines and a golden trend line. Uses a special trend algorithm to plot the arrows, combined with support and resistance inputs. Perfect for channel trading. Features alert functions.
Parameter TrendArrowPeriod. Parameter TrendLinePeriod. (Change to your preference) How to use: Simply attach to any chart with default settings. Zoom in the chart, to see the two blue SR lines and arrows more clearly. When the blue SR line is below the price, golden trend line

The Price Elevator indicator is developed to help you figure out the general long-term trend of the market. If the price is above the Green separator line, this is a clear indication the bulls are in control. Similarly, the bears are in control if the price continues to trend below the red separator line. Download Price Elevator MT4
Trend Re-entry In this case you would plan your buy entries above the green dotted box (make sure to set the Buy / Sell Retracement Floor=30). The SL should be
Este EA foi desenvolvido para o mercado financeiro Brasileiro, porem, com os Parâmetros corretos pode ser aplicado a todos ativos disponíveis na metatrader inclusive forex e metais. Não julgue o resultado com os parâmetros padrão, entenda que os parametros são para validação de diversos ativos, por isso cada ativo tem um valor que se enquadra na realidade do contexto do mercado. Qualquer duvida, pode me chamar no Telegram @andrefonsecaloureiro ou no email vendas.mercadocapital@gmail.com

Supported currency pairs: EURUSD,USDCAD, GBPUSD, EURGBP Recommended timeframe: M15
The EA should run on a VPS continuously Setting Fixed Lot - fixed frist trading lot StopLoss, in pips - stop loss value TakeProfit, in pips - t ake profit value RSI : averaging period, Averaging period for calculation
RSI : type of price RSI :RSI value calculation
Use martingale, martingale Mode Martingale coefficient, martingale multiplier Order Maximum number of multiplications
Equilibro B3 Trader é um robô de negociação versátil projetado para a bolsa de valores brasileira B3, capaz de operar no mini-índice WIN e mini-dólar WDO, bem como em commodities (como milho e boi gordo) e ações (fracionadas ou não). O robô utiliza uma estratégia poderosa baseada em forças e retrações para fazer entradas nos trades, por meio de uma avaliação de 3 médias móveis simples, que podem ser configuradas de acordo com as preferências do usuário. Inclui-se também filtros de entrada por â

The Spots Indicator can be used for Entering and Exiting your trades based on the common candlestick patterns such as: engulfing, hanging man, doji etc. It is designed to publish desktop and mobile notification every time a signal is triggered. However, it is worth noting that this indicator is recommended to be used with other indicator for confirming the entries. It is best to use it with the Investment Castle Trend Lines indicator and the Supply and Demand indicator .
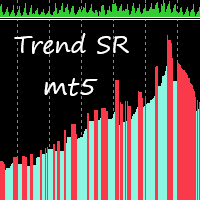
This indicator takes input from Support and Resistance levels, combined with a special trend filter. Easily spot tops and bottoms, and trade with more confidence. Great for scalping. This indicator can be used on all time frames and pairs. Features alert function.
No need to set up the indicator.
How to use: Simply attach to any chart. Zoom chart out completely. Red histogram line color = Selling opportunities. Blue histogram line color = Buying opportunities. See pictures below. To spot high
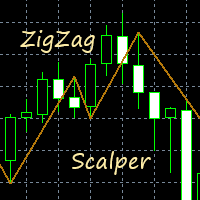
This indicator gives you a modified ZigZag, combined with a trend filter. Great for scalping. Perfect for channel trading. Features alert functions. No need to set up the indicator. How to use: Simply attach to any chart. Buy when the golden line stops below the price. Sell when the golden line stops above the price. It also helps to keep the audible alert set to true. Best results when checking two or more timeframes before entering trades on the lower time frames. Use as you see fit for your

This Expert trades macd crosses , using ADX and AC. Designed for 4hr EURUSD trading but able to trade major pairs. Code is designed for speedy metatrader optimisation using open price testing as ea uses open prices on indicators used. EA identifies trends with specific momentum and exits using the ADX or stop loss. Please optimise using out of sample data. preset at 0.1 lots best to start with 0.01 lots.

中央枢轴范围级别围绕中央枢轴点形成。
这些与中心枢轴相关的水平可用于确定大量的市场行为和可能的结果。
与中心枢轴的距离,以及与前一天水平相关的新水平形成的价格,可用于确定接下来几天的趋势方向和强度。
中心枢轴范围可以作为支撑和阻力,提供止损位置的指南,并提供价格持续变动/突破的信号。 群聊: https://www.mql5.com/en/users/conorstephenson 请在购买后与我联系以获取设置建议和免费的专家顾问! 主要特点 中心枢轴范围重点指标,带有额外的枢轴点和斐波那契水平。 绘制枢轴点 - R1、R2、R3、S1、S2、S3。 绘制斐波那契水平 - 0、0.23、0.38、0.50、0.61、0.78、1。 警报功能。 - 能够使用 MT4 移动应用程序在达到水平时发出通知。 可定制的线条类型、颜色和尺寸。 强烈暗示可能的市场情绪。 多功能指标。 非重绘线 - 使用前几天的固定值在每天结束时形成线。 设置从多少天开始绘制级别。 基于每日时间范围的所有级别。 建议 当中央枢轴范围连续高于之前的范围时,整体市场情绪被认为是看涨的。 当中央枢轴范围连续低
FREE

DreamCather EA - 是美国时段收盘时的高级剥头皮策略。 EA 交易是趋势剥头皮交易者,当主要趋势回滚时进入交易。一套简单的算法可以让您在很长一段时间内以及在市场的各个阶段取得稳定的结果。该系统专注于长期增长。 EA 不使用危险的资金管理系统,例如网格或鞅。它为每个头寸使用固定的止损。 EA 已经对数据进行了 20 多年的测试,在此期间它经受住了最不稳定的时期。如果您没有机会让您的计算机 24/5 保持正常工作,那么建议使用 VPS 服务器服务。 实时信号: https://www.mql5.com/en/users/delmare/seller 此处提供 MT4 版本: https://www.mql5.com/en/market/product/80988 有关产品的全面说明、输入说明和常见问题解答, 请单击此处。 加入我们分享新闻的 MQL5 小组 建议: 时间范围:M5 主要(推荐)货币对:EURUSD,USDCHF,GBPUSD 次要货币对:EURCHF,EURGBP,USDCAD,USDJPY 最低存款:100 美元 设置:所有对的默认设置 为获得最佳

制度层面/银行层面...心理层面/宿舍理论。
该指标将自动在“000、200、500 和 800”水平上绘制,我称之为“机构水平”,或者,也可以在图表上绘制水平“000、250、500 和 750”。
根据您在何处学习机构级交易/季度理论,您可能将它们称为不同的名称,本质上核心思想是这些级别在大多数外汇市场中充当强大的支撑和阻力点。
群聊: https://www.mql5.com/en/users/conorstephenson 如有任何问题或购买后请与我联系以获得设置/操作建议,谢谢! 主要特点
方便地在当前价格上下的数字“000、200、500 和 800”或“000、250、500 和 750”处绘制矩形或线条。 警报功能。 - 能够使用 MT4 移动应用程序在达到数字时通知。 可定制的线条类型、颜色和尺寸。 适用于外汇货币对。 节省在每个图表上绘制级别的时间! 在机构和季度点级别之间快速切换。 强大的视觉支撑和阻力线。 建议
在旁边使用一个可靠的趋势指标来确认方向。检查多个时间范围以进一步确认您的偏见。等待测试当前价格附近的线,买低,卖高。
FREE

McDuckEA MT5 – works on the martingale strategy. It shows good results when trading on Gold, XAUUSD. Martingale orders are opened with a step from each other and only after the opening of a new bar of the set timeframe. During the release of important news, the adviser suspends the opening of new orders. The EA has an internal risk control system and, if the risk is exceeded, it starts to exit the market, closing extreme positions in pairs. The level of loading of the deposit determines the risk

“Practically everyone can forgive us for honesty: and, say, an insufficiently professional game, and even insufficiently professional poetry. There are many examples of this. But when honesty disappears, nothing is forgiven.”
Golden Rings - Forex financial robot offers options for finding profitable trades even in unstable markets when the current trend direction is unclear. It will follow the best trend to maximize profits and reduce the chances of possible losses.
To work in MetaTrader 4

该指标使用价格序列的局部高点和低点。突出极值后,对它们的值进行平滑处理。因此,建立了两个通道 - 外部和内部。如果价格走势严格遵循线性趋势,则内部通道显示限制。外部通道以对数趋势显示价格变动的边界。 在计算通道后,该指标分析实际价格走势并提供开仓和平仓建议。蓝点 - 建立买入头寸,红色点 - 建立卖出头寸。相应的交叉盘建议关闭某些头寸,如果有的话。应该记住,并非所有信号都具有相同的强度和准确性。在某些情况下,正确方向的价格变动会很快结束,因此不可能获得大笔利润。在某些情况下,信号会导致损失(最后一张图片显示了此类信号的示例)。鉴于这些特点,我们可以推荐以下方法 - 使用浮动止盈,其值可以根据当前市场情况进行更改。还需要选择一个止损值,以便在出现关闭它们的信号之前关闭无利可图的头寸。 指标设置使用以下参数进行: iChannel - 调整通道的宽度。狭窄的通道会提供更多的信号,但也会增加误报的风险。 iSignal - 允许您配置信号的显示。默认情况下,仅显示最佳进入和退出信号。 iPeriod - 指标周期。该参数越大,通道宽度越大。因此,它也会影响信号的数量。 iFac

该实用程序通过滚动鼠标滚轮来控制任何指标的任何参数。 您可以安装此实用程序并从标准终端交付更改任何指示器的界面。 对于自定义指标,以及在"市场"上购买的指标,有一个通用滚动条实用程序。 " Universal Scroller " 运作原理 该实用程序通过滚动鼠标滚轮进行更改来控制您选择的参数之一。 滚动模式激活是通过将光标悬停在按钮上或单击它来启用的。 按钮自动在图表上设置。 所有至少有一个整数参数的指标都适用于此实用程序。
安装工程 在图表上加载您的指标,记住您要控制的参数的值。 它必须是一个整数。 将"标准滚动条"加载到图表上。 在"设置"窗口中,同步两个指标-为此,请在"参数"字段中输入指标中的值。 例如,如果您的指标的参数等于14,请在"标准滚动条"设置中设置参数14。 单击确定。 按钮出现在图表上后,您可以将其拖动到任何方便的地方,它会记住它的位置。 指示器已准备好使用。 只需将鼠标悬停在按钮上! 申请表格 将光标悬停在按钮上并旋转鼠标滚轮。 您选择的参数将随着您在设置窗口中设置的步骤而增加或减少。 与此同时,图形本身的滚动模式被禁用。 要停用指标滚动模式并恢复图表滚
FREE

该实用程序通过滚动鼠标滚轮来控制任何指标的任何参数。 如果您购买或租用了一个指示器,您可以使用这个实用程序更改它的界面. 任何具有至少一个整数参数的指标都适用于此。
如果您首先想尝试它的工作原理,请下载免费的 Standart 滚动条指示器,以控制标准终端交付的指示器。
运作原理 该实用程序通过滚动鼠标滚轮进行更改来控制您选择的参数之一。 滚动模式激活是通过将光标悬停在按钮上或单击它来启用的。 按钮自动在图表上设置。 对于长时间加载的指示器,按按钮使用滚动模式. 在这种模式下,只有在按钮关闭后,指示器才会加载。
安装工程 在图表上加载您的指标,记住您要控制的参数的值。 它必须是一个整数。 将通用滚动条上传到图表。 在"设置"窗口中,同步两个指标-为此,请在"参数"字段中输入指标中的值。 例如,如果指示器的参数等于14,请在通用滚动条设置中设置参数14。 单击确定。 按钮出现在图表上后,您可以将其拖动到任何方便的地方,它会记住它的位置。 指示器已准备好使用。 只需将鼠标悬停在按钮上! 申请表格 将光标悬停在按钮上并旋转鼠标滚轮。 您选择的参数将随着您在设置窗口中设置的步

該指標顯示過濾後的價格信息 以燭台圖的形式使用 64 個顏色範圍。 對於確定價格走勢方向的強度非常有用。 該指標沒有任何設置。 所有 64 種顏色都已包含在程序中, 藍色越亮,運動購買力越強, 並且紅色越亮,運動賣出的力量越強。 //////////////////////////////// //////////////////////////////// 我希望這個指標對您成功交易非常有用。 祝你好運。 //////////////////////////////// //////////////////////////////// //////////////////////////////// ////////////////////////////////

ROC 价格直方图警报是一种基于动量的技术指标,用于衡量当前价格与一定时期前价格之间的价格百分比变化。 ROC 以直方图对零绘制,如果价格变化向上,则指标向上移动到正区域,如果价格变化向下,则指标移动到负区域。
计算 ROC 周期的主要步骤是“计算周期”输入设置。短线交易者可能会选择一个较小的值,例如 9 或 12。长期投资者可能会选择更高的值,例如 200。“计算期”是与当前价格相比的多少个时期。较小的值将使 ROC 对价格变化的反应更快,但这也可能意味着更多的错误信号。较大的值意味着 ROC 反应较慢,但信号在出现时可能更有意义。 这种技术指标既有积极的一面,也有消极的一面
积极的 ROC 价格振荡器是技术分析中使用的无界动量指标,以零水平中点为基准 ROC 上升高于零通常确认上升趋势,而 ROC 下降低于零则表明下降趋势 五种警报类型,包括视觉买卖箭头 任何品种和时间框架 消极的 当价格整合时,ROC 将徘徊在零附近。在这种情况下,观察整体价格趋势很重要,因为 ROC 除了确认整合之外几乎不会提供任何洞察力。 指标菜单类别 主要配置 - ROC 计算周期/警报设置 -

The TickCounter indicator counts up and down ticks on each new bar.
The calculation starts from the moment the indicator is placed on the chart.
Histogram bars represent: Yellow bars - total number of ticks; Blue bars - ticks UP; Red bars - ticks DOWN. If the blue bar is not visible, then there are more down ticks and the red bar is displayed on top of the blue one (the red layer is above the blue one). MT4 version: https://www.mql5.com/en/market/product/82548
Each reinitialization of th

Watermark Centralized
Adds a watermark centered with the asset name and chosen period.
It is possible to override the font type, font size, font color and separator character.
The watermark is positioned behind the candles, not disturbing the visualization.
It has automatic re-centering if the window is resized.
Hope this indicator helps you, good trading ;)
FREE

神速EA跟单(TradeMirror)是一款MT4/MT5平台的订单复制软件。 为什么选择神速EA跟单 我们深知对于金融软件而言安全、稳定和隐私的重要性,因此我们在细节处对这三大要素进行了额外的加固: 提供用户友好的图形界面,操作简单易用 注重隐私安全,适合对订单分发有隐私要求各种金融场景 精准复制订单,毫秒级分发 支持全平台,MT4/MT5全面覆盖 智能感知系统状态,邮件通知守护交易安全 核心功能列表 对于跟单软件而言,功能并不是越多越好的,因此经过严谨的需求分析,我们对程序进行了精简,并最终保留了如下核心功能: 多重连接 邮件通知 手数缩放 信号过滤 反向跟单 重置止盈/止损 免费演示 在购买Trademirror之前,你总是可以尝试免费演示。 点击本页面上的免费演示按钮 点击是的,我有Metatrader 4/5 允许浏览器打开Mt4/5 在Mt4/5中,找到专家顾问/市场/TradeMirror,打开它并点击测试 启用复盘显示(否则你将看不到GUI界面)。 点击开始 现在你可以在可视化图表上看到TradeMirror的GUI界面 使用建议
感谢您愿意关注并使用神速,针对常见问

该EA结合了来自Keltner通道和其他指标的信号,根据所选时间框架的趋势执行买入和卖出,通过为每个资产选择特定参数来非常自信。理想情况下,您应该在回溯测试中测试参数以验证策略。享受技术为您提供的最好的东西。如果您对我的个人预设感兴趣,请在聊天中与我们联系或发送电子邮件,vendas.mercadocapital@gmail.com。 This EA combines signals from Keltner's channels and other indicators, executes buy and sell against the trend of the selected time frame, great assertiveness with selection of specific parameters for each asset. Ideally, you should test the parameters in the backtest to validate the strategy. Enjoy the best that technology has t

Golden Retriever is one of my best EA's to date. The Golden Retriever, retrieves money from the market for you. It Retrieves money in small sizes and is a very gentle trader. I am a fullime trader for the past 17 years. My methods all revolve around small profits, short trades and low risk. My experience shows that 2-3% monthly profit using a combination of trade systems is the best way to have a long and effective career in trading. It was developed using 17 years of experience in live tradin

This EA was developed for the Brazilian market in win active in all series of the year. A method of confluence of several indicators of moving averages, IFR and ATR is used. It uses the medium price technique to recover losses in a situation of reversal of movement, and can be enabled and parameterized. The goal is to gain 50 points at each entry, with only 1 contract the risk is minimized and the profit is gradual. Recognizes and avoids input at lateralization levels. It recognizes and advance

FIRST 10 FREE Zeus is a system developed by 8A Sistemas, it is very simple but its strength lies precisely in its simplicity, Zeus works on the statistics of the price of the previous day, such as its minimum price, maximum price, greatest retracement, pivot points among other statistical data that is not We reveal it to guarantee our intellectual property, but it is only statistical data that is not necessary for the operator to know for its correct operation.
Strategy: Zeus looks for im

Resistance and Support is an easy to use indicator to apply horizontal lines of resistance and support. There are two windows for adding levels. When you press the button, a line appears on the price chart. It is possible to move this line with the mouse, thereby changing the indicator readings. In the indicator menu there is a choice of possible alerts - no alert, alert on touching the level and an alert for closing the candle after the level.
FREE

1.这是什么 这是关于市场形成盒子后,再突破的交易策略。它可以交易主要货币兑和黄金:EURUSD,GBPUSD,AUDUSD,NZDUSD,USDJPY,USDCAD,USDCHF,XAUUSD。它不是削头皮模式,不采用马丁格尔的资金管理模式,此策略主要是为了稳健的盈利。 2.相关说明 策略时间框 PERIOD_M30. 它适用于Hedge账户。 它内部的策略逻辑已经被设置好,仅开放了资金管理供你调整。并且资金管理的模式是我自定义的模式,它兼顾收益和风险。 3.资金管理的参数说明 MM_Mode1 = Money_Minimum / Money_Fixed / Money_FixedIncrement_SplitFund / Money_FixedIncrement_SplitFormula. Money_Minimum 为最小仓位. Money_Fixed 为固定仓位.
Money_FixedIncrement_SplitFund / Money_FixedIncrement_SplitFormula 为我个人设置的资金管理模式。当前策略我一般使用 Money_FixedI

40% off. Original price: $50 Moving Average Trend Scanner is a multi symbol multi timeframe triple MA crossover dashboard that helps traders to monitor, and identify potential market trends from one chart. This panel scans 3 moving averages in up to 28 configurable instruments and 9 timeframes for triple moving average alignment and moving average crossover with a deep scan feature to scan all market watch symbols (up to 1000 instruments!).
Download Demo here (Scans only M1 and M6) Sett
MetaTrader市场是 出售自动交易和技术指标的最好地方。
您只需要以一个有吸引力的设计和良好的描述为MetaTrader平台开发应用程序。我们将为您解释如何在市场发布您的产品将它提供给数以百万计的MetaTrader用户。
您错过了交易机会:
- 免费交易应用程序
- 8,000+信号可供复制
- 探索金融市场的经济新闻
注册
登录