ImbalanceDetector

ImbalanceCandleAnalyzer: Your Algorithmic Edge on ICT Imbalances

Stop Guessing. Start Trading with the Precision of Professional Smart Money.

Dear Trader, if you're familiar with the ICT strategy, you know that Price Imbalances (or FVGs) are the cornerstone of high-probability entries. These are the "roadmaps" left by smart money. But manually hunting for them on the chart wastes hours, leads to missed opportunities, and human error.

What if you could automate this process?

The ImbalanceCandleAnalyzer is not just a tool; it's your personal algorithmic assistant that transforms complex ICT theory into clear, visual trading signals right on your chart.

✨ Why This Indicator Will Transform Your Trading?

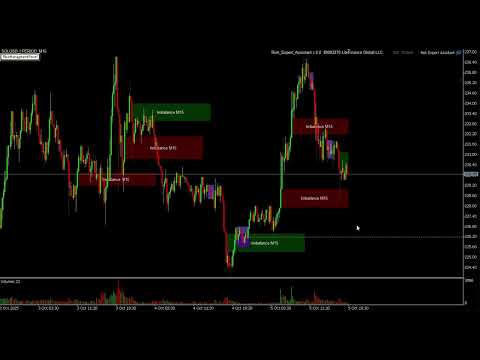
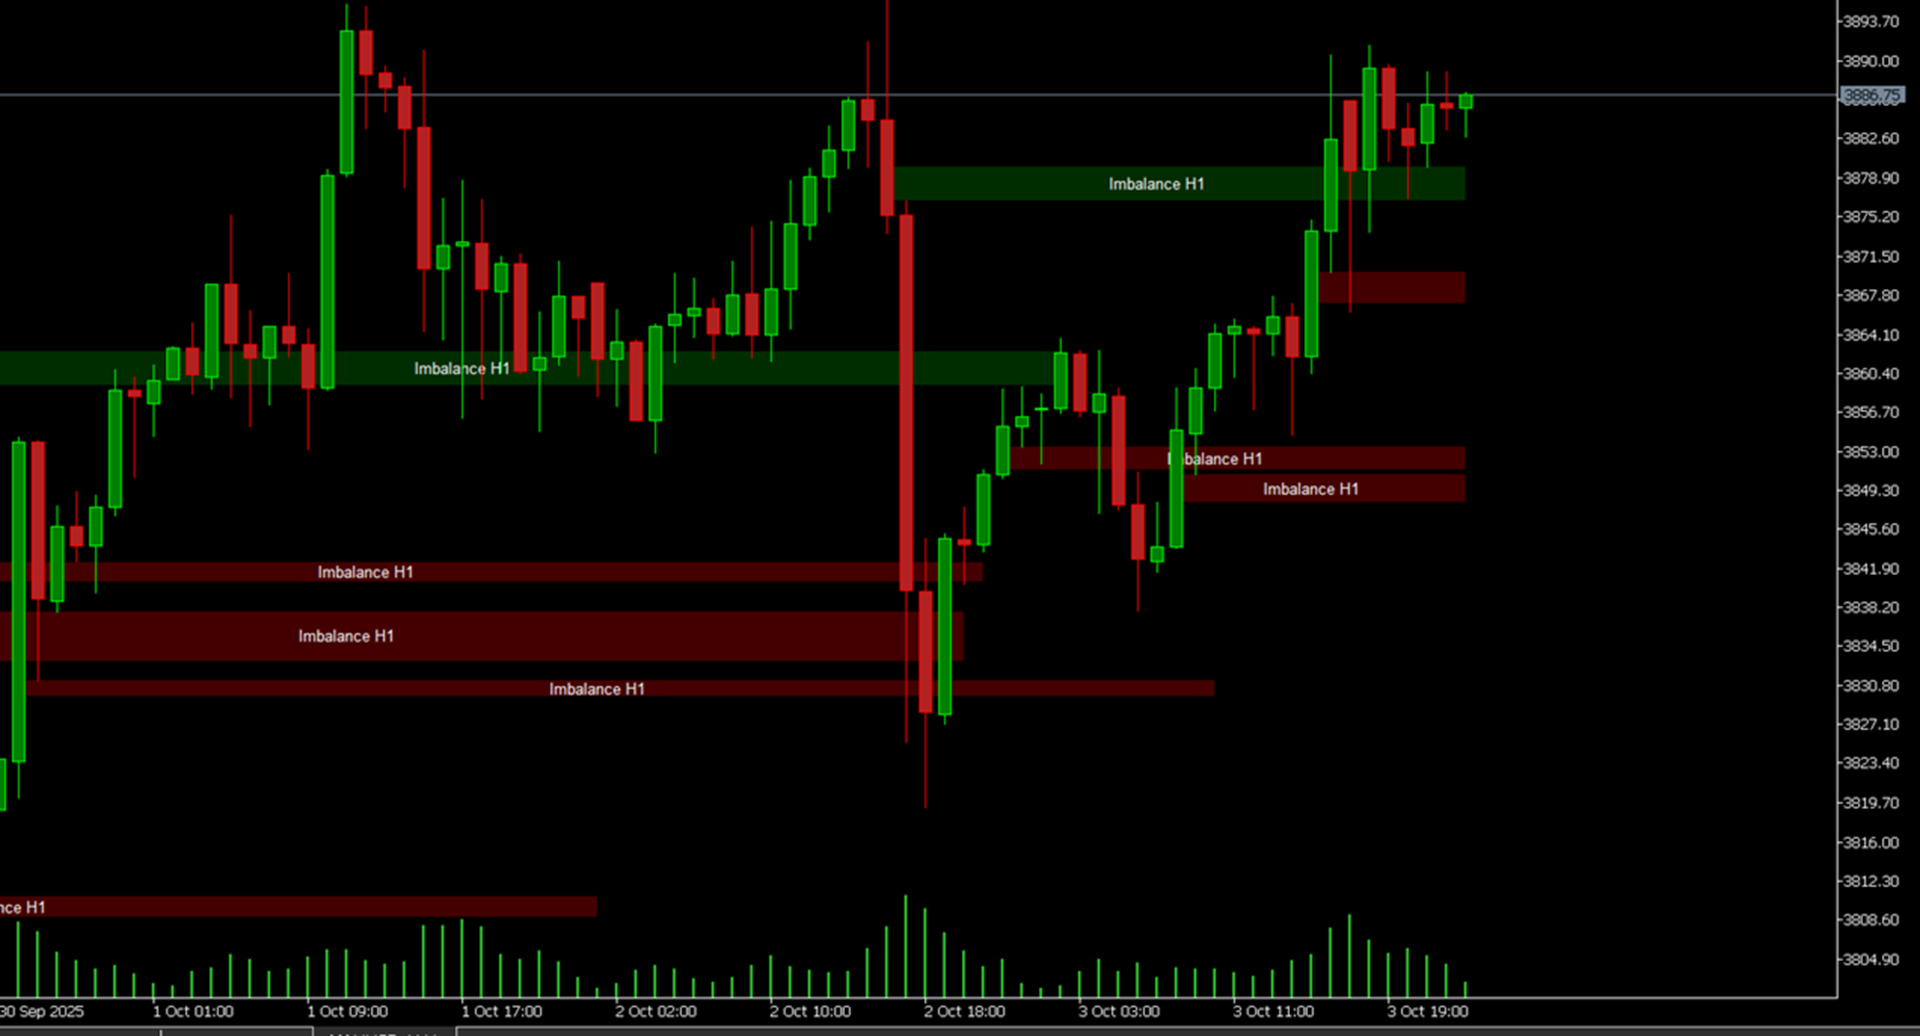
  1. Unmistakable Visualization: No more squinting at every candle. The indicator automatically identifies and highlights zones of bullish and bearish imbalances. Green rectangles for buy zones. Red for sell zones. It's genius in its simplicity.

  2. Intelligent Recognition: This indicator doesn't just draw gaps. It analyzes the context:

    • Size Filter: Eliminates "noise" thanks to the  MinGapSize  setting.

    • Multi-Timeframe Analysis: Discover key imbalances on a higher timeframe ( SourceTimeframe ) that will act as powerful magnets for price on your trading TF.

    • Auto-Prolongation ( ProlongationBars ): The zone automatically extends to the right, remaining visible until price decides to engage with it.

  3. Interactive Market Management (Killer Feature):
    Click on an imbalance zone! The indicator allows you to extend it to the current moment or restore it with a single click. This is your tactical tool for tracking the most critical levels in real-time.

  4. Professional Aesthetics: Ready-made color schemes ( IsDark ), customizable transparency — all designed for comfortable, eye-strain-free trading sessions.

💡 3 Powerful Trading Ideas with ImbalanceCandleAnalyzer

Idea 1: "The Precision Retest Entry"

  • Scenario: After a strong impulse move, price leaves a trail of imbalances.

  • Action: Wait for a retracement (retest) to the most significant imbalance zone. As price touches the zone, look for a confirming Bullish/Bearish Engulfing or Pin Bar pattern to enter in the direction of the initial impulse.

  • Why the Indicator Helps? It instantly highlights the "fattest" and most relevant imbalance to focus on, filtering out the noise.

Idea 2: "Breakout & Re-confirmation Strategy"

  • Scenario: Price is consolidating in a tight range.

  • Action: After the breakout, identify the newly formed imbalance. Instead of entering on the initial breakout (often false), enter on the first pullback to the edge of this imbalance zone, which now acts as support/resistance.

  • Why the Indicator Helps? It shows you exactly where to expect that pullback, increasing your chances of getting a better entry price.

Idea 3: "The Multi-Timeframe Fusion"

  • Scenario: You identify the primary trend on the Daily (D1) chart.

  • Action: On your hourly (H1) chart, set the indicator with  SourceTimeframe = PERIOD_H4 . Look for imbalances on H4 that align with the D1 trend direction. Enter on H1 when price touches these "higher-timeframe" zones.

  • Why the Indicator Helps? You are no longer trading just any imbalance, but the strongest ones from a higher timeframe, significantly increasing your win rate.

💰 Smart Money Concept & Risk Management Analysis

The ICT strategy and Smart Money Concept are all about following the footprints of large players. Imbalances are these footprints. The ImbalanceCandleAnalyzer makes you the tracker who sees these footprints faster and clearer than anyone else.

  • Stop-Loss: Placed just beyond the opposite edge of the imbalance zone. If price fills the entire imbalance, your thesis is invalidated, and it's time to exit.

  • Take-Profit: Your targets are the next significant imbalances in the trend's direction or key liquidity levels (previous highs/lows). The indicator helps visualize this "chain" of targets.

  • Risk Management: The clarity of the zones allows for precise position sizing based on the distance to your stop-loss.

⚙️ Quick Start: Key Settings for Instant Precision

Don't get lost in the options! Here is a starter config for rapid success:

  1. Core Settings:

    • ProlongationBars = 20  (The zone will remain visible longer; you won't miss a thing).

    • ShowLabels = true  (Always know what you're looking at).

    • UseTimeframeBasedGap = true  (The most intelligent setting! The indicator adapts to your TF's volatility).

    • TimeframeGapMultiplier = 1.0  (Start here, increase to 1.5-2.0 to filter for only the largest imbalances).

  2. Multi-Timeframe Power:

    • SourceTimeframe = PERIOD_H4  (Find "higher-TF" imbalances for the highest-quality signals).

  3. Visuals for Victory:

    • IsDark = true  (For dark themes, the standard for most traders).

    • ImbalanceTransparency = 60  (The perfect balance of visibility and subtlety).

🚀 Conclusion: Is Your Decision Made?

Ask yourself: will you continue to waste time on routine analysis, missing the best entries, or will you grant yourself a technological advantage?

The ImbalanceCandleAnalyzer is not just "another indicator." It is the bridge between your understanding of ICT theory and its practical, profitable execution. It's your chance to trade smarter, not harder.

Don't adapt to the market. Make it work for you.


Prodotti consigliati
TRI Visualizer
Yoshimi Mon 三 Ura
TRI Visualizer MT5 – Thermodynamic Market Analysis Overview The TRI (Thermal Range Indicator) Visualizer Enhanced is a rare market analysis indicator that goes beyond conventional technical analysis, applying principles of thermodynamics from physics. It interprets market price fluctuations as “thermodynamic energy,” enabling the highly accurate detection of subtle market changes that are often overlooked. Innovative Mechanisms 1. Dual Calculation Engines Classic TRI Mode Formula: |Close
RBreaker
Zhong Long Wu
RBreaker Gold Indicators is a short-term intraday trading strategy for gold futures that combines trend following and intraday reversal approaches. It not only captures profits during trending markets but also enables timely profit-taking and counter-trend trading during market reversals. This strategy has been ranked among the top ten most profitable trading strategies by the American magazine   Futures Truth   for 15 consecutive years. It boasts a long lifecycle and remains widely used and st
Volume Profile V6
Andrey Kolesnik
4.67 (3)
Indicatore del profilo di volume del mercato + oscillatore intelligente. Funziona su quasi tutti gli strumenti: coppie di valute, azioni, futures, criptovalute, sia su volumi reali che su tick. È possibile impostare la definizione automatica dell'intervallo di costruzione del profilo (ad esempio, per una settimana o un mese, ecc.), oppure impostare l'intervallo manualmente spostando i confini (due linee verticali: rossa e blu). Viene visualizzato sotto forma di istogramma. La larghezza dell'isto
Price Magnet — Price Density and Attraction Levels Indicator Price Magnet is a professional analytical tool designed to identify key support and resistance levels based on statistical Price Density. The indicator analyzes a specified historical period and detects price levels where the market spent the most time. These zones act as “magnets,” attracting price action or forming a structural base for potential reversals. Unlike traditional Volume Profile tools, Price Magnet focuses on price-time d
STRICTLY FOR BOOM INDEX ONLY!!!!! Here I bring the Maximum Trend Arrows OT1.0 MT5 indicator. This indicator is made up of a combination of different trend indicators for entries and exits, for entries an orange arrow will paint on the chart below the current market and a red flag for closing of trades and it produces buy arrows only. When the orange arrow appears, it will appear along with it's sound to notify you. The 1H timeframe is recommended, don't use it anywhere else than on the 1H timefr
# DRAWDOWN INDICATOR V4.0 - The Essential Tool to Master Your Trading ## Transform Your Trading with a Complete Real-Time Performance Overview In the demanding world of Forex and CFD trading, **knowing your real-time performance** isn't a luxury—it's an **absolute necessity**. The **Drawdown Indicator V4.0** is much more than a simple indicator: it's your **professional dashboard** that gives you a clear, precise, and instant view of your trading account status. --- ## Why This Indicator
Pro Gold System Indicator
PEDRO JOAQUIM GONCALVES GOMES
ADVANCED FUNCTIONALITIES: Trend Score (0-100) with visual bar Intelligent signals with adjustable strength (1-10) Risk management with automatic TP/SL Audible and visual alerts Price zones with smooth filling Multi-indicator analysis (RSI, ATR, BB, EMAs) DESIGN FEATURES Modern Visual: Smooth and well-spaced lines (EMA with 2-3px width) Vibrant and professional colors (Sky Blue, Orange, Gold) Modern arrows (code 233/234) for buy/sell signals Configurable dark/light theme Adjustable transparency f
CurvedSmoothChannel_Enhanced - Indicatore di Canale di Prezzo Migliorato **CurvedSmoothChannel_Enhanced** è un indicatore di canale di prezzo potente e visivamente accattivante, progettato per MetaTrader 5, che aiuta a identificare trend, potenziali inversioni e livelli di prezzo chiave con precisione. Questa versione migliorata combina la potenza della media mobile di Hull (HMA) e del filtro Super Smooth di John Ehlers, creando un canale dinamico e adattivo che si adatta alle condizioni di me
The  SuperTrend Advance Trading  is a widely-used technical indicator based on  SuperTrend Strategy + Price Action + EMA . How it works: -  Buy/Sell Signals  can be generated when the trend reverses, the conditions of Price action, TrendLine and EMA are met. - After the  Signal  appears, be patient and wait until the candle closes, at that time place the order as soon as possible. You may have time to review your entry, consider whether it is a good entry or not. - Carefully review the entry, up
Was: $249  Now: $99   Market Profile defines a number of day types that can help the trader to determine market behaviour. A key feature is the Value Area, representing the range of price action where 70% of trading took place. Understanding the Value Area can give traders valuable insight into market direction and establish the higher odds trade. It is an excellent addition to any system you may be using. Inspired by Jim Dalton’s book “Mind Over Markets”, this indicator is designed to suit the
Il livello Premium è un indicatore unico con una precisione superiore all'80% delle previsioni corrette! Questo indicatore è stato testato dai migliori Specialisti di Trading per più di due mesi! L'indicatore dell'autore che non troverai da nessun'altra parte! Dagli screenshot puoi vedere di persona la precisione di questo strumento! 1 è ottimo per il trading di opzioni binarie con un tempo di scadenza di 1 candela. 2 funziona su tutte le coppie di valute, azioni, materie prime, criptovalu
HMA Trend Professional MT5
Pavel Zamoshnikov
4.25 (4)
Improved version of the free HMA Trend indicator (for MetaTrader 4) with statistical analysis. HMA Trend is a trend indicator based on the Hull Moving Average (HMA) with two periods. HMA with a slow period identifies the trend, while HMA with a fast period determines the short-term movements and signals in the trend direction. The main differences from the free version: Ability to predict the probability of a trend reversal using analysis of history data. Plotting statistical charts for analyzi
L'indicatore costruisce le quotazioni attuali, che possono essere confrontate con quelle storiche e su questa base fanno una previsione del movimento dei prezzi. L'indicatore ha un campo di testo per una rapida navigazione fino alla data desiderata. Opzioni: Simbolo - selezione del simbolo che visualizzerà l'indicatore; SymbolPeriod - selezione del periodo da cui l'indicatore prenderà i dati; IndicatorColor - colore dell'indicatore; HorisontalShift - spostamento delle virgolette disegnate d
Noize Absorption Index - is the manual trading system that measures the difference of pressure between bears forces and bulls forces. Green line - is a noize free index that showing curent situation. Zero value of index shows totally choppy/flat market.Values above zero level shows how powerfull bullish wave is and values below zero measures bearish forces.Up arrow appears on bearish market when it's ready to reverse, dn arrow appears on weak bullish market, as a result of reverse expectation.
Crash 1000 Scalping Indicator for the Crash 1000 Deriv Synthetic Index. Introduction The Crash 1000 Scalping Indicator is a specialized tool designed for the Crash 1000 index on the Deriv Synthetic market. This indicator is particularly useful for scalping on the M1 timeframe, helping traders to identify precise entry and exit points for buy positions. It is designed to be non-repainting, providing clear signals with audible alerts and push notifications, and is compatible with mobile devices th
L'indicateur SMC Venom Model BPR est un outil professionnel pour les traders travaillant dans le concept Smart Money (SMC). Il identifie automatiquement deux modèles clés sur le graphique des prix: FVG   (Fair Value Gap) est une combinaison de trois bougies, dans laquelle il y a un écart entre la première et la troisième bougie. Forme une zone entre les niveaux où il n'y a pas de support de volume, ce qui conduit souvent à une correction des prix. BPR   (Balanced Price Range) est une combinaiso
Trade smarter, not harder: Empower your trading with Harmonacci Patterns This is arguably the most complete harmonic price formation auto-recognition indicator you can find for the MetaTrader Platform. It detects 19 different patterns, takes fibonacci projections as seriously as you do, displays the Potential Reversal Zone (PRZ) and finds suitable stop-loss and take-profit levels. [ Installation Guide | Update Guide | Troubleshooting | FAQ | All Products ] It detects 19 different harmonic pri
Innanzitutto, vale la pena sottolineare che questo Strumento di Trading è un Indicatore Non-Ridipingente, Non-Ridisegnante e Non-Laggante, il che lo rende ideale per il trading professionale. Corso online, manuale utente e demo. L'Indicatore Smart Price Action Concepts è uno strumento molto potente sia per i nuovi che per i trader esperti. Racchiude più di 20 utili indicatori in uno solo, combinando idee di trading avanzate come l'Analisi del Trader del Circolo Interno e le Strategie di Tradin
The Riko Trend indicator is a revolutionary trend trading and filtering solution with all the important features of a trend tool built into one tool! The Riko Trend indicator is good for any trader, suitable for any trader for both forex and binary options. You don’t need to configure anything, everything is perfected by time and experience, it works great during a flat and in a trend. The Riko Trend indicator is a technical analysis tool for financial markets that reflects the current price f
Binary Options Assistant (BOA) Multi Currency Dashboard for Binary Options (MT5) . You can use any of the BOA Signals Indicators with the dashboard. Just change the BOA Signals Indicator Name in the dashboard settings to the indicator you want to get signals from. For example: CHILL. BLAZE:  BOA_BLAZE_Indicator_v1   Strategy :   BLW Online Trading Binary Options Strategy (3 Moving Average) LAVA:  BOA_LAVA_Indicator_v1   Strategy:   Lady Trader Binary Options Strategy (Bollinger Bands & Stochas
Inverted_Chart_EA Utility Expert Advisor Inverted_Chart_EA creates and maintains a mirror-inverted chart of any symbol and timeframe. It automatically generates a custom instrument (e.g. US30_INV ) and keeps its price history updated in real time, with bars mirrored around a chosen pivot. This utility gives traders a new way to analyze the market from a different perspective by flipping the chart upside down. Why use an inverted chart? Highlight hidden patterns – price formations that look ordin
US30NinjaMT5
Satyaseelan Shankarananda Moodley
US30 Ninja is a 5 minute scalping indicator that will let know you when there is a trade set up (buy or sell). Once the indicator gives the trade direction, you can open a trade and use a 30 pip stop loss and a 30 pip to 50 pip take profit. Please trade at own own risk. This indicator has been created solely for the US30 market and may not yield positive results on any other pair. 
Apex Fibo Tracer — Smart Auto-Fibonacci Tool Apex Fibo Tracer is a professional analytical indicator that automates one of the most powerful methods in technical analysis — Fibonacci retracement levels. By combining a high-precision ZigZag algorithm with dynamic Fibonacci plotting, the tool delivers instant and accurate visualization of market structure directly on your chart. Most traders lose valuable seconds manually adjusting Fibonacci grids during high volatility. Apex Fibo Tracer eliminate
Alpha Trend MT5 is a trend indicator for the MetaTrader 5 platform; it has been developed by a group of professional traders. The Alpha Trend MT5 indicator finds the most probable tendency reversal points, which allows making trades at the very beginning of a trend. This indicator features notifications, which are generated whenever a new signal appears (alert, email, push-notification). This allows you to open a position in a timely manner. Alpha Trend does not redraw, which makes it possible t
SMC Pro mt5
Osama Echchakery
SMC Pro – Indicatore Smart Money Concepts Sblocca la vera logica del mercato e fai trading basandoti sul comportamento istituzionale invece del rumore retail. SMC Pro è un indicatore completo Smart Money Concepts progettato per offrire ai trader una profonda comprensione della struttura di mercato, della liquidità e della price action. Combina molteplici concetti avanzati in un unico strumento ottimizzato ed efficiente, adatto sia al trading manuale che al backtesting. Pricing Prezzo di lancio:
The Super Arrow Indicator provides non-repainting buy and sell signals with exceptional accuracy. Key Features No repainting – confirmed signals remain fixed Clear visual arrows: green for buy, red for sell Real-time alerts via pop-up, sound, and optional email Clean chart view with no unnecessary clutter Works on all markets: Forex, gold, oil, indices, crypto Adjustable Parameters TimeFrame Default:   "current time frame" Function:   Sets the time frame for indicator calculation Options:   Can
Divergent Stochastic Filter II Catch Reversals Early, Filter Noise, Trade with Confidence The Edge: Why This Stochastic is Different  Every trader knows the Stochastic oscillator. But knowing when to trust its signals, that's the real challenge. The Divergent Stochastic Filter II transforms this classic indicator into a precision reversal detection system by adding critical elements: divergence intelligence, signal filtering and exhaustion detection.  While standard Stochastic oscillators fire s
ALGOTRIBE Volatility Filter (GVZ + ATR) Institutional Volatility Intelligence for Smart Risk Control Category: Volatility & Risk Management Platform: MetaTrader 5 Type: Indicator (Chart Window) Overview ALGOTRIBE Volatility Filter is a next-generation volatility intelligence tool engineered to help traders anticipate, interpret, and manage market volatility with precision. By combining the CBOE Gold Volatility Index (GVZ) with a dynamic ATR-based engine , the indicator identifies real-ti
Boom and crash arrow
Tshivhidzo Moss Mbedzi
This indicator is based on an advanced strategy primarily for trading spikes on Boom and Crash Indices. Complex algorithms were implanted to detect high probability entries only. It alerts on potential Buy and Sell entries. To trade spikes on the Deriv or Binary broker, only take Buy Boom and Sell Cash alerts. It was optimized for 5-minute timeframe. the indicator will  tell you were to sell and buy its good for  boom and crash and currency  pairs  ,EURUSD ,GBPUSD,NAS100, 89% no repaint  Feature
Overview Heiken Ashi CE Filtered MT5 is a technical indicator for the MetaTrader 5 platform. It integrates smoothed candlestick charting with a dynamic exit strategy and a customizable trend filter to deliver clear buy and sell signals. The indicator is designed to improve trend detection and signal reliability by reducing market noise. If you want to see more high-quality products or order the development/conversion of your own products, visit my partners' website: 4xDev Get 10% OFF on manual
Gli utenti di questo prodotto hanno anche acquistato
SuperScalp Pro
Van Minh Nguyen
4.72 (18)
SuperScalp Pro – Sistema avanzato di indicatore per scalping con filtri multipli SuperScalp Pro è un sistema avanzato di indicatore per scalping che combina il classico Supertrend con molteplici filtri di conferma intelligenti. L’indicatore funziona in modo efficiente su tutti i timeframe da M1 a H4 ed è particolarmente adatto per XAUUSD, BTCUSD e le principali coppie Forex. Può essere utilizzato come sistema stand-alone o integrato in modo flessibile nelle strategie di trading esistenti. L’indi
Azimuth Pro
Ottaviano De Cicco
5 (6)
LAUNCH PROMO Azimuth Pro price is initially set at 299$ for the first 100 buyers. Final price will be 499$ . THE DIFFERENCE BETWEEN RETAIL AND INSTITUTIONAL ENTRIES ISN'T THE INDICATOR — IT'S THE LOCATION. Most traders enter at arbitrary price levels, chasing momentum or reacting to lagging signals. Institutions wait for price to reach structured levels where supply and demand actually shift. Azimuth Pro maps these levels automatically: swing-anchored VWAP, multi-timeframe structure lines, an
Entry In The Zone and SMC Multi Timeframe is a real-time 2-in-1 market analysis tool that combines market structure analysis and a No Repaint BUY / SELL signal system into a single indicator, built on Smart Money Concepts (SMC) — a widely adopted framework used by professional traders to understand market structure. This indicator helps you see the market more clearly, make decisions based on structure rather than guesswork, and focus on high-probability zones where price is more likely to react
Divergence Bomber
Ihor Otkydach
4.9 (86)
Ogni acquirente dell’indicatore riceverà inoltre gratuitamente: L’utilità esclusiva “Bomber Utility”, che gestisce automaticamente ogni operazione, imposta i livelli di Stop Loss e Take Profit e chiude le posizioni secondo le regole della strategia I file di configurazione (set file) per adattare l’indicatore a diversi asset I set file per configurare il Bomber Utility in tre modalità: “Rischio Minimo”, “Rischio Bilanciato” e “Strategia di Attesa” Una guida video passo-passo per installare, conf
Se acquisti questo indicatore, riceverai il mio Trade Manager Professionale + EA  GRATUITAMENTE. Innanzitutto è importante sottolineare che questo sistema di trading è un indicatore Non-Repainting, Non-Redrawing e Non-Lagging, il che lo rende ideale sia per il trading manuale che per quello automatico. Corso online, manuale e download di preset. Il "Sistema di Trading Smart Trend MT5" è una soluzione completa pensata sia per i trader principianti che per quelli esperti. Combina oltre 10 indicat
Meridian Pro
Ottaviano De Cicco
5 (1)
Meridian Pro: Professional Multi-Timeframe Trend Matrix for MT5 Overview Meridian Pro is a multi-timeframe trend matrix by Merkava Labs that compresses directional state, strength, momentum condition and matrix agreement into one compact panel. One adaptive engine, applied consistently from M1 to W1. No per-symbol tuning. No indicator stacking. One structured readout across every asset and every timeframe. Launch Offer — Get Meridian Pro for USD 99 (introductory). Regular price: USD 149. 1. Why
OmniSync Projection
Antonio-alin Teculescu
5 (1)
Chronos Fractal Engine is an innovative price projection indicator for MetaTrader 5, designed to transform your technical analysis by intelligently identifying and projecting historical price patterns. Built upon an advanced correlation algorithm and the fractal principles of the market, this powerful tool visualizes potential future price movements, giving you a unique edge in your trading decisions. What is Chronos Fractal Engine? At its core, the Chronos Fractal Engine employs a sophisticat
Trend Screener Pro MT5
STE S.S.COMPANY
4.85 (104)
Indicatore di tendenza, soluzione unica rivoluzionaria per il trading di tendenze e il filtraggio con tutte le importanti funzionalità di tendenza integrate in un unico strumento! È un indicatore multi-timeframe e multi-valuta al 100% non ridipingibile che può essere utilizzato su tutti i simboli/strumenti: forex, materie prime, criptovalute, indici e azioni. Trend Screener è un indicatore di tendenza che segue un indicatore efficiente che fornisce segnali di tendenza a freccia con punti nel gra
Btmm state engine pro
Garry James Goodchild
5 (3)
BTMM State Engine Pro is a MetaTrader 5 indicator for traders who use the Beat The Market Maker approach: Asian session context, kill zone timing, level progression, peak formation detection, and a multi-pair scanner from a single chart. It combines cycle state logic with a built-in scanner dashboard so you do not need the same tool on many charts at once. What it does Draws the Asian session range; session times can follow broker server offset or be set in inputs. Tracks level progression (L
Scopri quale strategia funziona davvero sul tuo simbolo - prima di rischiare denaro reale. Power Bar rileva le barre di prezzo estreme su qualsiasi simbolo e qualsiasi timeframe, poi esegue istantaneamente il backtest di 3 diverse strategie di trading per confrontare tassi di vincita, fattori di profitto e P&L fianco a fianco. Tutto in un unico pannello interattivo. Niente supposizioni. Niente curve-fitting. Solo dati. Cosa rende Power Bar unico? La maggior parte degli indicatori fornisce un se
FX Trend MT5 NG
Daniel Stein
5 (4)
FX Trend NG: La Nuova Generazione di Intelligenza di Trend Multi-Mercato Panoramica FX Trend NG è uno strumento professionale di analisi del trend multi-timeframe e monitoraggio dei mercati. Ti consente di comprendere la struttura completa del mercato in pochi secondi. Invece di passare tra numerosi grafici, puoi identificare immediatamente quali strumenti sono in trend, dove il momentum sta diminuendo e dove esiste un forte allineamento tra i timeframe. Offerta di Lancio – Ottieni FX Trend NG
Crystal Heikin Ashi Signals
Muhammad Jawad Shabir
5 (2)
Crystal Heikin Ashi Signals - Professional Trend & Signal Detection Indicator Advanced Heikin Ashi Visualization with Intelligent Signal System for Manual & Automated Trading Final Price: $149 ---------> Price goes up $10 after every 10 sales . Limited slots available — act fast . Overview Crystal Heikin Ashi Signals is a professional-grade MetaTrader 5 indicator that combines pure Heikin Ashi candle visualization with an advanced momentum-shift detection system. Designed for both manual traders
RFI levels PRO MT5
Roman Podpora
3.67 (3)
L'indicatore mostra accuratamente i punti di inversione e le zone di ritorno dei prezzi in cui il       Principali attori   . Vedi dove si formano le nuove tendenze e prendi decisioni con la massima precisione, mantenendo il controllo su ogni operazione. VERSION MT4     -    Rivela il suo massimo potenziale se combinato con l'indicatore   TREND LINES PRO Cosa mostra l'indicatore: Strutture di inversione e livelli di inversione con attivazione all'inizio di un nuovo trend. Visualizzazione dei li
Trend indicator AI mt5
Ramil Minniakhmetov
5 (16)
Trend Ai indicator è un ottimo strumento che migliorerà l'analisi di mercato di un trader combinando l'identificazione della tendenza con punti di ingresso utilizzabili e avvisi di inversione. Questo indicatore consente agli utenti di navigare nelle complessità del mercato forex con fiducia e precisione Oltre ai segnali primari, l'indicatore Ai di tendenza identifica i punti di ingresso secondari che si presentano durante i pullback o i ritracciamenti, consentendo ai trader di capitalizzare le
Bill Williams Advanced
Siarhei Vashchylka
5 (11)
Bill Williams Advanced is designed for automatic chart analysis using Bill Williams' "Profitunity" system. The indicator analyzes four timeframes at once. Manual (Be sure to read before purchasing) Advantages 1. Analyzes the chart using Bill Williams' "Profitunity" system. Signals are displayed in a table in the corner of the screen and on the price chart. 2. Finds all known AO and AC signals, as well as zone signals. Equipped with a trend filter based on the Alligator. 3. Finds "Divergence Bar
Atomic Analyst MT5
Issam Kassas
3.94 (31)
Innanzitutto, vale la pena sottolineare che questo indicatore di trading non è repaint, non è ridisegno e non presenta ritardi, il che lo rende ideale sia per il trading manuale che per quello automatico. Manuale utente: impostazioni, input e strategia. L'Analista Atomico è un indicatore di azione del prezzo PA che utilizza la forza e il momentum del prezzo per trovare un miglior vantaggio sul mercato. Dotato di filtri avanzati che aiutano a rimuovere rumori e segnali falsi, e aumentare il pote
Quantum TrendPulse
Bogdan Ion Puscasu
5 (22)
Ecco   Quantum TrendPulse   , lo strumento di trading definitivo che combina la potenza di   SuperTrend   ,   RSI   e   Stocastico   in un unico indicatore completo per massimizzare il tuo potenziale di trading. Progettato per i trader che cercano precisione ed efficienza, questo indicatore ti aiuta a identificare con sicurezza le tendenze di mercato, i cambiamenti di momentum e i punti di entrata e uscita ottimali. Caratteristiche principali: Integrazione SuperTrend:   segui facilmente l'andame
Gann Made Easy è un sistema di trading Forex professionale e facile da usare che si basa sui migliori principi del trading utilizzando la teoria di mr. WD Gann. L'indicatore fornisce segnali ACQUISTA e VENDI accurati, inclusi i livelli di Stop Loss e Take Profit. Puoi fare trading anche in movimento utilizzando le notifiche PUSH. CONTATTAMI DOPO L'ACQUISTO PER RICEVERE GRATUITAMENTE LE ISTRUZIONI DI TRADING E OTTIMI INDICATORI EXTRA! Probabilmente hai già sentito parlare molte volte dei metodi d
PZ Trend Trading MT5
PZ TRADING SLU
3.8 (5)
Capture every opportunity: your go-to indicator for profitable trend trading Trend Trading is an indicator designed to profit as much as possible from trends taking place in the market, by timing pullbacks and breakouts. It finds trading opportunities by analyzing what the price is doing during established trends. [ Installation Guide | Update Guide | Troubleshooting | FAQ | All Products ] Trade financial markets with confidence and efficiency Profit from established trends without getting whip
RelicusRoad Pro: Sistema Operativo Quantitativo di Mercato 70% DI SCONTO ACCESSO A VITA (TEMPO LIMITATO) - UNISCITI A 2.000+ TRADER Perché la maggior parte dei trader fallisce anche con indicatori "perfetti"? Perché operano su Singoli Concetti isolati. Un segnale senza contesto è una scommessa. Per vincere serve CONFLUENZA . RelicusRoad Pro non è un semplice indicatore. È un Ecosistema Quantitativo completo . Mappa la "Fair Value Road", distinguendo tra rumore e rotture strutturali. Smetti di in
FX Power MT5 NG
Daniel Stein
5 (31)
FX Power: Analizza la Forza delle Valute per Decisioni di Trading Più Intelligenti Panoramica FX Power è lo strumento essenziale per comprendere la reale forza delle principali valute e dell'oro in qualsiasi condizione di mercato. Identificando le valute forti da comprare e quelle deboli da vendere, FX Power semplifica le decisioni di trading e rivela opportunità ad alta probabilità. Che tu segua le tendenze o anticipi inversioni utilizzando valori estremi di Delta, questo strumento si adatta
Currency Strength Dashboard Pro Pannello professionale di analisi della forza delle valute in tempo reale per MetaTrader 5 . L’indicatore calcola e visualizza la forza di 8 valute principali (EUR, USD, GBP, JPY, CHF, AUD, CAD, NZD) utilizzando 28 coppie di valute simultaneamente su più timeframe. Il pannello offre al trader una visione completa del mercato a colpo d’occhio — senza calcoli aggiuntivi né la necessità di passare tra diversi grafici. Metodo di calcolo L’indicatore si basa su un meto
CGE Trading Suite
Carl Gustav Johan Ekstrom
5 (1)
CGE Trading Suite delivers the analytical edge typically reserved for professional trading desks. The platform integrates a full suite of analytical tools into one seamless workflow: dynamic grid mapping, liquidity behavior analysis, ECM, trend lines, MIDAS, trade cycles, and directional channel projections. Together, these provide a unified view of market structure and momentum. Directional clarity is further enhanced by the capital flow index, which measures currency basket strength to identif
ARIPoint
Temirlan Kdyrkhan
ARIPoint is a powerful trading companion designed to generate high-probability entry signals with dynamic TP/SL/DP levels based on volatility. Built-in performance tracking shows win/loss stats, PP1/PP2 hits, and success rates all updated live. Key Features: Buy/Sell signals with adaptive volatility bands Real-time TP/SL/DP levels based on ATR Built-in MA Filter with optional ATR/StdDev volatility Performance stats panel (Success, Profit/Loss, PP1/PP2) Alerts via popup, sound, push, or email Cu
Trend Lines PRO MT5
Roman Podpora
5 (1)
LINEE DI TENDENZA PRO  Aiuta a capire dove il mercato sta realmente cambiando direzione. L'indicatore mostra reali inversioni di tendenza e punti in cui i principali operatori rientrano. Vedi   Linee BOS   Cambiamenti di tendenza e livelli chiave su timeframe più ampi, senza impostazioni complesse o rumore inutile. I segnali non vengono ridisegnati e rimangono sul grafico dopo la chiusura della barra. VERSIONE MT4   -   Svela il suo massimo potenziale se abbinato all'indicatore   RFI LEVELS PRO
Berma Bands
Muhammad Elbermawi
5 (8)
L'indicatore Berma Bands (BBs) è uno strumento prezioso per i trader che cercano di identificare e capitalizzare i trend di mercato. Analizzando la relazione tra il prezzo e le BBs, i trader possono discernere se un mercato è in una fase di trend o di range. Visita il [ Berma Home Blog ] per saperne di più. Le Berma Bands sono composte da tre linee distinte: la Upper Berma Band, la Middle Berma Band e la Lower Berma Band. Queste linee sono tracciate attorno al prezzo, creando una rappresentazion
Advanced Supply Demand MT5
Bernhard Schweigert
4.53 (15)
La migliore soluzione per qualsiasi principiante o trader esperto! Questo indicatore è uno strumento di trading unico, di alta qualità e conveniente perché abbiamo incorporato una serie di funzionalità proprietarie e una nuova formula. Con questo aggiornamento, sarai in grado di mostrare fusi orari doppi. Non solo potrai mostrare una TF più alta, ma anche entrambe, la TF del grafico, PIÙ la TF più alta: SHOWING NESTED ZONES. Tutti i trader di domanda di offerta lo adoreranno. :) Informazioni imp
Gold Sniper Scalper Pro
Ich Khiem Nguyen
3.78 (9)
Gold Sniper Scalper Pro è un indicatore per MetaTrader 5 costruito specificamente per rilevare pattern di falsa rottura (false breakout) su XAUUSD. Identifica la struttura trappola a 4 barre dove il prezzo supera il confine di un range, attira i trader di rottura e poi inverte — confermando che il movimento era una falsa rottura. L'indicatore valuta ogni setup secondo 17 fattori di qualità, lo elabora attraverso un pipeline di confluenza a 4 livelli, lo verifica contro un motore di consenso di
Auto Optimized Parabolic RSI: Motore di Momentum 3D Avanzato La maggior parte degli indicatori per trader privati fallisce perché si affida a parametri statici che smettono di funzionare nel momento in cui la volatilità del mercato cambia. Auto Optimized Parabolic RSI risolve il problema dell'"obsolescenza dell'indicatore" ricalcolando continuamente il proprio vantaggio matematico, portando un adattamento quantitativo di livello istituzionale direttamente sul tuo terminale MT5. Il Vantaggio Prin
Trend Hunter MT5
Andrey Tatarinov
5 (4)
Trend Hunter è un indicatore di tendenza per lavorare nei mercati Forex, criptovaluta e CFD. Una caratteristica speciale dell'indicatore è che segue con sicurezza la tendenza, senza cambiare il segnale quando il prezzo supera leggermente la linea di tendenza. L'indicatore non viene ridisegnato; un segnale per entrare nel mercato appare dopo la chiusura della barra. Quando ci si sposta lungo un trend, l'indicatore mostra ulteriori punti di ingresso nella direzione del trend. Sulla base di quest
Altri dall’autore
RealChannel
Vladimir Utkin
1 (1)
The indicator based on the trading channel in the MT5 trading terminal is a tool that automatically builds a channel formed by the peaks of the price chart in an upward and downward sequence. This indicator helps traders identify support and resistance levels, market trends, as well as set stop-loss and take-profit levels for optimal trade management. This version of the indicator is equipped with a basic trading logic, which can be disabled in the settings and used as an indicator for your tra
FREE
Cazador de Oro
Vladimir Utkin
Инструкция по использованию советника TrendHanter для MetaTrader 5 1. Установка советника Скопируйте файлы : Поместите файл   TrendHanter.ex5   в папку: MT5 → MQL5 → Experts Запуск советника : Откройте MT5. Перетащите   TrendHanter   из раздела «Советники» на нужный график. Во вкладке «Общие» разрешите: Автоматическую торговлю   Разрешить оповещения 2. Настройка параметров Во вкладке «Параметры» настройте: Группа параметров Ключевые настройки Описание Stochastic InpKPeriod=14 ,   InpDPeriod=3
The Tick Volume Balance indicator is created based on the tick volumes of the instrument on the selected timeframe, taking into account the trading balance of supply and demand prices. The indicator considers the nature of candle formation used in the Price Action strategy. With equal volume, a regular candle and a candle with a pattern will have a larger size and will be colored according to its pattern. I would like to note that large volume candles colored in bullish and bearish colors at t
In the fast-paced world of cryptocurrency trading, understanding market dynamics is crucial for making informed decisions. One of the key indicators that traders use to analyze market behavior is Volume Delta, which offers insights into the balance between buying and selling pressure. This article explores the concept of Volume Delta, its significance in order flow analysis, and how it can be used effectively in trading strategies. By providing a clear understanding of this indicator, traders ca
### **User Guide for CVD Indicator Installation and Usage in MT5**   **Indicator Name:** Cumulative Volume Delta (CVD)   **Version:** 1.00   **Purpose:** Visualizes buy/sell pressure balance through volume analysis.   --- ### **Installation**   1. Download `CVD.mq5` file.   2. In MT5:      - `File` → `Open Data Folder`      - Navigate to `MQL5/Indicators`      - Paste the file into the folder.   3. Restart MT5.   4. In the "Navigator" panel:      - Right-click `CVD` → "Attach to Chart"    
Индикаторы профиля объёма: основные понятия Определение Профиль объёма — это продвинутый индикатор технического анализа, который показывает торговую активность за условленный период времени на определённых ценовых уровнях. С учётом таких пользовательских параметров, как количество строк и период времени, индикатор строит на графике гистограмму, отражающую доминирующие или значимые ценовые уровни, основанные на объёме. По сути, профиль объёма берёт в расчёт общий объём, торгуемый на определённом
### EMA Oscillator Analysis   **Working Principle:**   1. **Main Line Calculation (BufferV):**      - Computes price deviation from adaptive EMA.      - Formula: `BufferV[i] = Close[i] - (alpha * Close[i] + (1-alpha) * BufferV[i-1])`      - Where `alpha = 2/(ema_period+1)`.   2. **Volatility Bands:**      - `BufferDev`/`BufferNegDev`: ±1 standard deviation.      - `BufferDevLimit`/`BufferNegDevLimit`: ±2 standard deviations (multiplied by `limit_factor`).      - Standard deviation is calculate
Positioner EA
Vladimir Utkin
What is this?   This Expert Advisor adds a visual trading panel to MetaTrader 5 charts. Key features:   - Open/close trades with one click   - Manage Stop Loss (SL) and Take Profit (TP) levels   - Auto-apply risk settings   - Light/dark theme toggle    Interface:   1. Main panel with buttons:      - `BUY` – open buy order      - `SELL` – open sell order      - `CLOSE ALL` – close all trades      - `On/Off` – hide/show panel   2. Input fields:      - `Stop Loss (SL)` – SL distance in points  
Complete Advisor Description for MetaTrader 5 Video  https://youtu.be/7BKaf6kB-OQ?si=MB684rKT8f2f1rmv Advisor Logic The advisor uses a   dual stochastic   system: Senior timeframe   defines the trend. Junior timeframe   finds entry points. Fractal levels   build support/resistance. Signals are filtered by: Order rules ( isFreeOpen / isTwoOpen / isOneOpen ) Reverse signals ( Revers ) Stop levels based on fractals or %/pips. Key Parameters Parameter Group Parameter Description Stochastic SeniorTF
Description of the "GraphicPatternsBuilder" Indicator    Principle of Operation and Advantages:   The indicator automatically plots support (green) and resistance (red) lines on the chart, identifying key price levels. Works on any asset (cryptocurrency, stocks, Forex) and all timeframes.    Key Advantages:  1.  Automation of Routine Work  – The indicator independently identifies significant extrema and draws lines.   2.  Two Construction Algorithms :      -  Type 1 : Line is built using two
RangerTrader
Vladimir Utkin
Advertising Brochure: Trading Advisor Ranger v1.02 Professional Range Trading Tool "Range Breaker" Strategy: Innovative Market Approach Ranger is an intelligent trading system based on price range breakouts with mathematically verified risk management. The algorithm combines entry precision with multi-level capital protection. TOP-10 Ranger Advantages in Ascending Effectiveness: 10. Multi-Level Deposit Protection - Automatic lot calculation based on risk percentage - Built-in volatility fi
Cazador RSI
Vladimir Utkin
Cazador RSI Expert Advisor    Technical Overview & Algorithm Description Core Trading Strategy The Cazador RSI EA implements a sophisticated   RSI-based momentum strategy   with   pyramiding/averaging   capabilities: Entry Signals: BUY Trigger : RSI crosses above 20 level (oversold bounce) SELL Trigger : RSI crosses above 80 level (overbought reversal) Multiple Timeframe Confirmation : Uses current and historical RSI values Averaging System: Dynamic Position Sizing : Lot size increases
RangeZone  Indicator General Overview: Global Exchange Trading from East to West World financial markets operate on the principle of continuous trading sessions, where activity moves with the sun from one financial center to another. Understanding this dynamic is key to successful trading! How Trading Moves Around the World: Asian Session   (Sydney, Tokyo): Opens first, sets the tone for daily volatility Japanese yen, Australian dollar, Asian indices Often forms key support/resistance level
Filtro:
Nessuna recensione
Rispondi alla recensione