Range Exhaustion
- Göstergeler
- Sürüm: 1.0
- Etkinleştirmeler: 10

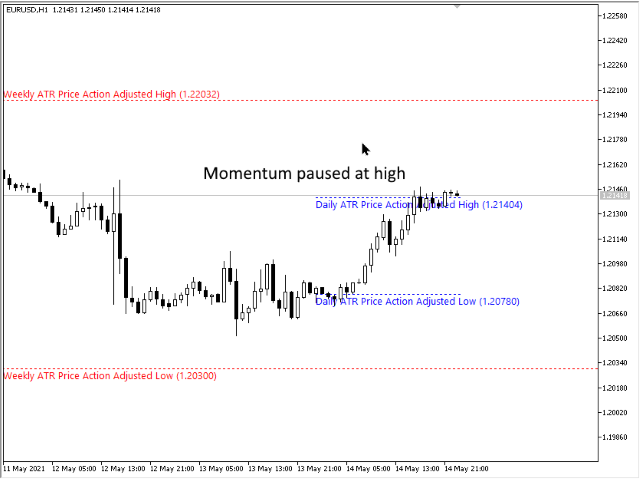
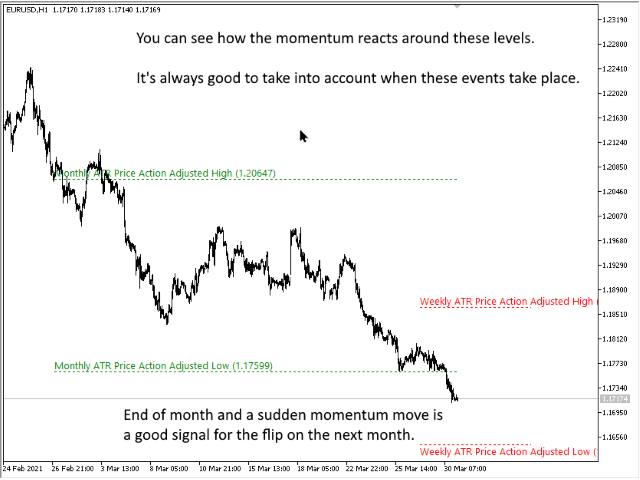
Aralık Tükenmesi, fiyat cari dönem için beklenen aralığı karşıladığında veya aştığında gerçekleşir. Bu seviyelerde fiyat, dönemin başına göre momentumunu kaybetmeye başlar, bu nedenle yeni pozisyonlar almadığınızdan emin olmak için iyi bir nokta.
Bu gösterge, Günlük, Haftalık ve Aylık dönemler için seviyeleri göstererek, grafiğinizde bunun olma olasılığının yüksek olduğu yerleri size gösterecektir.
Fiyatların bu tükenme seviyelerini aştığını gördüğünüzde, bu size hareketin arkasındaki momentumun çok güçlü olduğunu ve muhtemelen daha yüksek zaman dilimi seviyesine doğru ilerlediğini gösteriyor.
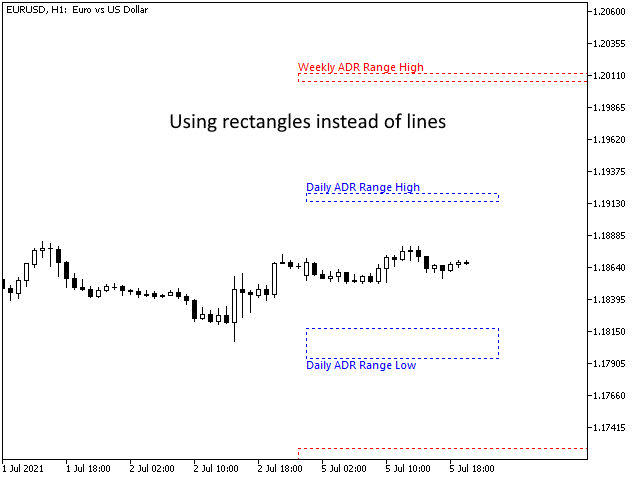
Gösterge, tercihlerinize bağlı olarak Ortalama Gerçek Aralık (ATR) veya Ortalama Aralık (ADR) hesaplamasını kullanabilir. Forex çizelgelerinde daha iyi çalıştığını düşündüğümüz için varsayılan olarak ATR'yi kullanıyoruz, ancak ADR'nin Hisse senedi tabanlı endeksler ve sembollerde üstünlüğü var.
Gösterge, aşağıda açıklanan ve onu ihtiyaçlarınıza göre uyarlamanıza izin veren bir dizi çizim moduna sahiptir.
AYARLAR
Hesaplama Modu
Seviyeleri hesaplamak için OrtalamaTrueRange (ATR) veya OrtalamaDailyRange (ADR) arasından seçim yapın.
Çizim Modu
Gösterge farklı şekillerde görüntülenebilir.
- Fiyat Düzeltilmiş Çizgi Çiz - Seviye, ulaşılan Yüksek ve Düşüklere bağlı olarak dönem boyunca ayarlanır. Bu, varsayılan ve en sık kullanılan yöntemdir.
- Beklenen Maksimum Çiz - Seviye sabit bir değerdir, son dönem kapanışı artı veya eksi ATR veya ADR değeridir.
- İki Çizgiyi Çiz - Yukarıdaki iki çizgiyi de gösterir.
- Dikdörtgen Çiz - Üst ve alt çizgilerin Fiyat Ayarlı ve Beklenen Maks/Min olduğu tek bir dikdörtgeni gösterir
İnceleme Dönemi
ATR/ADR değerleri hesaplanırken kullanılacak dönem.
Günlük Limitleri Göster
Doğru olduğunda, Günlük yorgunluk düzeylerini çizer.
Haftalık Limitleri Göster
Doğru olduğunda, Haftalık yorgunluk düzeylerini çizer.
Aylık Limitleri Göster
Doğru olduğunda, Aylık tükenme düzeylerini çizer.
Açıklamaları Göster
Doğru olduğunda, düzeyler için tanımlayıcı etiketler çizer. Yanlışsa, yalnızca çizgi çizilir, ancak çizgilerin neyi temsil ettiğini bilmeniz için araç ipuçları vardır.
Fiyatı Açıklamada Göster
Doğru olduğunda, seviye değeri açıklamaya ve araç ipucuna eklenir.
AçıklamaYazı TipiBoyutu
Açıklamaları çizerken kullanılacak yazı tipi boyutu
Genişletilmiş Çizgiler
Doğru olduğunda, çizgileri dönemin sonuna kadar çizmek yerine çizgiler grafiğin sağına süresiz olarak uzanır.
D1, W1 ve MN1 olmak üzere her zaman periyodu için aşağıdaki ayarlar görünür.
XX_Renk
Çizgileri çizerken kullanılacak renk ve açıklama
XX_LineWidth
Çizilecek çizginin genişliği. LineStyle, Solid dışında herhangi bir şeyse, bu değer yoksayılır. MetaTrader'da yalnızca düz çizgiler genişliğe sahip olabilir.
XX_LineStyle
Standart seçimden çizilecek çizginin türü.